
Research Article | DOI: https://doi.org/10.31579/2637-8914/267
1 Víctor A. Reale, Centro de Investigación y Desarrollo en Criotecnología de Alimentos (CIDCA). Facultad de Ciencias Exactas, National University of La Plata, Argentina.
2 Demarchi, S.M., Centro de Investigación y Desarrollo en Criotecnología de Alimentos (CIDCA). Facultad de Ciencias Exactas, National University of La Plata, Argentina.
3 R. Martin Torrez Irigoyen, Centro de Investigación y Desarrollo en Criotecnología de Alimentos (CIDCA). Facultad de Ciencias Exactas, National University of La Plata, Argentina.
*Corresponding Author: R. Martin Torrez Irigoyen, National University of La Plata, 47 and 116 Streets (1900) - La Plata, Buenos Aires, Argentina.
Citation: Víctor A. Reale, Demarchi, S.M., R. Martin Torrez Irigoyen, (2024), Modeling of Freeze-drying Kinetics for Apple, Banana, and Strawberry, J. Nutrition and Food Processing, 7(13); DOI:10.31579/2637-8914/267
Copyright: © 2024, R. Martin Torrez Irigoyen. This is an open access article distributed under the Creative Commons Attribution License, which permits unrestricted use, distribution, and reproduction in any medium, provided the original work is properly cited.
Received: 27 September 2024 | Accepted: 14 October 2024 | Published: 30 October 2024
Keywords: freeze-drying; mathematical model; sublimation; desorption; fruits
Fresh apple, banana, and strawberry slices were frozen at -20°C and freeze-dried using a shelf temperature of 40°C. Theoretical expressions were developed to predict vapor transfer kinetics during both sublimation and desorption periods. For sublimation, a model that accounts for the increasing dried layer thickness was employed to predict the sublimation rate as a function of time. This model significantly improves upon the time equation found in literature without adding substantial complexity. For desorption period, an analytical solution of the unsteady-state diffusion equation was applied. Permeabilities were determined for the sublimation drying model at an absolute pressure of approximately 30 Pa. However, the relevant kinetic coefficient combines permeability and the mass of ice to sublime relative to the dry matter (sublimation kinetic coefficient). In the desorption drying model, diffusion coefficients of vapor in the dried layer were on the order of 1×10⁻⁹ m²/s for pressures around 3-5 Pa. In both periods, the agreement between predicted and experimental values was highly satisfactory. A minimum freeze-drying time of 12, 6.8, and 8.7 hours, respectively, was calculated for apple, banana, and strawberry, considering a final moisture content of 4% w/w. Normalized drying curves revealed a faster sublimation rate for banana, intermediate for strawberry, and slowest for apple. Conversely, desorption curves showed a faster desorption rate for apple, intermediate for banana, and slower for strawberry. In each period, the order of the relevant kinetic coefficients corresponded to the Arrangement of the experimental curves.
b Dried layer permeability to the vapor flux, [kg water (m Pa s)-1]
C2m Parameter defined in Equation (15), [m Pa kg water-1]
D Water vapor diffusion coefficient in the dried layer, [m2 s-1]
Fice Frozen water fraction in the sample, [kg ice kg initial water-1]
G Sublimation rate per unit area in the primary drying period [kg water m-2 s-1]
kg Mass transfer coefficient between sample top surface and condenser, [kg water (m2 Pa s)-1]
ks Sublimation kinetic coefficient, [s-1]
L Thickness of material, [m]
m Moisture content (average in sample) at time t, [kg water kg dry matter-1]
m0 Initial moisture content, [kg water kg dry matter-1]
me Final moisture content for the primary drying period, [kg water kg dry matter-1]
ml Local moisture content at time t, in the desorption period, [kg water kg dry matter-1]
meq Equilibrium moisture content, [kg water kg dry matter-1]
mdd Dimensionless mean moisture content
Piw Vapor pressure of ice in the sublimation front, [Pa]
Psw Vapor pressure at the surface of the dried layer, [Pa]
Paw Vapor pressure at the condenser surface, [Pa]
Pw Pressure at the solid-vapor interface, [Pa]
Tlp Shelf temperature, [K]
Ti Temperature of ice in the sublimation front, [K]
Ts Dried layer surface Temperature [K]
Taf Air temperature in the batch freezer [°C]
Tf Initial freezing temperature of product, [°C]
t Time, [s]
tsp Duration of the sublimation period [s]
tdp Duration of the desorption period [s]
tfd Duration of the total freeze-drying process [s]
xd Dried layer thickness, [m]
Y Fraction of residual ice content at time t defined in Equation (8), [dimensionless]
Greek symbols
ρd Dry matter density, [kg dry matter m-3]
ρf Frozen food density, [kg m-3]
Freeze-drying is a novel process that removes water from a previously frozen product through sublimation during the first period and desorption during the secondary stage [1]. Freeze-dried products are recognized for their superior quality among dehydrated foods, preserving bioactive compounds and maintaining structural integrity, thereby preventing shrinkage. Although more expensive due to longer drying times and higher energy consumption, freeze-drying is adequate for high-value products like pharmaceuticals and certain foods, such as strawberries, carrots, red pepper, mushrooms, apples, and bananas [2, 3, 4, 5]. Despite the increased investment and processing costs, the growing consumer demand for convenience and quality is conducting the production of more freeze-dried foods. However, further research, particularly in freeze-drying kinetics, is needed to develop accurate mathematical models that can enhance our understanding of the process, estimating process time and other design parameters [3]. While relatively simple models exist for estimating sublimation time and the variation in moisture content, most assume heat conduction from the bottom and vapor diffusion to the top [6, 7].
Some authors, as James and Datta (2002) [8] developed a drying model for carrot slices, focusing on the sublimation stage. Their model neglected surface-to-condenser mass transfer, concluding that the process was mass transfer-controlled. Further studies carried on in mushrooms and red pepper revealed faster drying for red pepper, likely due to differences in structure or composition [8]. Other drying models incorporate heat transfer from both, top and bottom surfaces, requiring different mathematical treatments. Authors as El-Maghlany et al. (2019) [9] proposed a more complex model for the sublimation stage, considering pore-based transfer mechanisms. However, this study was limited to the primary stage. For other hand, Sadikoglu and Liapis (1997) [10] developed models for both primary and secondary periods in bulk solution freeze-drying, considering conduction and radiation heat transfer and upward vapor water diffusion. While literature usually focuses on complex models, some intermediate-complexity models that enhance the sublimation time model developed by Karel and Lund (2003) [11] have received less attention. However, this model, limited to zero ice content, fails to capture the influence of the growing dried layer during the primary drying stage. In light of the literature, predicting water content as a function of time during this phase has been infrequently modeled. Furthermore, the secondary drying stage, involving desorption and diffusion through the dried layer, consumes a significant portion of the total drying time despite representing a small fraction of the initial water content.
2.1. Conditioning of raw materials
Slices of peeled apple (Red Delicious), banana (Musa Paradisiaca), and strawberry (Fragaria x Ananassa), were acquired from a local market. The fruits were cut in slices from 0.01 m in thick with a sharp knife. Samples were placed in 0.3 m diameter trays, in turn covered with food grade PVC film and introduced in a freezer at -20 °C for 24 h. The tray cover avoided some dehydration that might occur during freezing and while the sample was moved from the freezer to the freeze-dryer chamber.
2.2. Equipment description
A freeze dryer model L-A-B4-C was used (RIFICOR, Argentina, http://www.rificor.com.ar/). The equipment consists of a cylindrical vacuum chamber made of transparent acrylic covering a stainless-steel framework holding four disc-shaped shelves spaced 0.07 m. The shelves have built-in heating elements and a Pt-100 temperature sensor connected to a temperature automatic control up to 50 °C. Stainless steel trays 1 mm thick, 0.3 m diameter, with a lateral wall 0.02 m high, were placed with the samples. The equipment is fitted with a Pt-100 product temperature sensor, covered by a metallic case, and connected to a digital display. The chamber pressure was measured with a Pirani gauge, and the results continuously shown in a digital display. The equipment can be observed in Figures 1 and 2.
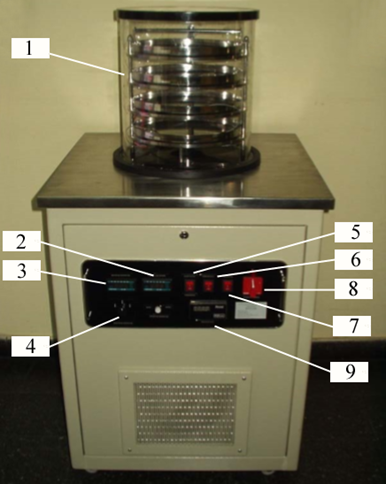
Figure Legend 1: Rificor Freeze Dryer model L-A-B4-C. 1. Vacuum chamber 2. Shelf temperature control; 3. Display showing either shelf, product, or condenser temperature; 4. Switch to select the temperature being displayed 5. Switch that starts condenser and its temperature measurement 6. Switch for starting vacuum pump and pressure gauge; 7. Switch to start heating to shelves 8. Main switch 9. Absolute pressure gauge.
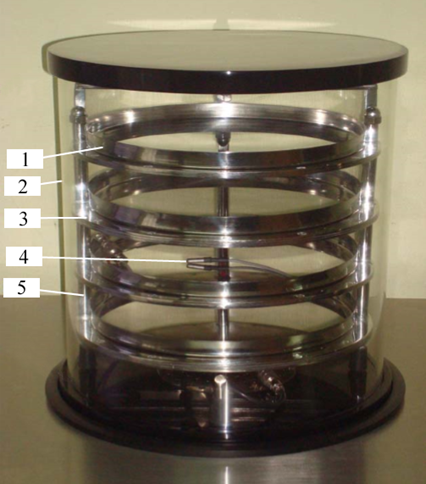
Figure Legend 2: Vacuum chamber of the Rificor L-A-B4-C Freeze dryer. 1. Tray; 2. Transparent vacuum chamber; 3. Temperature-controlled shelf. 4. Product temperature sensor; 5. Framework supporting the structure of the shelves under high vacuum.
2.3. Freeze-drying process
One tray with the frozen fruit was removed from the freezer, uncovered and placed in the freeze-dryer as the condenser temperature reached -48 °C. The cylindrical acrylic cover was put in place, and the vacuum pump was started. Chamber pressure was closely monitored and as soon as a value of 30 Pa was reached, shelf heating was switched on to set a target value of 40 °C. This last action was considered zero time for freeze-drying, i.e. To determine the experimental curve of moisture content as a function of time, triplicate experiments were carried on between 1.5 and 24 h. Moisture content for fresh and freeze-dried fruits were determined in an Arcano (China) vacuum oven connected to a Vacuubrand PC 500 Series – CVC 3000 (Germany) diaphragm vacuum pump for 6 h at 70 °C, following the AOAC 934.06 method [12].
3.1. Theoretical considerations
3.1.1 Sublimation model
The food slices (assumed a plane sheet) was subjected to heat transfer from both above and below. Conduction from the lower shelf and radiation from the upper shelf contributed to heating. This was observed during preliminary freeze-drying experiences, where a dried layer formed symmetrically above and below the frozen zone. Consequently, vapor was assumed to diffuse through both surfaces and the characteristic vapor migration became half the initial sample thickness. Therefore, symmetrical transfer of heat and mass was considered throughout the process. The scheme transfer phenomena is presented in Figure 3.
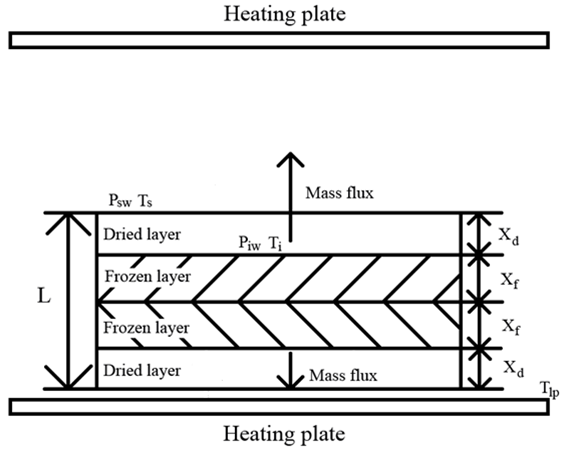
Figure Legend 3: Schematic of freeze-drying in the sample during the sublimation period.
The sublimation rate per unit area G, depends on the mass transfer as shown by Equation (1)

Where xd is the dried layer thickness; Piw, the vapor pressure in the sublimation front and Psw the vapor pressure at the surface of the dried layer. Symbol b is the dried layer permeability to water vapor. In addition, the vapor transfer between the top surface and the condenser can be represented by:

The symbol kg stands for the mass transfer coefficient between the dried layer top surface and the condenser, which depends on equipment design and operating variables. The symbol, Paw is the vapor pressure at the condenser temperature of -48 °C.
Ice temperature measured at the sublimation front were of -19, -18 and -22 °C for apple, banana, and strawberry, respectively. The vapor pressure of ice in the sublimation front were calculated by the following correlation [13]:
Pw=exp31.96-6270.36T+273.15-0.461 ln(T+273.15)

Using Equation (3), values of Piw resulted 113.9 for apple, 125.2 in banana and 85.3 Pa in strawberry, being Paw of 5.0 Pa. As Equation (1) and (2) are different expressions for the same vapor flux, both can be equated as follows

Although Piw and Paw keep constant in the primary drying period, Psw becomes a function of the dry layer thickness xd. By solving Equation (4) for Psw we achieve the expression:

This equation includes two parameters: b and kg. By replacing Equation (5) into Equation (2), and rearranging, the sublimation rate can be expressed in terms of the following flux equation:

Equation (6) predicts a time-varying vapor rate per unit area which is part of the transient macroscopic mass balance
| Rate of accumulation of vapor inside the sample | = | Transfer rate through the dried layer out of the sample and towards the condenser |
The accumulation rate per unit area can be expressed as follows

Where ρd is the density of the dry material, being t the instantaneous time. The negative sign must be written as dm/dt is inherently negative in dehydration. Where m stands for the moisture content, decimal dry basis at time t. The model would be more general by normalizing the ratio of frozen water remaining (m – me) relative to the initial frozen water (m0 – me) given by the expression

Most models involving a dependent dimensionless variable would tend asymptotically to a limiting value, though that behavior is not expected for Y in the sublimation period, as me is not an equilibrium moisture content, but the maximum unfrozen water content for a fruit freeze dried at the prevailing operating conditions. Therefore, experimental data should present a change in the drying mechanism (approximately for a time where m≈me) from ice sublimation to water desorption.
By assuming uniform internal moisture distribution (a reasonable approximation in a sublimation front), the ratio of frozen water removed by sublimation relative to the initial frozen water content available for sublimation is 1–Y, which can be considered equivalent to the ratio of the dried layer thickness to the initial half thickness of the sample. This is represented by the following expression

Being L the sample thickness. Now, by deriving Equation (8) with respect to time, a relationship is obtained between m and Y

Replacing Equation (10) into Equation (7) and rearranging, the accumulation term becomes

The dry matter density is calculated from the value of the frozen food by assuming constant sample volume of during the sublimation period, as shown in the equation below

Where ρf is the frozen food density. Now, by combining Equation (6) and (11)

Now, by solving for xd in Equation (9), replacing it in Equation (13), multiplying both sides of the equal sign by 2/L and rearranging, the following expression is reached:

To simplify the writing, some variables keeping constant during sublimation were grouped and termed C2m:

Multiplying both sides of Equation (15) by the dried layer permeability b

By integrating from Y=1 to a generic Y in the left member, and from 0 to t in the right member, we have

Multiplying both members by (-2) and grouping part of the results in a binomial, an intermediate expression is found

with the purpose of grouping variables again in a binomial, the term (2b / (kg L))2 is added at both sides of the equal sign to allow for the following equation

By solving for Y, the first version of the model for the sublimation period is achieved

To normalize experimental moisture contents (Equation (8)) for fitting Equation (20) to them, the moisture content at the end of the sublimation period (me) is calculated from the fraction of unfrozen water in the previous freezing stage at -20 °C. This criterion is considered well-founded and original, and me does not only determine the endpoint of sublimation but also the starting point for the secondary period. To estimate the frozen water fraction, a correlation by Fikiin (1998) [14], accurate for fruits, was employed:

Where Fice is the fraction of frozen water in the sample, being Taf the air temperature in the freezer and Tf the initial freezing temperature. Therefore, the fraction of unfrozen water 1 - Fice, can be used to calculate a delimiting moisture content between the primary and secondary drying periods

3.1.1.1 Fitting of the sublimation model
Parameters and properties utilized here are listed in Table 1 [15, 16].
| Apple | Banana | Strawberry | |
| ρf (kg m-3) | 787 | 863 | 882 |
| ρd (kg m-3) | 116.79 | 214.73 | 88.02 |
| m0 (kg water kg dry matter-1) | 5.738 | 3.019 | 9.021 |
| me (kg water kg dry matter-1) | 0.625 | 0.353 | 0.981 |
| Tf (°C)b | –1.45 | –3.88 | –1.39 |
| Tlp(°C) | 40 | 40 | 40 |
| L (m) | 0.01 | 0.01 | 0.01 |
| Taf (°C) | –20 | –20 | –20 |
| Tiw (°C) | –19 | –18 | –22 |
| Piw (Pa) | 113.9 | 125.3 | 85.3 |
| Paw (Pa) | 5.0 | 5.0 | 5.0 |
Table 1: Properties and operating conditions utilized for the sublimation drying model (Eq. (21)).
Experimental moisture contents and time were selected for the primary drying period, and moisture contents converted into the dimensionless variable Y as indicated by Equation (8), while Equation (20) was programmed in a user-defined MATLAB function. Equations and Figures were programmed and plotted in MATLAB 7.5.
Initial estimates for b and kg were provided for the built-in function nlinfit to which the experimental data of Y vs t were supplied. The program thus written was able to determine the optimizing parameters b and kg by nonlinear least squares, and the regression coefficient of determination, r2. Fitting parameters for each fruit in this sublimation period were presented in Table 2.
| Apple | Banana | Strawberry | |
Ice fraction during freezing (kg ice kg initial water-1) | 0.8911 | 0.8831 | 0.8912 |
| Duration of the sublimation period (h) | 8.5 ± 0.26 | 4.0 ± 0.44 | 5.4 ± 0.58 |
Permeability b (kg water (m Pa s)-1) | 2.242×10⁻⁹ ± 5.99×10⁻¹¹a | 4.197×10⁻⁹ ± 4.43×10⁻¹⁰ b | 5.644×10⁻⁹ ± 5.18×10⁻¹⁰c |
Convective mass transfer coefficient kg (kg water (m2 Pa s)-1) | 1.728×10⁻⁶ ± 8.31×10⁻⁷d | 72.087 ± 18.936e | 1.334×10⁻⁵ ± 6.17×10⁻⁶f |
Coefficient of determination r2 | 0.9799 | 0.9910 | 0.9532 |
a,b,c Average ± Standard Deviation (n=3) with different superscript letters on the same row are significantly different (α<0>
d,e,f Average ± Standard Deviation (n=3) with different superscript letters on the same row are significantly different (α<0>
Table 2: Preliminary parameter estimation for the sublimation model.
In Equation (20) two parameters of considerably different order of magnitude has been obtained, and, although Table 2 show that the expression provided accurate predictions, one must consider that the regression algorithm optimizes the parameters regardless of their physical meaning and in this sense, large variations were observed for kg which makes it unreliable and a low variation for parameter b. Hence, by neglecting the external resistance to mass transfer, Equation (20) becomes
 (23)
(23)
Provided Equation (23) can maintain accurate predictions, more meaningful values of the dried layer permeability for each fruit might be determined. Fitting results of Equation (23) are presented in Table 3. A small loss of accuracy can be noticed only in apple but not in banana nor strawberry.
| Apple | Banana | Strawberry | |
Ice fraction during freezing (kg ice kg initial water-1) | 0.891 | 0.883 | 0.891 |
Duration of the sublimation period (h) | 8.5 ± 0.26 | 3.9 ± 0.34 | 5.5 ± 0.58 |
Permeability b (kg water (m Pa s)-1) | 2.433×10⁻⁹ ± 6.02×10⁻¹¹a | 4.248×10⁻⁹ ± 3.61×10⁻¹⁰b | 5.538×10⁻⁹± 5.17×10⁻¹⁰c |
Sublimation kinetic coefficient ks (s-1) | 1.309×10⁻⁴ ± 4.12×10⁻⁶d | 2.846×10⁻⁴ ± 2.46×10⁻⁵e | 2.019×10⁻⁴ ± 2.19×10⁻⁵f |
Coefficient of determination r2 | 0.9464 | 0.991 | 0.9502 |
a,b,c Average ± Standard Deviation (n=3) with different superscript letters on the same row are significantly different (α<0>
d,e,f Average ± Standard Deviation (n=3) with different superscript letters on the same row are significantly different (α<0>
Table 3: Results for the primary drying period.
Now that the model has been simplified C2m can be expressed in its form of Equation (15) not to conceal the factors affecting the curve
 (24)
(24)
While the dried layer permeabilities, a kinetic parameter, are ordered from highest to lowest as strawberry > banana > apple, the plots of dimensionless Y vs dimensional t show the following order in drying rate: banana (fastest) > strawberry > apple (lowest). This behavior is probably due to the curve is not explained solely by b, there are two consecutive steps: (1) sublimation of ice and (2) migration through the pores. Permeabilities explain migration but not sublimation, which can be described particularly by m0-me, i.e, the mass of ice sublimed relative to the dry matter. Thus, a parameter called sublimation kinetic coefficient ks is defined:

Which leads to the final form of the model for the sublimation period:
 (26)
(26)
Table 3 shows the values calculated for ks. In this case, the ordering of this kinetic coefficient is coincident with the order of sublimation rates of curves presented in Figure 4. Banana is less porous than strawberry though its mass of ice to sublime per kg of dry matter is also lower.
The values of b determined here for apple, banana, and strawberry are comparable to the 3.5×10⁻⁸ kg water (m Pa s)-1 found by Quast and Karel (1968) [17] in freeze-dried coffee. Values were also in the order of the 1.5×10⁻⁸ kg water (m Pa s)-1 published by Sandall, King and Wilke (1968) [18] for turkey breast and to 1.8×10⁻⁸ kg water (m Pa s)-1 determined by Hill (1967) [19] for beef.
Experimental data of Y vs t and predictions of the model in any of its equivalent forms (Equation (23), (24) or (26)), with the fitting parameter b for the sublimation period are plotted in Figure 4.
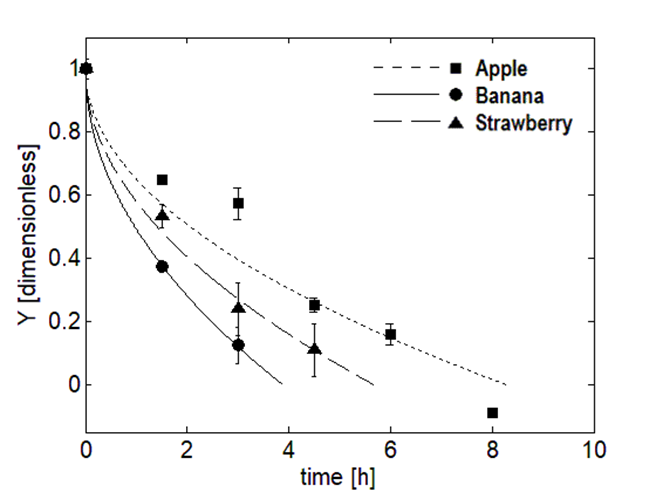
Figure Legend 4: Experimental and predicted (Eq. 26) normalized moisture content ((m-me)/(m0-me)) as a function of time during primary drying of apples, bananas, and strawberries. Error bars represent standard deviations of the data.
In Figure 4, the calculated values closely match the experimental data, demonstrating substantial accuracy for this difficult experimental system. The sublimation rate gradually decreases (in absolute value) due to the growing dried layer thickness during sublimation. This behavior was not clearly explained in the literature, which often compares the sublimation period with the convective drying of high-moisture foods, despite the latter provides a linear behavior [3].
3.1.2 Desorption model
The remaining unfrozen moisture is bound to the food matrix and has a lower vapor pressure than pure liquid at the same temperature. This “bound moisture” concept is often used but can be ambiguous. In this study, we prefer the term “adsorbed water”. For secondary drying, adsorbed water must be desorbed and diffuse as vapor through the dried layer, exiting the sample towards the condenser. To model this process, an unsteady-state mass balance was proposed, based on Fick's law of diffusion [20]:

Where ml stands for the local moisture content in the dried layer, now occupying the entire thickness of the sample, being D the effective vapor diffusion coefficient. The initial and boundary conditions were:


The time t is counted now from the start of the desorption period. The value of meq is the equilibrium moisture content at the operating conditions prevailing in the experiments, [kg water kg dry matter-1]. In the desorption period, and, because of the high vacuum conditions, this equilibrium value was assumed zero.
Considering no shrinkage and constant volume (constant diffusion coefficient), Equation (27) together with the initial and boundary conditions Equation (28) to (30), can be integrated over the half volume of the sample. These assumptions are substantially met during desorption in a freeze-drying process. The analytical series solution is:


Where mdd is the dimensionless mean moisture content. As mentioned above, the starting moisture content in the desorption period (me) coincides with the final moisture in the sublimation stage.
This combined equation was solved for the average moisture content, m, to fit the experimental data of the desorption period using a method previously described for the sublimation period, but now optimize parameter D. The moisture content-time data from the desorption period were not used in fitting the sublimation model. The moisture content corresponding to the unfrozen water fraction, me, was considered a pseudo-experimental point. For m=me, zero time was assumed for the start of secondary drying. The duration of the primary period was previously calculated by the sublimation model as the time required for moisture content to decrease from m0 to me. Therefore, the times used during the secondary period in the fitting were the cumulative time minus the sublimation time. This is possible because the secondary drying period is assumed to begin with no moisture content gradients throughout the thickness.
Equation (31) and (32) are written in a user-defined function file. The program module allows a variable number of terms to be employed, and the sum in Equation (31) is terminated for each time as the last term falls below 1.0×10⁻⁵. With this adaptive programming, a lower number of terms are used towards the end of each fitting exercise. The optimized value of D and the goodness of fit parameters are presented in Table 4.
| Apple | Banana | Strawberry | |
Diffusion coefficient (m2 s-1) | 1.628×10⁻⁹ ± 2.554×10⁻¹¹a | 1.977×10⁻⁹ ± 1.055×10⁻⁹a | 2.285×10⁻⁹ ± 2.213×10⁻⁹a |
Coefficient of determination r2 | 0.9999 | 0.9790 | 0.9762 |
Duration of the desorption stage (h) | 4.3 ± 0.10 | 3.2 ± 1.35 | 3.3 ± 1.92 |
Duration of the freeze drying process (h) | 12.8 ± 0.36 | 7.1 ± 1.11 | 8.9 ± 1.34 |
a Average ± Standard Deviation (n=3) with different superscript letters on the same row are not significantly different (α<0>
Table 4: Results of the desorption model fitting to the experimental data.
The coefficients of determination demonstrate that the predictions for the secondary period were generally satisfactory, being highly accurate in apple, accurate in banana and still very good in strawberry. All calculations required only a few seconds of computing time, indicating the model's potential usefulness in control algorithms. According to the glass transition theory, a critical moisture content must be defined to approach the glassy state of a dry solid, ensuring long-term food stability. For this reason, a final moisture content of 4% w/w or 0.0416 kg water per kg dry matter was used. This value was utilized to calculate the secondary freeze-drying time. Several studies on glass transition phenomena in freeze-dried fruits have suggested a similar final moisture content as suitable for preserving freeze-dried fruits at ambient temperature [21, 22, 23]. The total freeze-drying time is shown in Equation (33)

where tdp is the duration of desorption period, tfd, the length of the total freeze-drying process, while tsp stands for the duration of the sublimation period, all times being in [s].
Predictions of the model were in fair agreement with experimental mdd as a function of time as observed in Figure 5 for the three fruits. Times were converted to h in the graph for easier visualization.
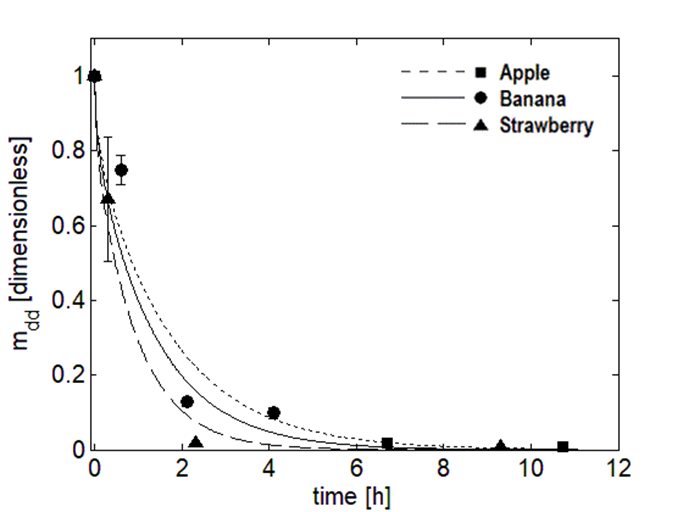
Figure Legend 5: Dimensionless moisture content as a function of desorption time: apple (slowest drying curve), banana (medium drying curve), and strawberry (fastest drying curve). Values predicted by Equations 31 and 32 are compared to experimental data, with standard deviations plotted as error bars.
As shown in Figure 4, the curve order aligns with the order of the sublimation kinetic coefficient, ks. This is because, as previously discussed, ks depends not only on permeability, b, but also on the relative amount of ice being sublimed compared to the dry matter. In contrast, in Figure 5, the curve order follows the same mode as the vapor diffusion coefficients because, during the latter period, the only significant mass transfer parameter is D, which relates to the structure and its porosity. As moisture content at the end of the process is considerably low and more susceptible to errors compared to values obtained during the sublimation period triplicate experiments are especially valuable in the desorption period, particularly towards its end.
The diffusion coefficient determined here for apples was slightly higher than that reported by Saravacos (1967) [24] for the same freeze-dried fruit, 0.7×10⁻⁹ m2 s-1. This difference can be attributed to the higher shelf temperature of 40 °C used in this study compared to the 30 °C used by this authors. In contrast, the diffusivity for banana slices air-dried at 38 °C, 2.1×10⁻¹⁰ m2 s-1, was much lower than in this work. Atmospheric pressure generally tends to increase the diffusion coefficient, but the collapsed structure of an air-dried fruit significantly reduces this parameter [25]. No diffusion coefficients during freeze-drying studies were found for strawberry. Interestingly, when comparing Tables 3 and 4, readers will notice that the order of permeabilities during the sublimation period coincides with the order of diffusion coefficients during the desorption stage (apple < banana>b and D, which are related to the movement of water vapor through the porous structure of the dried layer.
Table 3 and 4 present the most representative parameters for the primary and secondary drying periods: permeability and the diffusion coefficient, respectively. A statistical analysis of variance (ANOVA) was conducted (α=0.05) to determine if the differences between the obtained parameters were significant. Regarding the permeability, the results indicated significant differences among the values for each fruit. This can be attributed to differences in their structure, chemical composition, and initial moisture content. These factors influence the dried layer thickness and the amount of ice per kg of dry matter, directly affecting the value of b for each fruit. On the other hand, no significant differences were found between the diffusion coefficients. This may be associated with the complete sublimation of ice during this period, allowing the remaining water to move through the pores of the dry matter. At such low moisture contents, it is reasonable to assume that the diffusion coefficient would not exhibit significant variations. Similar conclusions were mentioned by Chen et al. (2023) [26] who modeled the mass and energy transfer during kiwi freeze-drying.
Predictions of both models adapted for the moisture content dry basis normalized by the initial moisture content as a function of time, together with the experimental data for the two periods (Equations (8), (26), (31) and (32)) are plotted in Figure 6.
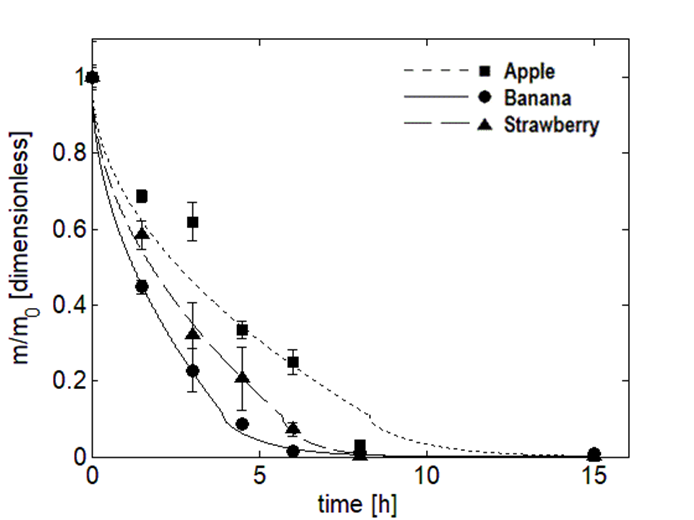
Figure Legend 6: Normalized moisture content as a function of time during the complete freeze-drying process: primary and secondary drying models. Apples, bananas, and strawberries. Values were predicted using Eqs. 26, 31, and 32. Standard deviations for experimental values are represented by error bars.
Figure 6 demonstrates that the predictions closely follow the experimental behavior. The transition between the predictions of the primary and secondary period models is marked by a change of slope. Although continuity of moisture content was ensured between the models, the derivatives were not continuous due to the different drying mechanisms in the two periods. Finally, Figure 7 presents some images of each fruit before and after the freeze-drying process. As shown, there is minimal difference between the initial and final appearance of the fruits, highlighting one of the most appealing aspects of this drying method [27].
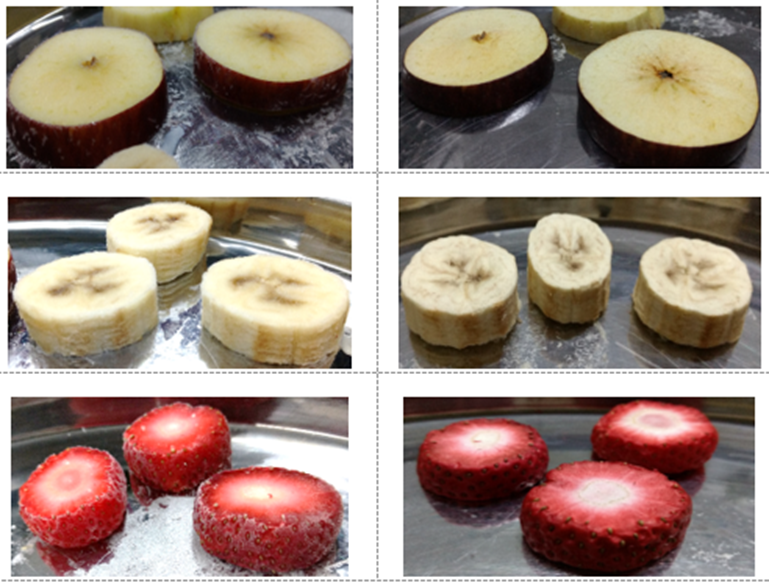
Figure Legend 7: Frozen and freeze-dried images of apple, banana, and strawberry: Left column for frozen fruits, right column for freeze-dried products.
A robust model was developed for sublimation drying of fruits, accounting for the increasing dried layer to predict remaining ice content. The symmetrical mass transfer model, fitted to experimental data for apple, banana, and strawberry, accurately represented observed behavior. Dried layer permeabilities (b) ranged from 2.3 to 5.4 ×10⁻⁹ kg water (m Pa s)-1. However, the relevant kinetic parameter was a combination of permeability and the relative mass of sublimed ice, whose order was congruent with experimental sublimation rates. The model innovatively used the unfrozen water fraction as the primary-secondary period limit. A falling sublimation rate, predicted for all three fruits, was attributed to the increasing dried layer thickness.
Secondary drying was modeled using the analytical solution of the diffusion equation. Accurate predictions for this low moisture content period yielded effective diffusion coefficients in high vacuum of 1.6 to 2.9 ×10⁻⁹ m2 s-1. These values are significantly higher than those reported for convective drying at atmospheric pressure, which suggest the creation of a porous structure. The order of D for the three fruits corresponded to their desorption rates and aligned with the order of permeabilities during the sublimation period, as both parameters relate to vapor migration through the porous structure.
Overall, this two-model approach for simulating fruit freeze-drying is accurate, well-founded, and computationally efficient, making it suitable for interactive freeze-dryer design and even as an automatic control algorithm.
We would like to express our sincere gratitude to the National Council of Scientific and Technical Research (CONICET) and the National University of La Plata for their generous financial support for this research project. Their contribution has been fundamental in carrying out this research and achieving the proposed objectives.
The authors declare that they have no conflict of interest, scientific or economic, related to this research.
Dear Editorial Team, Clinical Medical Reviews and Reports. My experience with the journal was highly positive. The peer-review process was rigorous, constructive, and completed in a timely manner. The reviewers provided valuable comments that helped improve the quality and clarity of our manuscript. The editorial office was professional, responsive, and supportive throughout all stages of the publication process. Communication was clear and efficient, and any questions were addressed promptly. Overall, I found the journal to maintain high scientific standards and an excellent publication workflow. I would be pleased to consider submitting future work to this journal. Best wishes from, Elena Popa.

It was my pleasure to submit my testimonial concerning the Reviewer Board of our Scientific Journal “Brain and Neurological Disorders”. The Reviewers focused on some modifications and their contribution was helpful. The ladies of our Editorial Office were also supported my efforts. It was my honor to have such a co-operation and I am looking forward for more collaboration.

Dear Grace Pierce, Editorial Coordinator of Journal of Clinical Research and Reports, Thank you for the speedy and efficient peer review process. I appreciate the fact that your peer reviewers do not take months to respond like with some other journals. I would also like to thank the editorial office for responding quickly to my questions. It is an excellent journal. I plan to submit more manuscripts in the future. Best wishes from, Robert W. McGee

Dear Grace Pierce, Editorial Coordinator of Journal of Clinical Research and Reports, Working with you and your team on our recent publication in JCRR has been a truly wonderful and enjoyable experience. The responses were prompt, and the reviewers were patient, constructive, and highly professional. One reviewer in particular gave me the feeling that a professor was carefully reading and commenting on my coursework, which was deeply touching. The entire process was straightforward and hassle‑free, with no tedious online forms to complete. I highly recommend this journal. Best wishes from, DR Aibing Rao, Head of R&D

I Appreciate the Opportunity to Share my Experience with the Journal of Clinical Research and Reports. The peer review process was timely and constructive, and the feedback provided helped improve the quality of our manuscript. The editorial office was professional, responsive, and supportive throughout the process, ensuring smooth communication and efficient handling of the submission. Overall, it was a positive experience collaborating with your team.

Dear Mercy Grace, Editorial Coordinator of Obstetrics Gynecology and Reproductive Sciences, We would like to express our gratitude for your help at all stages of publishing and editing the article. The editors of the magazine answer all the necessary questions and help at every stage. We will definitely continue to cooperate and publish other works in the Obstetrics Gynecology and Reproductive Sciences! Best wishes from, Alla Konstantinovna Politova,
