
Research Article | DOI: https://doi.org/10.31579/2637-8914/158
Department of Nutrition and Dietetics, College of Health Sciences, Bowen University, Iwo
*Corresponding Author: Ofoedum Arinze Francis, Department of Biology, Faculty of Education, University of Khartoum.
Citation: Ofoedum, A.F., Owuamanam, C.I., Iwouno, J.O., Ofoedu, C.E., Olawuni, I.A. et.al (2023). Extraction and Evaluation of Bioactive Compounds (Anti-Stress Components) from Selected Tropical Spices using Microwave Assisted Technique, J. Nutrition and Food Processing, 6(8); DOI:10.31579/2637-8914/158
Copyright: © 2023, Lina Ahmed Hassaballa. This is an open access article distributed under the Creative Commons Attribution License, which permits unrestricted use, distribution, and reproduction in any medium, provided the original work is properly cited.
Received: 16 June 2023 | Accepted: 06 October 2023 | Published: 17 October 2023
Keywords: antioxidants; ginger; microwave assisted extraction,monodora myristica; tetrapluera tetraptera tropical spices and quantitative phytochemicals
Crude extracts (essential oils) were extracted using a microwave assisted extraction from dried Ginger, T. tetraptera, and M. myristica and subsequently evaluated. Quantitative phytochemicals and antioxidant activities were determined in the crude extracts. The saponins were found to be highest in ginger extracts (2.71) and differs significantly (p≤0.05) from other samples. Flavonoids, terpenoids, and tannins are highest in Monodora myristica with mean values of 14.33, 7.30 and 5.46 respectively but had the least in alkaloids (6.84). T. tetraptera had the highest in alkaloids and steroids with mean scores of 10.17 and 4.31 respectively and with significant differences (p≤0.05). Total phenolic compounds are highest in M. myristica (26.06) followed by ginger (23.26) and T. tetraptera (20.93). The crude extracts recorded high antioxidant activities (DPPH, FRAP, LIPID Peroxidation inhibition, and Nitric oxide scavenging activities), in relation to the control (Vit. C). The crude extract from M. myristica gave the highest DPPH value (56.61) while ginger extracts recorded the highest score for FRAP while the control (Vit. C.) had the highest lipid Peroxidation inhibition Therefore, tropical spices can be used to produce antistress nutraceutical beverages.
Stress is a feeling of emotional or physical tension or intrinsic/extrinsic stimulus that evokes biological response. It can come from any event or thought that makes you feel frustrated, angry, or nervous. Stress is your body's reaction to a challenge or demand. In short bursts, stress can be positive, such as when it helps you avoid danger or meet a deadline. The compensatory responses to these stresses are known as stress responses. (Habib, et al., 2017). In response to the above stress associated problems, people resort to the use of pills, drugs, synthetic drinks (often called energy drinks), herbal preparation which some of their clinical integrities are questionable. Nevertheless, most people do not prefer the use of synthetic drugs owing to some of their associated side effects, but rather prefer natural substance from roots, herbs and some tropical crops (spices) such as teas, coffee, ginger, turmeric, thyme, ginger, as well as some fruits and cereals (Martin, 2016).
However, antistress drinks originate primarily from fruits and vegetables sources, but also include those from other plants such as ginger, tea, coffee, cocoa, soybean as well as animal products like milk and dairy-based and alcoholic drinks (Rampersaud, et al., 2003). The health benefits of such beverages are rendered via different mechanistic pathways, and are used to ward off stress related ailments as earlier stated.
Thus, formulation of high quality beverages containing extracts from natural sources (spices) such as ginger, Tetrapleura, Monodora myristica, which contain antistress components for promotion of health and disease prevention have not received critical attention. The phytochemicals present in plant foods, including fruits and vegetables, have been shown to be responsible for health benefits of such foods, and the mode of action of phytochemicals present as well as their chemical composition is varied. However, compounds with antioxidant potentials such as terpenes, Isoflavones, phenolics and polyphenolics appear to be important; (Bryer, 2005). These developments have intensified attention to extraction of the bioactive compounds from most of the tropical spices.
The bioactive compounds are however, one of the major constituents of nutraceutical beverages. In addition, development of biomarkers, study of synergistic and antagonistic effects of nutraceutical-drug interactions deserve particular attention. More so, some bioactive compounds which have been confirmed to contain varying degrees of phytochemicals, antioxidants, stimulants and antistress components may also be incorporated in soft drinks to perform some specific health roles.
Some studies have shown that about 80% health related problems and cardiac arrest are often associated with stress (Bone, et al., 1999). Sequel to that, there are various natural components basically of plant origins that can be used to arrest stress in humans aside being drug based. Several foods and beverages that contain components of plant origin such as wines, fruit juices, etc; contain various essential nutrients ranging from carbohydrates, amino acids, vitamins, minerals, lipids, essential oils etc., which play vital health roles in the body (Borrelli, 2005). Also, tropical spices such as ginger, thyme, curry, onion, garlic, etc; are said to contain various levels of phytochemicals (bioactive compounds) such as carotenes, flavonoids, phenols, polyphenols, terpenes, mycerene, limonene, pinene, steroids, triterpenes, and many other antioxidants and essential oils numerous to mention. These tropical spices are sometimes used in herbal preparations, but mostly in food preparations due to their health and therapeutic potentials (Borrelli, 2005). However, little or no studies have been conduction on most of these tropical spices in the areas of their use in pharmaceutical and other health formulations; hence the current study on extraction and evaluation of phytochemical potentials.
Stress has become a silent killer of individuals all over the world. Stress induced health conditions such ulcers, diabetes, cancers etc., are on the increase globally. The fight against stress has assumed a wider dimensions ranging from creation of leisure activities, drugs and production of food and drinks that can help individuals to overcome stress. Tropical spices are rich in essential oils with components such as antioxidants, phenols, carotenes, terpenes, terpenoids, among others which are potent against physical and mental stress. However these spices, which have enormous health and therapeutic benefits are not fully tapped/efficiently utilized for the production of nutraceutical beverages so as to solve the health needs of the populace (Nwokenkwo, et al, 2020 and Olawuni, 2019).
The main objective of this research work is the extraction and evaluation of bioactive compounds from tropical spices using microwave assisted techniques.
Understanding the types of bioactive compounds present in some tropical spices and will inaugurate a new frontier in effective utilization of these tropical spices. This research work will explore some of the extraction of selected tropical spices. It is expected that the findings of this study will help in advancing the industry, aid future researches and be of benefit to the farmers, as well as promote industry and commerce.
Therefore, the scope of the work covers the sourcing, extraction and identification of the bioactive substances (photochemical) in tropical spices such as ginger (Zingiber officinale, Oshiokirisho (Tetrapluera tetraptera), Ehuru (Monodora myristica).
2.1. Sources of Materials:
2.1.1. Raw Material Collection
Mature and freshly harvested ginger (Zingiber officinale) and dried Ehuru (Monodora myristica) seeds were purchased directly from the farmers in Owerri, Imo State.
Mature dry Oshiokirisho (Tetrapluera tetraptera) fruits were obtained from Federal University of Technology, Owerri which was among the trees planted as wind-breaks and ornamental plants within the university.
The ginger (Z. officinale), Oshiokirisho (T. tetraptera) fruits, and Ehuru (M. myristica) were identified by a crop scientist at the department of Crop Science FUTO and then taken to department of Food Science and Technology laboratory, Federal University of Technology, Owerri where the sample preparations were carried out. The samples of the plant materials are shown in plates 2.1 and 2.2.

Plate 2.1. Freshly harvested Ginger and Tetrapleura tetraptera.

Plate 2.2. Left: (Roasted seeds of Monodora myristica); Right: (Deshelled roasted seeds of Monodora myristica).
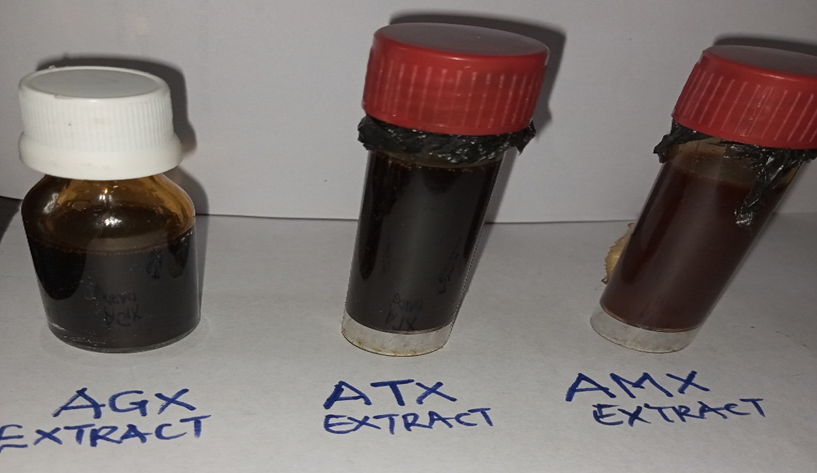
Plate 4.1. The crude extracts from Ginger (Zingiber officinale), Tetrapluera tetraptera and Monodora myristica.
2.1.2. Reagents, Laboratory Wares and Equipment
The various chemical reagents and laboratory wares/equipment used were of analytical grades. They were obtained from the department of Food Science and Technology, and department of Biochemistry, and department of Chemistry in Federal University of Technology, Owerri, Nigeria.
2.2 Methods: Sample Preparations and Phytochemical Screening for the bioactive compounds
2.2.1. Processing and Extraction of Ginger (Z. officinale) Extracts
The processing and extraction of crude ginger (Z. officinale) extract were done according to the method of A.O.A.C (2019). About 10 kg of freshly harvested ginger rhizomes were processed for the extraction. The ginger was cleaned and washed with a solution of alcohol to decontaminate the surfaces from microbial loads. The washed ginger rhizomes were peeled so as to remove the barks.
The peeled ginger rhizomes were sliced in to smaller sizes and were dried under the sun for about seven (7) days prior to milling into powdered forms and stored in air tight containers for subsequent processing. Afterwards, it was followed by extraction using microwave assisted extraction so as to generate the bioactive components and essential oils (crude extracts) required for the beverage formulation. The flow chart is represented in the figure 2.1.
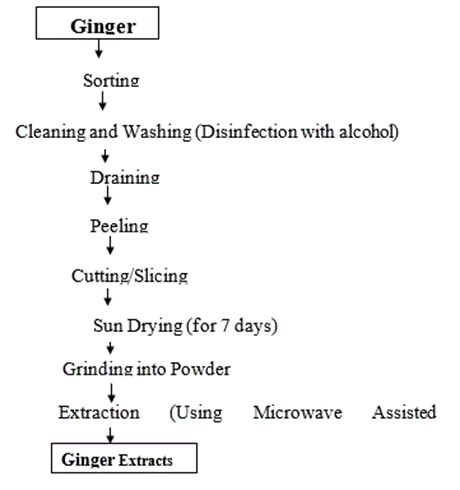
Figure 2.1. Processing/Extraction of Ginger Essential oils.
2.2.2. Processing and Extraction of Bioactive Compounds from Ehuru (Monodora myristica).
The method described by Onwuka, (2005) was adopted with slight modification. A 2 kg of matured and dried Ehuru (Monodora myristica) seeds were sorted and gently roasted to enhance ease of dehulling. The dehulled seeds were further dried using drying oven (at 105oC) to ensure that the moisture contents were drastically reduced. The dried seed was grinded, stored in air tight containers and subsequently prepared for extraction of the bioactive components/essential oils (crude extracts). The flow chart for the process is shown in figure 2.2.
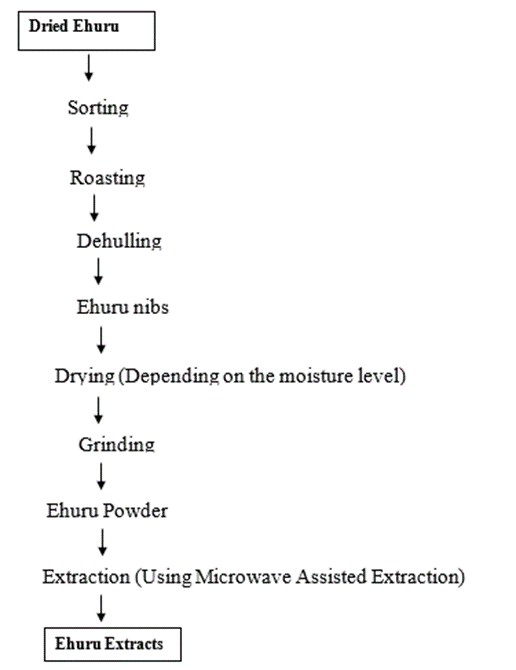
Figure 2.2. Processing/Extraction of Ehuru (Monodoramyristica) essential oils.
2.2.3. Processing and Extraction of Crude extracts from Oshiokirisho (Tetrapluera tetraptera) Fruits
The method described by Onwuka, (2005) and Odimegwu, et al, (2019) was used for the extraction of ehuru extracts. About 10 pieces of matured and dried fruits of Oshiokirisho (Tetrapluera tetraptera) was used for this process. However, the fruits were cleaned and washed with alcohol solution to disinfect the surface microorganisms. The washed fruits were dried in an electric oven (EUROSONIC; Model No. ES-9080, China) at the temperature of 60oC. The dried pods were cut into pieces for easy grinding into powders. The ground samples was stored in an air tight contained and subsequently subjected to extraction using microwave assisted extraction to generate the bioactive component in the T. tetraptera fruits. The flow chart for the process is given in figure 2.3.

figure 2.3. Processing and Extraction of Crude extracts from Oshiokirisho (Tetrapluera tetraptera) Fruits
2.3. Microwave assisted extraction of the Crude Extracts
The method described by Chan, et al, (2022) and Chemist Rn (2022) was used for the extraction of the bioactive compounds. A 200g of the milled dried sample of the plant materials in each case was transferred into a flat bottomed flask of 500 ml capacity and 250ml of appropriate organic solvent (ethyl ether) was transferred into the flask containing the sample to be extracted. The flask was placed inside the microwave, stoppered and fitted to a condenser (a cooling system designed with water inlet and outlet). The microwave is plugged to a power source and was switched on, taking into cognizance, the predetermined temperature of the solvent, extraction time (10-20 minutes) and power (300W) which are the basic operating conditions for the MAE. The microwave generated from the magnetron is directed by the waveguide onto the sample/solvent system, thus causing the solvent to boil and rise up within the vessel. However, the hot solvent was made to come into contact with a water-cooled reflux condenser. This made the solvent to condense and return to the holding vessel. This process was repeated for a short period of time which enables the organic compounds to be desorbed from the sample matrix into the organic solvent. As the boiling process continued for about 30 minutes, the crude extracts (essential oil) evaporates and is collected through a separate vessel fitted for the purpose. This procedure was repeated for all the different dried (powdered) samples of the plant materials (Zingiber officinale, M. Myristica and T. tetrapluera). The extract yield was determined and recorded in each of the cases. The microwave extraction set up is shown in figure 2.4.

Figure 2.4. A Microwave assisted extraction set up (containing microwave, retort stands, condensers, and flat bottomed flask holding the samples under extraction).
2.4. Extract Yield, Phytochemical Screening/Evaluation of the bioactive compounds in the crude Extracts.
2.4.1 Determination of extraction yield:
The method described by A.O.A.C. (2019) and Odimegwu, et al, (2019) was used for this determination. The yield of evaporated dried extracts based on dry weight basis was calculated using the equation shown below:
 (3.1b)
Where W1 = weight of extract after evaporation of solvent.
W2 = dry weight of the sample
2.4.2. Evaluation of the Bioactive Compounds and Phytochemicals in the crude Extracts.
Phytochemical tests were done to determine the presence or absence of certain chemical substances including the target bioactive components present in the crude plant extracts. The tests were carried out using standard procedures to identify the preliminary phytochemical screening following the methodology of Savithramma et al. (2011) and Olawuni, et al, (2019) by GC-MS techniques.
2.5. Statistical Analysis
The experimental design was that of randomized complete block design. All determinations were in triplicate. The data generated were analyzed using IBM SPSS software version 20.0 (SPSS Inc.) and Matlab 2015 and Ms Excel, version 2013 was also used. The mean comparison was carried out using a one way ANOVA while the separation of the sample means was done using the Fisher’sleast significant difference (LSD) at P<0>
3.1. Results Tables
3.1.1 Percentage extract Yield

Table 3.1. The Results of the Percentage Extract Yields of the Samples
Keys: AGX = Ginger extracts
ATX = T. tetrapluera extracts
AMX = M. myristica extracts
The result of yield of extracts is presented in Table 3.1. The M. myristica gave the highest extract yield (15.07%) while Ginger (Zingiber officinale) had the least extract yield of 10.5%.
3.1.2. Phytochemical Analysis/Qualitative Tests

Table 3.2 Phytochemical Screening of the Relative abundance of the Different Bioactive Compounds Present in the Crude Extracts.
ATX = T. tetrapluera extracts
AMX = M. myristica extracts
+ = Moderately Present (High)
++ = Very much present (Relatively higher)
+++ = Heavily Present.
The result of the relative abundance of the phytochemicals in the crude extracts is stipulated in table 3.2. Phenolic compounds were found to be heavily present in all the crude extracts (Zingiber officinale, T. tetraptera, and M. myristica), while Flavonoids were relatively high in all at same degree. Saponins, Steroids and cardiac glycosides are also present in all in the same degree while only gingerols were found to be heavily abundant in ginger extracts.

Table 3.3: The Results of the Quantitative Phytochemicals in the Crude Extract
The means ‘abc…’ with different superscript within the same column are significantly different (p≤0.05)
Keys: AGX = Ginger extracts
ATX = T. tetrapluera extracts
AMX = M. myristica extracts
The result of the quantitative phytochemisry is shown in Table 3.3. Phenolics was highest in M. myristica extracts (26.06) and least in ginger extracts (23.6). Saponin is highest in ginger and lowest in M. myristica but highest in flavonoids, Tepenoids and tannins with values of 14.33, 7.30 and 5.46 respectively. Ginger gave the least cardiac glycoside (2.37), while M. myristica had the highest value (3.56).
3.1.3. Antioxidant Assays

Table 4.4: Mean Scores of DPPH Radical Inhibitory Activities of the Crude Extracts at Different Concentrations
The means ‘abc…’ with different superscript within the same column are significantly different (p≤0.05)
The result of the DPPH radical inhibitory activities of the crude extracts at different concentrations is described in Table 3.4. The M. myristica extracts recorded the highest mean scores for all the concentrations while the control (Vit. C) had the least value. The trend followed same pattern as the concentration increases.

Table 3.5: Mean scores of the FRAP Activities of the Crude Extracts at Different Concentrations
The means ‘abc…’ with different superscript within the same column are significantly different (p≤0.05)
Keys: Control = Normal Vitamin C
AGX = Ginger extracts
ATX = T. tetrapluera extracts
AMX = M. myristica extracts
The Table 3.5 displays the mean values for the Ferric reducing antioxidant potentials of the crude extracts at different concentration. Sample AGX (Ginger extracts) gave the highest mean scores at all concentrations while the control recorded the least values for FRAP activities. That is to say, the means ranged from 18.20 to 40.48 at 50(µg/ml) and 62.69 to 89.93 at 50(µg/ml).

Table 3.6: Lipid Peroxidation Inhibition Activities of the Extracts at Different Concentrations.
The means ‘abc…’ with different superscripts within the same column are significantly different (p≤0.05)
Keys: Control = Normal Vitamin C
AGX = Ginger extracts
ATX = T. tetrapluera extracts
AMX = M. myristica extracts
The lipid peroxidation inhibition activity at different concentration is presented in Table 3.6. The control recorded higher mean values than all other samples which ranged from 2.86 to 6.34 for 50(µg/ml) to 400 (µg/ml). Sample ATX (M. myristica) recorded the least mean scores ranging from 1.73 to 2.91 for the same concentrations.
4.1.1. Extract Yield.
The result of the percentage extract yields for the different tropical spices were stated in Table 4.1 and figure 3.1 (a) respectively. From the values obtained, it revealed that sample AMX (M. myristica) gave the highest yield of 15.07% followed by sample ATX (T. tetraptera) with 12.80% yield, and lastly, sample AGX (ginger) which yielded 10.35%. However, from the related work done by Yang, et al., (2003) and Caiqin, (2010), it was observed that ginger yields relatively smaller amounts essential oils (extracts) when compared to other tropical spices such as Monodora myristica and Tetrapluera tetraptera. Thus, the low extract yield found in ginger when compared to other samples (M. Myristica and T. Tetraptera) could be as a result of the intrinsic factors and/or the nature and chemical composition of the plant materials. Alara and Abdurahman reported 10.30% yield of ginger extracts using microwave assisted extraction (MAE) and this vale is however, related to the score obtained in this research.
4.1.2. Phytochemical Screening and Relative Abundance Bioactive Compounds Present in the Crude Extracts
Table 3.2 show the different phytochemicals present in the crude extracts (essential oils) generated from the different plant materials and their relative abundance. The bioactives and Phytochemicals of importance determined include: saponins, flavonoids, terpenoids, gingerols, alkaloids, phenolics, steroids, tannins, and cardiac glycosides. From the laboratory assay, it was observed that saponins are moderately present in all the samples (AGX, ATX and AMX respectively). Flavonoids are found to be very much present in all the three respective samples whereas Terpenoids were moderately present in both samples AGX and ATX, but relatively higher in sample AMX. Gingerols were found to be heavily present in sample AGX but relatively high in samples ATX and AMX respectively. Prasad and Tyagi, (2015) also reported that ginger contains high amounts of terpenes and 6-gingerols and other essential oils.
However, alkaloids where found to be moderately present in samples AGX and AMX, but relatively higher in sample ATX (T. tetraptera). Phenolics were found to be heavily present in all the samples while steroids were moderately present in all the sample. Tannins and cardiac glycosides were also moderately present in all the samples of the plant materials. A study done by (Riu, 2015), suggested that tropical spices such as ginger, turmeric, Monodora myristica, Tetrapluera tetraptera, curry, garlics, etc; contain several numbers of phytochemicals and antioxidants, which are also in line with those obtained from this research work. Therefore, the predominance of the phenolic compounds in the crude extracts could be attributed to the presence of secondary and tertiary essences in all the samples analysed.
4.1.3 Quantitative Screening of the Phytochemicals/Bioactive Compounds in the Crude Extracts
The mean scores for the quantitative screening of the phytochemicals/bioactives in the crude extracts were stated in Table 3.3 while the graphical representation is shown in Figure 4.1 (b). Thus, from the results obtained, the saponin contents of samples AGX, ATX and AMX were 2.71, 2.53 and 2.48 respectively. The statistical analysis indicated that sample AGX is significantly different (P≤0.05) from all the samples, while samples ATX and AMX are not significantly different (P≥0.05). The flavonoid contents for the samples ranged from 14.33 to 10.68 with sample AMX having the highest mean score of 14.33, followed by sample AGX and ATX with mean scores of 11.84 and 10.68 respectively. Thus, they are statistically different from each other. Also, there were significant difference (P≤0.05) in the terpenoids contents of all the samples with sample AMX recording the highest mean score (7.30), followed by sample AGX with a mean value of 5.87 while sample ATX had the least score of 5.36. The results of the tannins indicated that sample AMX recorded 5.46, followed by sample ATX and AGX with mean values of 5.29 and 4.84 respectively. However, sample AMX was not statistically higher (P≥0.05) than sample ATX. The alkaloids showed that there were significant differences (P≤0.05) among all the samples with samples ATX, AGX and AMX recording mean values of 10.17, 7.47 and 6.84 respectively. The total phenolic contents of the sample AMX was 26.06 being the highest, while sample ATX recorded the least value of 20.93 while sample AGX scored 23.26. The statistical analysis revealed that all the samples were significantly different (P≤0.05). The mean scores for the steroids showed that sample ATX recorded 4.31, being the highest, followed by sample AGX with a value of 3.36, whereas sample AMX had the least mean score of 2.02. Statistically, all the samples differ significantly (P≤0.05). From the overall, the Figure 4.1(b) clearly showed that phenolic compounds are predominantly present in all the samples of the crude extracts as it was found to have the highest peaks. The results of this work is thus, in consonants with the values reported by Nwokenkwo, et al, (2020) which reported that ginger has more of phenolic compounds as also obtained in this work.
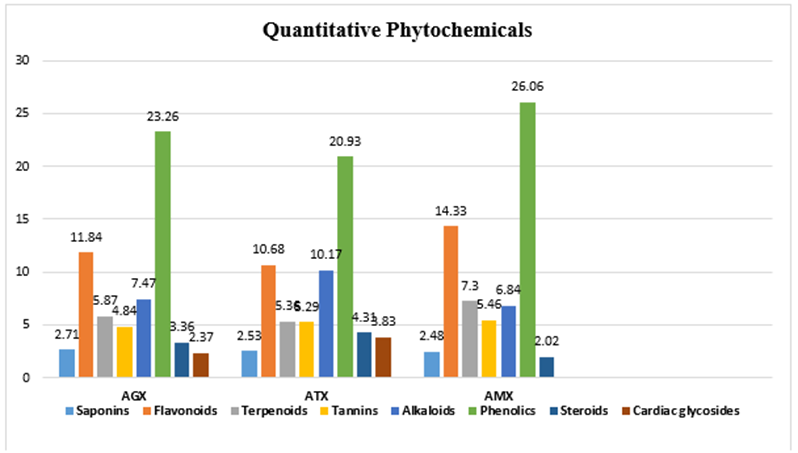
Figure 4.1b. Quantitative Phytochemicals
4.1.4. Antioxidant Assays
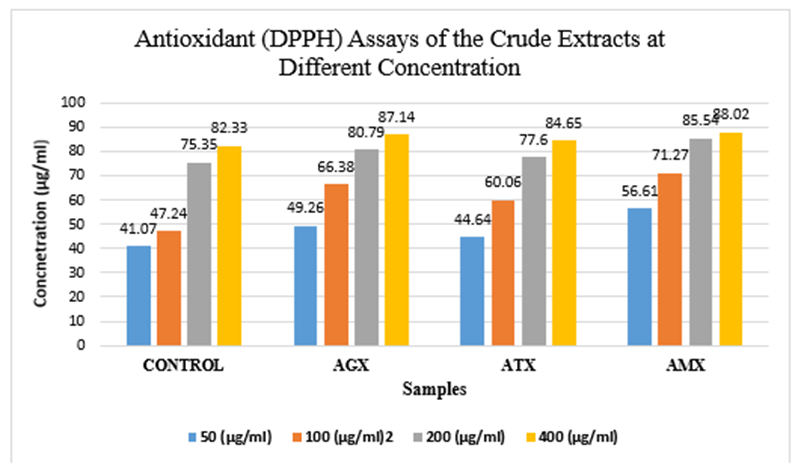
Figure 4.1(c): Antioxidant (DPPH) Assays of the Crude Extracts at Different Concentration
4.1.4.1 DPPH (2,2-diphenyl-1-picrylhydrazyl) Radical Inhibitory Activitiy of the crude Extracts.
The mean scores of DPPH (2,2-diphenyl-1-picrylhydrazyl) radical inhibitory activities for all the samples at different concentrations were presented in Table 4.4 and Figure 3.1(c). The DPPH radical inhibitory activities was done for four samples at different concentrations with the control sample being ascorbic acid, AGX (Zingiber officinale), ATX (T.Tetraptera) and AMX (M. myristica) extracts.
However, at concentration of 50 (µg/ml), sample AMX recorded the highest mean score (DPPH) of 56.61 µg/ml, followed by sample AGX with a mean score of 49.26 µg/ml whereas ATX and Control samples scored 44.64 and 41.07 µg/ml respectively. The statistical analysis conducted therefore, suggested that there were significant differences (P≤0.05).among all the samples, and the control recorded the least PPH value at the concentration of 50 µg/ml.
In the same vein, at the concentration of 100 µg/ml, sample AMX gave the highest DPPH value of 71.27 µg/ml, while sample ATX scored the least with a value of 60.06; thus, differs significantly (P≤0.05) among each other. In addition, sample AGX and the control recorded mean scores of 66.38 and 67.24 µg/ml respectively. Statistically, the control sample is not significantly (P≥0.05) higher than sample AGX. A study conducted by Arala, et al, (2020) suggested that tropical spices such as ginger and M. myristica contain high amounts of antioxidants up to the range of 60 µg/ml to 80 µg/ml; thus, the values obtained in this work fell within the range.
At 200 µg/ml, the antioxidant (DPPH radicals) analyzed clearly showed that all the samples are significantly different from each other. Thus, the sample with the highest mean score was AMX with a value of 85.54, while the control had the least mean score of 75.35. More so, samples AGX and ATX recorded a mean score of 80.79 and 77.60 respectively. At the concentration of 400 µg/ml, the results showed that sample AMX had the highest mean score (88.02), followed by sample AGX with a mean score of 87.14. Sample ATX recorded a mean score of 84.65 while the control sample gave the least mean value of 82.33. The statistical analysis however, revealed that the samples are significantly different (P<0>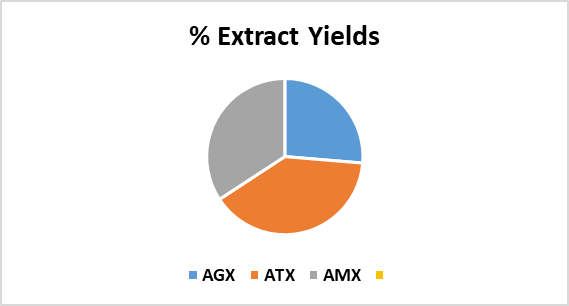
Figure 4.1c. The percentage Extract Yields for the different samples of Crude extracts
AGX = Ginger Extracts
ATX = Tetrapleura tetraptera extracts
AMX = Monodora myristica extracts
4.1.4.2. Ferric Reducing Antioxidant Power (FRAP) Activity of the Crude Extracts at Different Concentrations.
The mean scores of the ferric reducing antioxidant power (FRAP) activity of the crude extracts at different concentrations were clearly shown in Table 3.5. The FRAP was determined at different levels using 50, 100, 200 and 400 µg/ml respectively. From the results obtained, it was found that, at 50 µg/ml, the control sample had the lowest mean score (18.25) while sample AGX had the highest mean score (73.39). In addition to that, samples AMX and ATX recorded mean values of 40.84 and 34.42 µg/ml respectively. Sequel to statistical analysis conducted, the results suggested that there were significant differences (P≤0.05) among all the samples of the crude extracts evaluated (Table 3.5).
All the samples showed significant differences (P≤0.05) at 100 µg/ml, including the control which had the lowest mean value of 29.64. However, samples AGX, ATX and AMX recorded 82.42, 61.72 and 50.18 µg/ml respectively. The means obtained suggested that sample AGX had the highest value, preceded by sample ATX.
At 200 µg/ml, sample AGX had the highest antioxidant (FRAP) value with 88.51 µg/ml, precede by sample ATX with a value of 77.22 (Table 3.5). However, sample AMX recorded a mean value of 58.30 µg/ml, and lastly the control sample which gave a mean value of 38.80. Therefore, it was revealed that all the samples differ significantly (P≤0.05) from each other.
Furthermore, at 400 µg/ml all the samples replicated similar trends with sample AGX and Control have the highest and lowest mean scores of 89.93 and 62.69 µg/ml respectively, while samples ATX and AMX recorded mean values of 79.53 and 76.80 respectively. Thus, statistically, all the samples of the crude extracts were significantly different (P≤0.05) from each other. It can also be observed from the graph (Figure 4.1 d) that the increase in the concentration consequently results to increase in the ferric reducing antioxidant powers (FRAPs) of both the control samples and the crude extracts.

Figure 4.1(d): FRAP Activities of the Crude Extracts at Different Concentrations
4.1.4.3. Lipid Peroxidation Inhibition Activities of the Extracts at Different Concentrations.
The results of the lipid peroxidation inhibition activities of the extracts at different concentrations where represented on Table 3.6 and Figure 4.1(e). At 50 µg/ml, the control however, gave the highest mean value (2.86 µg/ml) followed by sample AMX with a mean score of 2.23 µg/ml, thus they are significantly different (P≤0.05) from each other. Also, sample AGX and ATX scored 2.01 and 1.73 respectively, and statistical analysis showed that the two samples also differ significantly (P≤0.05) from each other.
On the contrary, sample AMX had the highest mean value of 3.26 µg/ml, at 100 µg/ml, followed by the control sample that gave a mean value of 2.95 µg/ml. In addition, sample AGX and ATX scored 2.63 µg/ml and 1.97 µg/ml respectively. The values obtained indicated that sample ATX had the least lipid Peroxidation inhibition at 100 µg/ml. Thus, statistical analysis conducted clearly showed that all the samples of the crude extracts were significantly different (P≤0.05) from each other including the control as shown in Table 3.6.
Furthermore, the lipid peroxidation activities at 200 µg/ml tend to increase for the control which gave a mean vale of 4.08 µg/ml and followed by sample AMX with a value of 3.50 µg/ml. sample AGX scored 2.88 while sample ATX had the least mean score of 2.29 µg/ml. Statistical analysis suggested that there were also significant differences (P≤0.05) among all the samples analyzed including the control. At 400 µg/ml, the same trends were replicated, with the control having the highest mean value (6.34 µg/ml,), followed by sample AMX with a mean score of 4.55, whereas samples AGX and ATX recorded mean scores of 3.48 and 2.91 µg/ml, respectively. Thus, it showed that sample ATX had the lowest Lipid peroxidation inhibition activities while the control had the highest activity at 400 µg/ml. thus, all the samples were statistically different (P≤0.05) from each other. Figure 4.1(e) also showed that the Lipid peroxidation is directly proportional to concentration. The control sample however, showed the highest peak at the concentration of 400 (µg/ml). Chan, et al, (2011) reported that lipid peroxidation of plants extracts increase with increase inconcentration.
Therefore, it can be deduced that the differences among the samples could be attributed to the variations in the intrinsic factors in the crude extracts. However, it was observed that the values of the lipid peroxidation inhibition increases with increasing concentrations.

Figure 4.1e Lipid Peroxidation Inhibition Activities of the Extracts at Different Concentrations
5.1 Conclusion
The tropical spices (Ginger, Tetrapleura tetraptera, and Monodora myristica) were processed and the crude extracts (essential oils) were extracted using a microwave assisted extraction techniqueThe extract yields showed that the Monodora myristica yielded more essential oils than other spice samples (Ginger and Tetrapluera tetraptera).
The phytochemicals such as saponins, flavonoids, terpenoids, gingerols, alkaloids, phenolic compounds, steroids, tannins and cardiac glycosides were found to be present in both ginger and Monodora myristica as well as Tetrapluera tetraptera. Phenolics were found to be heavily present in all the samples of the extracts.
5.2. Recommendations
• Extraction optimization: Further research is needed to optimize the extraction of the crude extracts from the tropical spices which will therefore enhance their efficiency of extraction process. However, the darker colour and the stronger flavor of the crude extracts (essential oils), can be reduced by refining, and/or purification so as to obtain a more suitable and purer form of the extracts.
• Comprehensive qualitative and chemical characterization of the crude extracts is recommended for further studies so as to ascertain/identify the entire constituents of the extracts in ginger, Tetrapluera tetraptera, Monodora myristica.
• It is recommended that further studies be carried out on ginger, Tetrapluera tetraptera, Monodora myristica, and other tropical spices in areas of their utilization in the health and other related industries such as nutraceuticals.
5.3. Contributions to Knowledge
• Qunatitative phytochemical evaluation: The major phytochemicals in tropical spices (Zingiber offficinale, Tetrapluera tetraptera and Monodora myristica were quantitatively determined.
• The high antioxidants mostly found in ginger, and which are in relative amounts in Tetrapluera tetraptera, and Monodora myristica are very essential in arresting some cardiovascular diseases.
• The phytochemicals such as saponins, flavonoids, phenolics, etc; which are compounds present in the crude extracts however, are of enormous health benefits in both food and pharmaceutical industries; thus, can be used to produce healthy foods and supplements to be used for the diabetics and those having heart diseases and to check cholesterol.
• Overall, the study's contributions lie in the identification of tropical spices with antistress properties, the optimization of extraction methods, and the evaluation of phytochemicals and antioxidant activities.
The authors have affirmed that they have no conflicts of interest. Contributions from Writers: All authors worked together to complete this project. In addition to writing the Protocols and the first draft of the article, Author O.F.A, and O.C.I planned and designed the study. Data interpretation and statistical analysis were carried out by author OAF and O.C.I. Authors OIA and U.A.E conducted literature searches, participated in data gathering, and oversaw study analysis. The final draft was read by all writers and got their approval.
Special appreciation to the department of Food Science and Technology, Federal University of Technology, Owerri.
Dear Editorial Team, Clinical Medical Reviews and Reports. My experience with the journal was highly positive. The peer-review process was rigorous, constructive, and completed in a timely manner. The reviewers provided valuable comments that helped improve the quality and clarity of our manuscript. The editorial office was professional, responsive, and supportive throughout all stages of the publication process. Communication was clear and efficient, and any questions were addressed promptly. Overall, I found the journal to maintain high scientific standards and an excellent publication workflow. I would be pleased to consider submitting future work to this journal. Best wishes from, Elena Popa.

It was my pleasure to submit my testimonial concerning the Reviewer Board of our Scientific Journal “Brain and Neurological Disorders”. The Reviewers focused on some modifications and their contribution was helpful. The ladies of our Editorial Office were also supported my efforts. It was my honor to have such a co-operation and I am looking forward for more collaboration.

Dear Grace Pierce, Editorial Coordinator of Journal of Clinical Research and Reports, Thank you for the speedy and efficient peer review process. I appreciate the fact that your peer reviewers do not take months to respond like with some other journals. I would also like to thank the editorial office for responding quickly to my questions. It is an excellent journal. I plan to submit more manuscripts in the future. Best wishes from, Robert W. McGee

Dear Grace Pierce, Editorial Coordinator of Journal of Clinical Research and Reports, Working with you and your team on our recent publication in JCRR has been a truly wonderful and enjoyable experience. The responses were prompt, and the reviewers were patient, constructive, and highly professional. One reviewer in particular gave me the feeling that a professor was carefully reading and commenting on my coursework, which was deeply touching. The entire process was straightforward and hassle‑free, with no tedious online forms to complete. I highly recommend this journal. Best wishes from, DR Aibing Rao, Head of R&D

I Appreciate the Opportunity to Share my Experience with the Journal of Clinical Research and Reports. The peer review process was timely and constructive, and the feedback provided helped improve the quality of our manuscript. The editorial office was professional, responsive, and supportive throughout the process, ensuring smooth communication and efficient handling of the submission. Overall, it was a positive experience collaborating with your team.

Dear Mercy Grace, Editorial Coordinator of Obstetrics Gynecology and Reproductive Sciences, We would like to express our gratitude for your help at all stages of publishing and editing the article. The editors of the magazine answer all the necessary questions and help at every stage. We will definitely continue to cooperate and publish other works in the Obstetrics Gynecology and Reproductive Sciences! Best wishes from, Alla Konstantinovna Politova,
