
Research Article | DOI: https://doi.org/10.31579/2637-8914/153
1 Faculty of Food Engineering, School of Agronomy, Federal University of Goias, Rodovia GO-462, km zero, Campus, Department Samambaia, Goiânia, Goiás, Brazil. Zip code: 74690-900.
2 Faculty of Nutrition, Federal University of Goias, Rua 227 Viela Quadra 68 S/N - Setor Leste Universitário, Goiânia - GO, Brazil. Zip code: 74605-080
3 Faculty of Pharmacy.
*Corresponding Author: Nara Nascimento-Silva, Faculty of Food Engineering, School of Agronomy, Federal University of Goias, Rodovia GO-462, km zero, Campus, Department Samambaia, Goiânia, Goiás, Brazil.
Citation: Nara Rúbia R. do Nascimento Silva, Monteiro Cavalcante RB, Rafael C. Machado, Flávio A. da Silva, J. Nutrition and Food Processing, 6(6); DOI:10.31579/2637-8914/153
Copyright: © 2023, Nara Nascimento-Silva. This is an open access article distributed under the Creative Commons Attribution License, which permits unrestricted use, distribution, and reproduction in any medium, provided the original work is properly cited.
Received: 17 May 2023 | Accepted: 13 July 2023 | Published: 28 July 2023
Keywords: functional food; polyphenol; proximal composition; nutrients
Little has been discussed about the content and profile of phenolic compounds from buriti. The few studies found in the scientific literature diverge about these levels. So, aiming to propose a standardization in the method of extraction of phenolic compounds from buriti pulp and to facilitate the comparison between the results, this work aimed to validate the methodology of extraction of these compounds through an asymmetric factorial design. The optimal conditions for extraction of phenolic compounds in buriti pulp were evaluated in an asymmetric factorial study with three factors (solvent, number of extractions, and time). The extraction procedure consisted of adding the specific solvent to the sample, and submitting it to an ultrasound bath for different times. We concluded that the best treatment was the extraction with acetone in three steps of 30 min each, solid-liquid ratio of 1:10 (g:mL, m/v), using an ultrasonic bath at room temperature.
Buriti is the fruit of Mauritia flexuosa L. f., which is a palm tree of the Arecaceae family. It inhabits flooded regions and springs, often at low altitudes, bordering rivers, streams, and lakes. This palm tree is distributed throughout South America and can be found in Brazil, Bolivia, Colombia, Ecuador, Guianas, Peru, Venezuela and Trinidad and Tobago. It is considered the most abundant palm tree in Brazil (EMBRAPA, 2006).
The fruit can be consumed as juice, candy, ice cream and oil, or used in the production of handicrafts, construction material, cosmetics and pharmaceuticals. Many riverside and indigenous communities use this palm tree for their livelihood and some are dedicated to marketing the fruit or handicraft made from other parts of the palm, such as the leaves and fibers of the stem (Virapongse et al., 2017).
Studies indicate that the fruit stands out for its high concentrations of lipids, mainly oleic and palmitic acid, and considerable sugar and fiber contents, especially pectin (Berni et al., 2019; Lescano et al., 2018; Mesquita et al., 2020; Nascimento-Silva et al., 2020; Parente et al., 2020; Schiassi et al., 2018). However, what has attracted the attention of researchers is its great bioactive potential.
It is well established in the literature that buriti pulp stands out for its carotenoid contents (349.9 to 632.2 µg/g), mainly β-carotene (Cândido et al., 2015; Godoy & Rodriguez-Amaya, 1994; Nascimento-Silva et al., 2020; Rosso & Mercadente, 2007). Studies report considerable levels of polyphenols (360.1 to 495.9 mg GAE/100g) in this fruit (Cândido et al., 2015; Nascimento-Silva et al., 2020). However, few studies were found regarding the content and profile of phenolic compounds in M. flexuosa pulp. Researchers described very divergent extraction methods. Some researchers performed the extraction in a blender, others in grail and pistil, microwave, ultrasound or even in Soxhlet equipment (Abreu-Naranjo et al., 2020; Bataglion et al., 2014; Gomes et al., 2016; Tauchen et al., 2016).
Methods for extracting secondary metabolites, such as polyphenols, have been developed over the years. The oldest techniques comprise the simple maceration of food in contact with a solvent (water, alcohol, oil, etc.), which is chosen, because of the similarity of polarity with the compound to be extracted, and interaction kinetics with the food matrix. While the latest techniques require equipments such as ultrasound, microwave and centrifuge. Those equipments can speed up the process, save time and resources and increase yield (Lefebvre, Destandau, & Lesellier, 2021).
For the determination of total phenolic compounds, the Folin-Ciocalteu assay has been widely employed, based on the reduction of the phosphorus-wolframate-phosphomolybdate complex by phenolic compounds into a blue reaction product. Spectrophotometry is the main technique used for the quantification of different classes of phenolics because of its simplicity and low cost. Nevertheless, the major disadvantage of colorimetric assays is that they only estimate the total phenolic content without quantitative measurement of individual compounds (Ge, Li, & Lisak, 2020).
The first study to identify and quantify the phenolic compounds present in mature buriti pulp was Bataglion et al. (2014). The researchers added vanillic acid and isorhamnetin to 500 g of the pulp, and extracted the compounds with 500 mL of methanol in a glass blender for 15 min. Then the resulting solution was centrifuged (4000 rpm for 5 min) and the supernatant was separated from solid matter. The extracts were then concentrated in a rotary evaporator and suspended in methanol.
Only three other studies regarding the identification of phenolics in pulp from Mauritia flexuosa were found. Gomes et al. (2016) carried out the extraction of compounds from the freeze-dry buriti pulp with 3.0 mL of solvent (hydrochloric acid: methanol; 1:99; v/v) in a mortar, and submitted to microwave (450 W, for 30 sec). The extraction was completed in an ultrasound bath at 25 °C, at a constant frequency of 35 kHz, for 15 min. Afterwards, the samples were kept for one hour at room temperature and then the sebrenatant was collected after centrifugation (3500 rpm, 20 min). The solid matter was again subjected to all steps fifteen times, and the supernatant was mixed with the first extract.
Tauchen et al. (2016) extraíram os compostos fenólicos de polpa de buriti liofilizada em equipamento de Soxhlet com etanol 70%, durante 3 ciclos de 7 min cada, a 130 ºC seguido por resfriamento a 50 ºC. Em estudo mais recente, Abreu-Naranjo et al. (2020), adicionaram 20 mL de solução de metanol:àgua (80:20, v/v) a 2.0 g de polpa liofilizada, e mantiveram em agitação, à temperatura ambiente, por 2 horas. Por fim, o sobrenadante foi coletado após os extratos serem centrifugados (1000 rpm, 10 ºC, por 10 min).
Aiming to propose a standardization in the method of extraction of phenolic compounds from buriti pulp and to facilitate the comparison between the results, this work aimed to validate the methodology of extraction of these compounds through an asymmetric factorial design.
Samples
Buriti was collected in December 2019 in Caldazinha, Goias, Brazil. The fruits (Figure. 1) were collected during the harvest period, being selected according to the optimal maturity point and their morphological conditions. The point of ripening for harvest was established by the natural fruit, which loosens from the bunch. Then, they were sanitized with sodium hypochlorite, and manually pulped with a stainless-steel knife, vacuum packed in low-density polyethylene packages, protected from light, and stored until the moment of analysis at -20ºC.

Figure 1: Exocarp and mesocarpo of buriti fruit.
Extration procedure
The extraction procedures were performed based on Chisté et al. (2011) and Escarpa & González (2000), with modifications. To 1.0 g of buriti pulp were added 10.0 ml of different solvents (methanol; or methanol:acetone, 50:50, v/v; or acetone). Then, the teflon tubes containing the analyte were subjected to an ultrasound bath (UNIQUE – UltraSonic Cleaner – USC 2800) at 23 ºC in different times (30, 60, 90, and 120 min). The supernatant was collected and transferred to a 25.0 mL volumetric flask. The volume was made up with the solvent in question. To assess the need for further extractions, the solid matter underwent one or two more extractions, according to the experimental design (Table 1).
Asymmetrical factorial designs
The optimal conditions for extraction of phenolic compounds in buriti were evaluated in an asymmetric factorial study with three factors (solvent, number of extractions, and time) distributed in 3 and 4 levels (Tables 1 and 2). Experimental design allows you to test a given factor at a given level multiple times, combining the different factors, while simplex optimization tests the factor and its levels only once. The number of trials chosen for an experimental design is based on the resolution desired. In a factorial design, one can study main effects as well as interactions between factors (Oles, 1993). Mixed factorials, typically involve several factors, each with a small number of levels and rather few factors with more levels (Mukerjee, & Wu, 2006). Thus, it is useful to design balanced replicas for inference of stratified surveys (Whu, Zang & Wang, 1992).
Furthermore, the effect of any main effect or factor interaction is the difference among their average levels. Every fractional factorial design requires aliasing some or all of the factor effects. Thus, the correct and careful selection of the set of factors that will be analyzed together is essential for the assertive analysis of the effect of these factors (Gunst, & Mason, 2009).
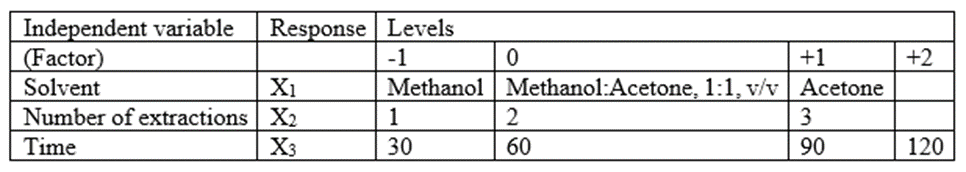
Table 1: Experimental model: independent variable levels (original and coded).
Total phenolic compounds
For the determination of total phenolic compounds, the Folin-Ciocalteu test was applied (Ge, Li, & Lisak, 2020). An aliquot of 0.25 ml of the extract was mixed with 0.25 ml of Folin-Ciocalteu reagent and 2.0 ml of distilled water. After 3 min at room temperature, 0.25 mL of 10% sodium carbonate solution (Na2CO3) was added to the mixture. The solutions were kept at room temperature for 60 minutes. The reading was carried out at 750 nm using a spectrophotometer (Genovese et al., 2008). The results were expressed in mg of gallic acid equivalent (GAE)/100 g of fresh sample (f.w.).
Statistical analysis
Data were previously analyzed for normality (Shapiro-Wilk test) and homogeneity of variances (Bartlett test) to define a parametric or non-parametric inferential statistical analysis. The results were analyzed by comparing the number of extractions and extraction time for each solvent, then the best results of each solvent were compared to evaluate the best performance. Data that showed normal distribution and homogeneity were evaluated by Analysis of Variance (ANOVA) with Tukey’s post-hoc, while the results that did not show normal distribution and homogeneity were performed using the Kruskal-Wallis test with Dunn’s post-hoc and Bonferroni’s fit method (Fig. 2.). All statistical tests were performed at a significance level of 0.05 (α = 5%). Data were analyzed using Graphpad Prism version 6.0.0 (Graphpad Software).
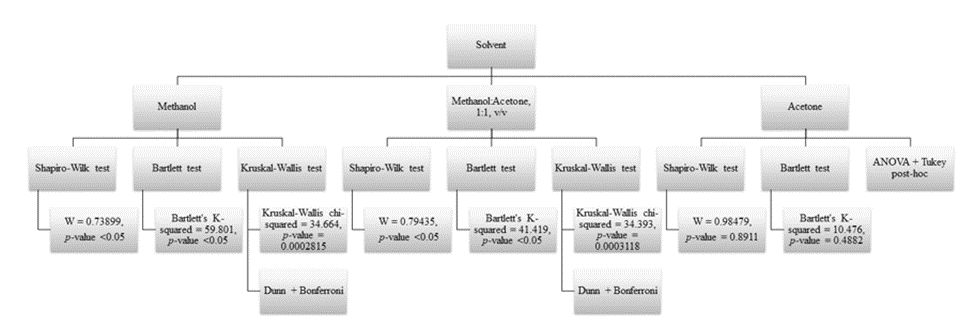
Figure 2: Flowchart performed in statistical analysis.
In the present study, solid-liquid extraction was applied, through which the solutes that are present in the food matrix migrate to the extraction solvent according to their physicochemical properties. The solvent plays the most important role in these extraction procedures, because of its high selectivity (Lefebvre, Destandau, & Lesellier, 2021). In addition, other factors can influence extract yield, such as the ratio between product mass and solvent volume, number of steps, and pH (Dorta, Lobo & González, 2013).
The extraction time varies between 45 and 60 min, depending on the study and the food matrix. Multiple extractions are applied to improve the extraction conditions (ultrasonic bath, solvent and time), which can present a yield that varies between 52 and 70%, 21 and 41% and 3 and 14%, in the first, second and third extractions, respectively (Escarpa & González, 2000).
Table 2
| Run | Independent variables | Total of phenolic compounds (mg of GAE/100 g) | ||
| X1 | X2 | X3 | ||
| 1 | -1 | -1 | -1 | 103.31 ± 0.25 |
| 2 | -1 | -1 | 0 | 103.14 ± 0.05 |
| 3 | -1 | -1 | +1 | 102.38 ± 0.07 |
| 4 | -1 | -1 | +2 | 103.04 ± 0.05 |
| 5 | -1 | 0 | -1 | 196.30 ± 0.03 |
| 6 | -1 | 0 | 0 | 233.07 ± 0.32 |
| 7 | -1 | 0 | +1 | 237.60 ± 0.29 |
| 8 | -1 | 0 | +2 | 236.36 ± 2.49 |
| 9 | -1 | +1 | -1 | 248.27 ± 0.49 |
| 10 | -1 | +1 | 0 | 248.08 ± 0.42 |
| 11 | -1 | +1 | +1 | 246.80 ± 0.20 |
| 12 | -1 | +1 | +2 | 249.09 ± 0.13 |
| 13 | 0 | -1 | -1 | 114.50 ± 0.38 |
| 14 | 0 | -1 | 0 | 110.77 ± 0.48 |
| 15 | 0 | -1 | +1 | 107.65 ± 0.05 |
| 16 | 0 | -1 | +2 | 108.30 ± 0.34 |
| 17 | 0 | 0 | -1 | 233.93 ± 1.31 |
| 18 | 0 | 0 | 0 | 242.27 ± 0.32 |
| 19 | 0 | 0 | +1 | 250.13 ± 0.56 |
| 20 | 0 | 0 | +2 | 238.70 ± 0.68 |
| 21 | 0 | +1 | -1 | 255.25 ± 0.08 |
| 22 | 0 | +1 | 0 | 266.24 ± 0.17 |
| 23 | 0 | +1 | +1 | 258.42 ± 3.34 |
| 24 | 0 | +1 | +2 | 257.04 ± 0.82 |
| 25 | +1 | -1 | -1 | 107.22 ± 0.20 |
| 26 | +1 | -1 | 0 | 117.94 ± 0.36 |
| 27 | +1 | -1 | +1 | 119.52 ± 1.19 |
| 28 | +1 | -1 | +2 | 115.75 ± 1.65 |
| 29 | +1 | 0 | -1 | 243.61 ± 0.89 |
| 30 | +1 | 0 | 0 | 255.44 ± 1.26 |
| 31 | +1 | 0 | +1 | 249.93 ± 0.89 |
| 32 | +1 | 0 | +2 | 250.98 ± 0.85 |
| 33 | +1 | +1 | -1 | 267.44 ± 0.63 |
| 34 | +1 | +1 | 0 | 254.58 ± 0.87 |
| 35 | +1 | +1 | +1 | 254.40 ± 0.35 |
| 36 | +1 | +1 | +2 | 255.74 ± 0.59 |
Experimental model and total concentration of phenolic compounds from buriti pulp.
The application of ultrasound in the extraction procedure of phenolic compounds does not increase the extract’s yield. However, it significantly reduces the extraction time besides decreasing solvent consumption. The cavitation process increases the number of broken cells and provides quicker access to accessible components for extraction, thus decreasing the ratio between sample mass and solvent volume required for extraction (Chemat, Zill-e-Huma, & Khan, 2011; Chen et al., 2007). Furthermore, it is known that the use of ultrasound can increase the antioxidant capacity of phenolic compounds by generating OH- radicals through the acoustic cavitation of water molecules (Ashokkumar, 2015). For these reasons, ultrasound has been increasingly used in order to improve the methods of extracting polyphenols from different food matrices.
On the other hand, Dorta, Lobo & González (2013) reported that the use of microwaves did not influence the final yield of extracts of phenolic compounds in mango seeds. However, they concluded that the highest yield was observed in the extracts obtained after three steps, with a solvent mixture (acetone: water, 50:50, v/v), sample and solvent mass ratio of 1:30 (m/v) and pH of 8.0.
There was no statistical difference in the yield of phenolic compounds (p-value >0.05), which were extracted in methanol, and which underwent two or three extractions for all extraction times (30, 60, 90 and 120 min). However, the absolute value was higher in extracts that underwent three extractions. The extraction performed with methanol, in three stages, for a time of 120 minutes, showed the highest absolute yield (249.09 ± 0.13 mg GAE/100 g), despite being statistically equal (p >0.05) to most of the extraction processes in times of 30, 60 and 90 min. Thus, there is no greater yield in the total content of phenolic compounds with extractions in times of 60, 90 and 120 minutes, and it is preferable to perform the extraction in the shortest time, 30 min (Fig. 3).
Regarding the extracts obtained with a mixture of solvents (methanol: acetone, 1:1, v/v), the extraction in three stages, for a time of 60 min, showed the highest absolute yield (266.24 ± 0.17 mg GAE/100g ), but it was statistically equal (p >0.05) to most extraction processes of 30, 60, 90 and 120 min. For the procedures of only one extraction, in the times of 90 and 120 min it was possible to see a low yield in the total concentration of polyphenols when compared to the yield of the best extraction (60 min in cycles of three extractions). Once again, it was not possible to observe a statistical difference between two or three extractions, although the absolute value of phenolic compounds was slightly higher after performing three steps of the process (Fig. 3). According to Escarpa & González (2000) the third stage extracting 3 to 14% of the total content of phenolic compounds. Thus, as this concentration can be very low, it is not enough to demonstrate a statistical difference.
On the other hand, the extracts that were obtained from the use of acetone as an organic solvent showed a better result among the other extracts, which stood out with statistical significance (p-value <0>
Finally, when comparing the best absolute results of the yield of extracts by different solvents (runs 12, 22 and 33), the yield that stood out significantly was that of the extract produced with acetone from three consecutive extractions, of 30 min each (Fig. 3).
Thus, our work can prove the fact noted by Dorta, Lobo & González (2013), who reported that the choice of solvent is the factor that most influences the final yield of the extract, and that the extraction time does not change this result. In addition, we can see the need to carry out three steps in order to extract the total content of compounds, as reported by Escarpa & González (2000).

Figure 3: Total contents of phenolic compounds from buriti pulp extracted through the association of three different independent variables (number of extractions, time and solvent).
Results similar to ours were observed by Zachová et al. (2018), when analyzing different factors that affect the yield of stilbenes extraction from grape cane. The researchers reported that the total levels of the extract were directly proportional to the increase in extraction time (from 5 to 20 min) and number of cycles (1 to 3), despite the total levels of trans-resveratrol being practically complete after two extractions. Furthermore, the extracts obtained with acetone showed a higher total concentration of the compounds analyzed (trans-resveratrol = 66.2 mg/g; trans-ε-viniferin = 40.6 mg/g; and r2-viniferin = 15.2 mg/g) compared to ethanol (trans-resveratrol = 26.9 mg/g; trans-ε-viniferin = 17.3 mg/g; and r2-viniferin = 6.2 mg/g) and methanol (trans-resveratrol = 20.4 mg/g; trans-ε-viniferin = 12.8 mg/g; and r2-viniferin = 4.4 mg/g) under the same conditions.
The proposed method to evaluate the different factors that can influence the extraction of phenolic compounds from buriti was effective to validate the extraction methodology. Therefore, we should suggest that the extraction be performed with acetone in three steps of 30 min each, solid-liquid ratio of 1:10 (g:mL, m/v, in each extraction), using an ultrasonic bath at room temperature. Furthermore, it was possible to prove that the factor that most influences the final yield of the extract is the variation of solvents. Studies that evaluate the relationship between the different extraction processes and the yield of individual phenolic compounds from buriti pulp are suggested.
Dear Editorial Team, Clinical Medical Reviews and Reports. My experience with the journal was highly positive. The peer-review process was rigorous, constructive, and completed in a timely manner. The reviewers provided valuable comments that helped improve the quality and clarity of our manuscript. The editorial office was professional, responsive, and supportive throughout all stages of the publication process. Communication was clear and efficient, and any questions were addressed promptly. Overall, I found the journal to maintain high scientific standards and an excellent publication workflow. I would be pleased to consider submitting future work to this journal. Best wishes from, Elena Popa.

It was my pleasure to submit my testimonial concerning the Reviewer Board of our Scientific Journal “Brain and Neurological Disorders”. The Reviewers focused on some modifications and their contribution was helpful. The ladies of our Editorial Office were also supported my efforts. It was my honor to have such a co-operation and I am looking forward for more collaboration.

Dear Grace Pierce, Editorial Coordinator of Journal of Clinical Research and Reports, Thank you for the speedy and efficient peer review process. I appreciate the fact that your peer reviewers do not take months to respond like with some other journals. I would also like to thank the editorial office for responding quickly to my questions. It is an excellent journal. I plan to submit more manuscripts in the future. Best wishes from, Robert W. McGee

Dear Grace Pierce, Editorial Coordinator of Journal of Clinical Research and Reports, Working with you and your team on our recent publication in JCRR has been a truly wonderful and enjoyable experience. The responses were prompt, and the reviewers were patient, constructive, and highly professional. One reviewer in particular gave me the feeling that a professor was carefully reading and commenting on my coursework, which was deeply touching. The entire process was straightforward and hassle‑free, with no tedious online forms to complete. I highly recommend this journal. Best wishes from, DR Aibing Rao, Head of R&D

I Appreciate the Opportunity to Share my Experience with the Journal of Clinical Research and Reports. The peer review process was timely and constructive, and the feedback provided helped improve the quality of our manuscript. The editorial office was professional, responsive, and supportive throughout the process, ensuring smooth communication and efficient handling of the submission. Overall, it was a positive experience collaborating with your team.

Dear Mercy Grace, Editorial Coordinator of Obstetrics Gynecology and Reproductive Sciences, We would like to express our gratitude for your help at all stages of publishing and editing the article. The editors of the magazine answer all the necessary questions and help at every stage. We will definitely continue to cooperate and publish other works in the Obstetrics Gynecology and Reproductive Sciences! Best wishes from, Alla Konstantinovna Politova,
