
Research Article | DOI: https://doi.org/10.31579/2637-8914/037
1 Department of Food Science, Beijing Union University, Beijing 100023, P. R. China.
2 COFCO Nutrition and Health Research Institute Co Ltd, Beijing 102209, P.R. China.
*Corresponding Author: Bodi Hui, Department of Food Science, Beijing Union University, Beijing, P. R. China. Received date: January 15, 2021; Accepted date: April 27, 2021; Published date: May 26, 2021
Citation: Bodi Hui, Jin Huang, (2021). The Total Amount and Composition Determination of Crocetin and Its Derivatives from Gardenia Yellow by HPLC-MS-MS. J. Nutrition and Food Processing, 4(3); DOI:10.31579/2637-8914/037.
Copyright: © 2021 Chen Pan, This is an open access article distributed under the Creative Commons Attribution License, which permits unrestricted use, distribution, and reproduction in any medium, provided the original work is properly cited.
Received: 15 January 2021 | Accepted: 27 April 2021 | Published: 26 May 2021
Keywords: gardenia yellow; crocetin; crocetin derivative; crocin; gardenia jasminoides ellis; high performance liquid chromatography- mass spectrometry/ mass spectrometry (HPLC-MS/MS); crocetin esters; major fragmentation
Consisting of crocetin derivatives as major color materials, gardenia yellow is a water-soluble food colorant extracted from the fruits of Gardenia jasminoides Ellis. However, as color materials, the total crocetin and its derivative amount and composition cannot be determined because the structures of some crocetin derivatives are currently unknown and the commercially-available reference sample is still short. This study aims to develop a method for the total amount and composition determinations of crocetin and its derivatives from gardenia yellow. In practice, the absorption coefficient of each crocetin derivative is calculated from that of crocetin and the negative correlation of absorbance with molecular mass of each derivative, while the molecular mass of each crocetin derivative is substituted by the m/z value of its parent ion on MS. The relative standard deviation (RSD) of reproducibility was 3.17%. The recovery of added external reference sample was ≥97±1.61%. The minimum detection limit was 7.44μg/mL.
Practical Applications
In the industrial base, a method to determine the absorption coefficient, normally presented as a color value, of gardenia yellow is currently applied for the product quality control scheme. Under such conditions, the product quality was controlled by its color shade but not mass. It is expected that this approach will be replaced by the method developed in this study for the product quality control scheme. By this method, the color value will be substituted by the mass amount of the product for its quality control. This effort will provide a possibility to verify the biological functions and evaluate the safety of gardenia yellow.
Introduction
Gardenia yellow is a product that is usually used in foods as a colorant under the category of food additive in eastern Asian countries, especially in China, Japan and South Korea (World Health Organization). The product is usually extracted from the fruits of Gardenia jasminoides Ellis by EtOH with further purification [1-5]. Crocetin and its derivatives are the major color materials of the product [6]. Apart from crocetin, the product usually comprises more than 15 species of crocetin derivatives, mainly esters.
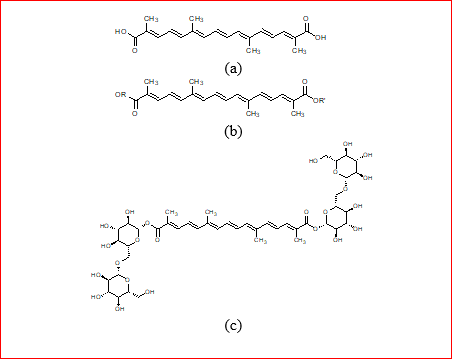
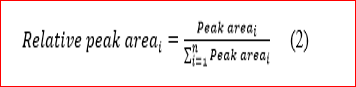
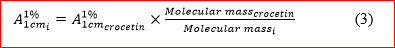
The root structure of the derivatives, crocetin, is a C20 carotenoid with the molecular formula and mass of C20H24O4 and 328.40 Da. Crocin was the first discovered crocetin ester (from Crocus sativus L.) in nature, and occurs in the fruits of Gardenia jasminoides Ellis with the largest amount. Its molecular structure has been well elucidated. In subsequent studies, Crocus sativus L. was the primary focus in understanding the structure of crocetin esters. In 1975, several carotenoid glycosyl esters were isolated and identified from by ultraviolet–visible spectroscopy (UV/VIS), infrared spectroscopy (IR), 1H nuclear magnetic resonance (1H-NMR) and mass spectrometry (MS) [7]. Sujata V. et al further confirmed that crocetin esters were the metabolites in the followers of Crocus sativus L. A number of crocetin esters and their geometrical isomers were then identified by HPLC-PDA-MS [8-10]. Pfister S. et al first reported the isolation and structure elucidation of crocetin esters from the fruits of Gardenia jasminoides Ellis [11]. The identification and structure elucidation of crocetin esters were then undertaken [14-16]. It is believed that a continuous effort to elucidate the structures of crocetin esters will not stop until the structures of all esters are known from the fruits of gardenia yellow. The molecular structures of crocetin, crocetin ester and crocin, the most common encountered crocetin ester in gardenia yellow are given in Figures 1(a), (b) and (c).
Because the structures of some derivatives are still unknown and the commercially available reference samples of all the derivatives, apart from crocetin-di-β-D-gentiobiosyl ester (crocin), are lacking in the market, the amount and composition of color materials, including crocetin and its derivatives from gardenia yellow cannot be currently determined by either external or internal references. In food industrial base, the addition of gardenia yellow (as a colorant) to food media can only be undertaken by its color value but not quantity. The product quality is usually controlled by its color value but not purity. A number of attempts were made to determine the total amount and composition of crocetin derivatives from gardenia yellow [17,18]. Crocin was considered as an external reference sample in those studies. As an alternative, crocetin was also applied as an indicator to evaluate the composition of the crocetin derivatives [19,20].
A method to determine crocetin, its derivative amounts and composition from gardenia yellow was developed by UV-VIS and HPLC-MS-MS in this study based on their electronic absorption spectral characteristics and molecular mass. With this method, the crocetin, its derivative amounts and composition were able to be determined without the aid of external or internal references, even though the molecular structures of some derivatives were unknown.
In industrial base, a method to determine the absorption coefficient, normally presented as color value, of gardenia yellow is currently applied for the product quality control scheme. It is expected that this approach will be replaced by the method developed in this study for the product quality control scheme. By this method, the color value will be substituted by the mass amount of the product for its quality control. This effort will provide a possibility to verify the biological functions and evaluate the safety of gardenia yellow product.
1.1 Materials
Gardenia yellow product with the label of E500 was extracted from the fruits of Gardenia jasminoides Ellis by EtOH and provided by Henan Zhongda Hengyuan Biotechnology Co. Ltd. EtOH, trifluoroacetic acid (TFA), acetic acid was of AR grade and purchased from a local supplier. Acetonitrile was of HPLC grade and purchased from Dikma Technologies (USA). The water used to prepare the HPLC mobile phase was purified by counter-current osmosis. The crocin reference sample was purchased from Sigma (C/N: 17304-1G). Purity: >95% (W/W, HPLC).
1.2 Instrumentation
UV-VIS spectrophotometer: MultiSpec1500 (Shimadzu); LC-PDA-MS-MS: Thermo U-3000-Thermo LTQ Orbitrap XL equipped with PDA, the ion source of ACPI and the central data processing unit of Xcalibur (Thermo Fisher Scientific, USA).
1.3 Methods
1.3.1 The specific absorption coefficient determination of gardenia yellow by UV-VIS
This investigation aims to provide the E1cm1%

(440±1 nm) of gardenia yellow. In practice, 0.0502 g gardenia yellow powders were accurately (0.0001 g) weighed and then completely dissolved in water to make the total volume of 50 mL. After the solution was diluted 100 times, the absorbance (A) of the solution was measured on a UV-VIS spectrophotometer at 440±1 nm, with water used as control. The specific absorption coefficient of the product is calculated as follow:

Where
E1cm1%

(440±5nm) = The specific absorption coefficient is defined as the absorbance of the product solution of 1 % concentration, i. e. 1 g in 100 mL, in a 1cm path-length cuvette.
A=Actual absorbance of the product solution
C= Concentration [g/mL] of the product solution
1.3.2 The crocetin derivative separation from gardenia yellow by C18-HPLC
An aliquot of gardenia yellow aqueous solution as described in Section 1.3.1 was filtered by 0.45 µm filter before dilution and immediately used for HPLC injection.
The chromatographic profile of gardenia yellow aqueous solution was acquired on C18-HPLC under the following conditions: DiamonsilTM C18 (4.6×250 mm, 5 mm) column; Mobile phase A = H2O-CH3CN-acetic acid at 74.95:25:0.05 (V/V/V); Mobile phase B = CH3CN; Linear gradient: Mobile phase B increased from 0 to 13.1% (V/V) in 20 minutes subsequently followed by an isocratic elution for 20 minutes; Flow rate = 0.8 mL/min; Sample injection volume = 20 µL; Column temperature = 25 ℃; PDA monitoring wavelength = 440 nm. The electronic absorption spectrum of each fraction was acquired from 250 to 700 nm by PDA. The peak area of each fraction was integrated.
1.3.3 The relative peak area measurement of each fraction
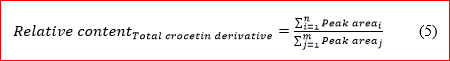
The relative peak area (%) of each crocetin derivative fraction is calculated according to formula (2).
Where
Relative peak area i= Relative peak area of crocetin derivative i in total crocetin derivative
Peak area i=Peak area of crocetin derivative i
i = Fraction number of crocetin derivative
n = Total number of crocetin derivative
1.3.4 The crocetin derivative fraction identification by MS
The MS characteristics of each crocetin derivative fraction were further acquired by the online MS detector under the following conditions: Spray voltage = -4.0 Kv; Sheath gas = 30 arb; Auxiliary gas = 10 arb; Purge gas = 0 arb; Capillary temperature = 350 ºC; Negative ion detection mode; The secondary mass spectra data acquisition: Data dependency scan; CID collision energy = 35%; Fragment mass scanning range = 150-2000 (m/z). The molecular ion peak was for each crocetin derivate was carefully identified and verified. The m/z value of each molecular ion was recorded.
The crocetin derivative fractions were identified by MS and the secondary MS according to the presence of crocetin ion = 327 [m/z], as the root structure of the molecules.
1.3.5 The specific absorbance coefficient measurement of each crocetin derivative
The specific absorption coefficient of each crocetin derivative fraction is calculated from the published absorption coefficient, A1cm1%

= 3820 (in EtOH), of crocetin as root structure, in accordance with the negative dependence of crocetin derivative UV-VIS absorbance on its side-chain quantity and mass indicated by molecular mass as shown in formula (3). The molecular mass of each crocetin derivative is hereon substituted by its measured parent ion [M-1]- mass reading [m/z] from MS.
Where
A1cmi1%

= Absorbance coefficient of crocetin derivative i, defined as the theoretical absorbance of a 1% (W/V) crocetin derivative i solution in a cell of 1cm path-length at monitored 440nm.
A1cmCrocetin1%

= Absorbance coefficient of crocetin, defined as the theoretical absorbance of a 1% (W/V) crocetin solution in a cell of 1cm path-length monitored at 440 nm. Published value of 3820 (in methanol) is applied hereon.
Molecular mass crocetin= Molecular mass of crocetin. Published value of 328 is applied hereon.
Molecular mass I = Molecular mass of crocetin derivative i. Molecular mass of each crocetin derivative is hereon substituted by its parent ion mass [m/z] from MS.
i= Fraction number of crocetin derivative
1.3.6 The specific absorbance coefficient measurement of total crocetin derivative
The specific absorption coefficient of total crocetin derivative is calculated by weighted sum from the relative peak area and absorption coefficients of each crocetin derivative as the results of formulae (2) and (3), respectively, according to formula (4).

Where
Relative peak area i= Relative peak area of crocetin derivative i
A1cmTotal crocetin derivative1%

= Absorption coefficient of total crocetin derivative, defined as the theoretical absorbance of a 1% (W/V) total crocetin derivative solution in a cell of 1cm path-length monitored at 440nm.
A1cmi1%
=Absorbance coefficient of crocetin derivative i, defined as the theoretical absorbance of a 1% (W/V) crocetin derivative i solution in a cell of 1cm path-length monitored at 440nm.
i= Fraction number of crocetin derivative
n= Total number of crocetin derivative
1.3.7 The relative content measurement of total crocetin derivative
The relative content of total crocetin derivative in total pigment is calculated from the peak area of each fraction monitored at 440 nm according to formula (5).
Where
Relative content Total crocetin derivative= Relative content of total crocetin derivative in total pigment
Peak area i= Peak area of crocetin derivative i
Peak area j= Peak area of fraction j
i = Fraction number of crocetin derivative
n = Total number of crocetin derivative
j = Fraction number
m = Total fraction number
1.3.8 Measurement of the total crocetin derivative amount
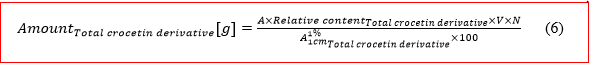
According to Lambert-Beer law, the amount of total crocetin derivative in gardenia yellow sample is calculated from the absorbance of the gardenia yellow aqueous solution, the relative content of total crocetin derivative in total pigment, and the specific absorption coefficient of total crocetin derivative as shown by formula (6).
Where
Amount Total crocetin derivative[g] = Amount of total crocetin derivative in the gardenia yellow sample
A = Absorbance of sample solution
V = Solvent volume for sample originally dissolving
N = Dilution fold of sample solution
Relative content Total crocetin derivative= Relative content of total crocetin derivative in total pigment
A1cmTotal crocetin derivative1%

= Absorption coefficient of the total crocetin derivative, defined as the theoretical absorbance of a 1% (W/V) total crocetin derivative solution in a cell of 1cm path-length monitored at 440nm.
1.3.9 The relative content measurement of total crocetin derivative
The relative content of total crocetin derivative in the gardenia yellow sample is calculated from the amount of total crocetin derivative and sample weight according to formula (7).

Where
Content Total crocetin derivative [%] =Content of total crocetin derivative in the gardenia yellow sample
Amount Total crocetin derivative[g] = Amount of total crocetin derivative in the gardenia yellow sample
M=Mass of the gardenia yellow sample
1.3.10 The relative content measurement of each crocetin derivative
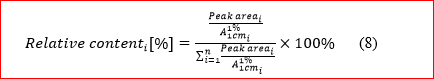
According to Lambert-Beer law, the relative content of each crocetin derivative in total crocetin derivative is calculated from the peak area and absorption coefficients of each crocetin derivative as shown by formula (8).
Where
Relative content i= Relative content of each crocetin derivative in total crocetin derivative
Peak area i= Peak area of crocetin derivative i
i=Fraction number of crocetin derivative
n=Total number of crocetin derivative
1.3.11 Measuring the amount of each crocetin derivative
The amount of each crocetin derivative from the gardenia yellow sample is calculated from the relative content of each crocetin derivative and the total amount of crocetin derivative according to formula (9).

Where
Amount i= Amount of each crocetin derivative from the gardenia yellow sample
Relative content i= Relative content of each crocetin derivative in total crocetin derivative
Amount Total crocetin derivative= Amount of total crocetin derivative in the gardenia yellow sample
i= Fraction number of crocetin derivative
1.3.12. The relative crocetin content measurement of each crocetin derivative
According to formula (10), the relative crocetin content of each crocetin derivative is calculated from the molecular masses of crocetin and its derivative, 328Da and the parent ion mass of the derivative respectively.

Where
Relative crocetin content i= Relative crocetin content of each crocetin derivative
Crocetin molecular mass = 328Da
Crocetin derivative molecular mass i: The molecular mass of crocetin derivative i is hereon substituted by its parent ion [M-1]- mass value[m/z] from MS.
i = Fraction number of crocetin derivative
1.3.13 The relative crocetin content measurement from the total crocetin derivative
The relative crocetin content of total crocetin derivative is calculated from the relative crocetin content of each crocetin derivative and its relative peak area by weighted sum.

Where
Relative crocetin content Total crocetin derivative= Relative crocetin content of total crocetin derivative
Relative crocetin content i= Relative crocetin content of each crocetin derivative
Peak area i= Peak area of crocetin derivative i
i = Fraction number of crocetin derivative
1.3.14 The total crocetin amount measurement of gardenia yellow sample
The total crocetin amount of gardenia yellow sample is calculated from the relative crocetin content of total crocetin derivative and the amount of total crocetin derivative.

Where
Relative crocetin content Total crocetin derivative= Relative crocetin content of total crocetin derivative
Amount Total crocetin derivative= Amount of total crocetin derivative in the gardenia yellow sample
1.3.15 Recovery, reproducibility and minimum detection limit
The amount equal to the crocin amount from gardenia yellow product adduced from external references was added to the sample before the analysis for the recovery, reproducibility and RSD assessment of the method. Additionally, minimum detection limit is also detected with added crocin.
The final result is calculated from the arithmetic mean of parallel measurements. The absolute difference of two independent observations is not more than 5% of their arithmetic mean under the same conditions.
2.1 The specific absorption coefficient determination of gardenia yellow by UV-VIS
The absorbance (A) of the diluted gardenia yellow aqueous solution at the concentration of 10.04mg/mL was 0.5064 at 440nm. The specific absorption coefficient at 440nm (E1cm1%

) of gardenia yellow was 504.38, calculated according to formula (1).
2.2 The C18-HPLC profile of Gardenia Yellow
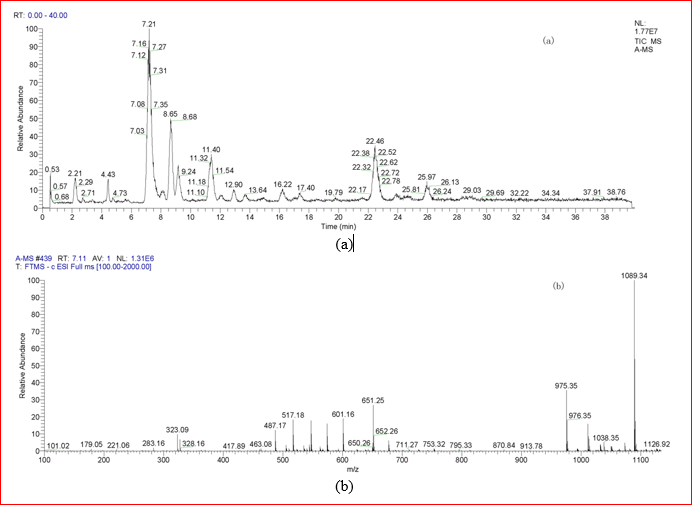
Figure 2 illustrates the C18-HPLC profile of gardenia yellow. It was observed from Figure 2 that the crocetin and its derivatives were well separated under the conditions employed in this study. The crocin fraction was identified in comparison of its retention time = 7.093 min, its lmax= 440 nm and the fine structure of its electronic absorption spectrum with those of external reference sample.

2.3 The fraction identification of gardenia yellow by HPLC-MS-MS
Through MS and the secondary MS, the crocetin derivative fractions were carefully identified as the root structure of the molecules from the presence of crocetin ion = 327[m/z]. Under the conditions of ionization employed in this study, the major fragmentation taken placed during the MS process was the breaking of glycoside bonds. As an example, Figure 3 gives the TIC (a) of gardenia yellow and the mass spectrum (b) and secondary mass spectrum (c) of fraction at 7.093min. The ions 1089.34(100), 975.35 and 651.25 were seen from Figure 3(b). The ion 1089.34 was identified as parent ion [M-1]-. The presence of ions 975.35 and 651.25 suggested that the parent ion consisted of gentibioside-crocetin-gentibioside as the root structure. This was further verified by the presence of ions 1089.34(100), 975.35, 651.25 and 327.15 from the secondary spectrum in Figure 3(c). The fraction would therefore be considered as a crocetin derivative.

2.4 The relative peak area of each fraction on the HPLC chromatogram of gardenia yellow
It is observed from Figure 2 that each fraction of gardenia yellow sample was readily separated under HPLC conditions as mentioned above. The peak area of each fraction was integrated. The relative peak area of each fraction was then calculated and given in Table 1.

2.5 Crocetin derivative fraction identification by MS
The crocetin derivative fractions were identified by MS as the root structure of the molecules according to the presence of crocetin ion = 327 m/z. The fractions containing crocetin structure are given in Table 1. The parent ion m/z value of each crocetin derivative is also recorded in Table 1.
2.6 The specific absorbance coefficient of each crocetin derivative
With reference to the published specific absorption coefficient of crocetin, the specific absorption coefficient of each crocetin derivative fraction is calculated in accordance with the negative dependence of crocetin derivative UV-VIS absorbance on its side-chain quantity and mass indicated by molecular mass given in Table 1.
2.7 The specific absorbance coefficient of total crocetin derivative
The specific absorption coefficient of the total crocetin derivative was calculated by the weighted sum from the relative peak area and the specific absorption coefficients of each crocetin derivative to be 1125.
2.8 The relative content of total crocetin derivative
The relative content of total crocetin derivative in total pigment is calculated to be 97.20%, from the peak area of each fraction monitored at 440 nm.
2.9 Total crocetin derivative amount
The amount of total crocetin derivative in gardenia yellow sample is calculated to be 0.0225 g from the absorbance of gardenia yellow aqueous solution (measured by UV-VIS), the relative content of total crocetin derivative in total pigment and the specific absorption coefficient of total crocetin derivative.
2.10 The relative content of total crocetin derivative from gardenia yellow
The relative content of total crocetin derivative in the gardenia yellow sample is calculated to be 44.82% (W/W) from the amount of total crocetin derivative and sample weight.
2.11 The relative content of each crocetin derivative
According to Lambert-Beer law, the relative content of each crocetin derivative in total crocetin derivative is calculated from the peak area and absorption coefficients of each crocetin derivative and illustrated in Table 1.
2.12 The amount of each crocetin derivative
The amount of each crocetin derivative from the gardenia yellow sample is calculated from the relative content of each crocetin derivative and the amount of total crocetin derivative and is given in Table 1.
2.13 The relative crocetin content of each crocetin derivative
The relative crocetin content of each crocetin derivative is calculated from the molecular masses of crocetin and its derivative, 328Da and the parent ion mass of the derivative respectively. The relative crocetin content of each crocetin derivative is given in Table 1.
2.14 The relative crocetin content of total crocetin derivative
The relative crocetin content of total crocetin derivative is calculated to be 29.35% from the relative crocetin content of each crocetin derivative and its relative peak area by weighted sum.
2.15 The total crocetin amount of gardenia yellow sample
From the relative crocetin content of total crocetin derivative and the amount of total crocetin derivative, the total crocetin amount of gardenia yellow is calculated to be 0.0066 g in the 0.0502 g gardenia yellow sample. The relative crocetin amount of gardenia yellow is 13.15% (W/W).
2.16 Precision and accuracy
To evaluate the precision and accuracy of the method as described above, 0.0115 g external reference sample of crocin (equal to the amount of crocin derivative fraction at 7.093 min from gardenia yellow sample) was added to the 0.0502 g gardenia yellow sample. The recovery, reproducibility and relative standard deviation (RSD) of added external reference sample were consequently assessed. Additionally, minimum detection limit was also detected.
It was observed that the RSD of repeated assessments for more than 6 times was less than 3.17%. This observation suggested that the method exhibited good reproducibility. Additionally, the recovery of added crocin was more than 97±1.61%. The minimum detection limit of crocin was 7.44μg/mL.
The major color materials from gardenia yellow are a group of crocetin derivatives. The molecular structures of some derivatives are well elucidated while those of the others are unknown and their commercial refence samples are short. The total amount and composition determinations of crocetin derivative are therefore currently difficult. The method developed in this study provides a possibility to assess each of the total derivative amounts through their absorption coefficients, although the molecular structures of some derivatives are unknown.
Dear Editorial Team, Clinical Medical Reviews and Reports. My experience with the journal was highly positive. The peer-review process was rigorous, constructive, and completed in a timely manner. The reviewers provided valuable comments that helped improve the quality and clarity of our manuscript. The editorial office was professional, responsive, and supportive throughout all stages of the publication process. Communication was clear and efficient, and any questions were addressed promptly. Overall, I found the journal to maintain high scientific standards and an excellent publication workflow. I would be pleased to consider submitting future work to this journal. Best wishes from, Elena Popa.

It was my pleasure to submit my testimonial concerning the Reviewer Board of our Scientific Journal “Brain and Neurological Disorders”. The Reviewers focused on some modifications and their contribution was helpful. The ladies of our Editorial Office were also supported my efforts. It was my honor to have such a co-operation and I am looking forward for more collaboration.

Dear Grace Pierce, Editorial Coordinator of Journal of Clinical Research and Reports, Thank you for the speedy and efficient peer review process. I appreciate the fact that your peer reviewers do not take months to respond like with some other journals. I would also like to thank the editorial office for responding quickly to my questions. It is an excellent journal. I plan to submit more manuscripts in the future. Best wishes from, Robert W. McGee

Dear Grace Pierce, Editorial Coordinator of Journal of Clinical Research and Reports, Working with you and your team on our recent publication in JCRR has been a truly wonderful and enjoyable experience. The responses were prompt, and the reviewers were patient, constructive, and highly professional. One reviewer in particular gave me the feeling that a professor was carefully reading and commenting on my coursework, which was deeply touching. The entire process was straightforward and hassle‑free, with no tedious online forms to complete. I highly recommend this journal. Best wishes from, DR Aibing Rao, Head of R&D

I Appreciate the Opportunity to Share my Experience with the Journal of Clinical Research and Reports. The peer review process was timely and constructive, and the feedback provided helped improve the quality of our manuscript. The editorial office was professional, responsive, and supportive throughout the process, ensuring smooth communication and efficient handling of the submission. Overall, it was a positive experience collaborating with your team.

Dear Mercy Grace, Editorial Coordinator of Obstetrics Gynecology and Reproductive Sciences, We would like to express our gratitude for your help at all stages of publishing and editing the article. The editors of the magazine answer all the necessary questions and help at every stage. We will definitely continue to cooperate and publish other works in the Obstetrics Gynecology and Reproductive Sciences! Best wishes from, Alla Konstantinovna Politova,
