
Research Article | DOI: https://doi.org/10.31579/2637-8914/093
* Institute of Health and Society, Faculty of Medicine, University of Oslo, Norway, Box 1130 Blindern, 0318 Oslo, Norway, Telephone: +47 22844629/Fax: +47 22850590.
*Corresponding Author: Arne Torbjørn Høstmark, Institute of Health and Society, Faculty of Medicine, University of Oslo, Norway, Box 1130 Blindern, 0318 Oslo, Norway.
Citation: Arne T Høstmark. (2022). Studies to Explain Further, why Percentages of Eicosanoid Precursor Fatty Acids Associate Positively in Chicken Muscle. J Nutrition and Food Processing. 5(2); DOI: 10.31579/2637-8914/093
Copyright: © 2022 Arne Torbjørn Høstmark, this is an open access article distributed under the Creative Commons Attribution License, which permits unrestricted use, distribution, and reproduction in any medium, provided the original work is properly cited.
Received: 15 March 2022 | Accepted: 23 March 2022 | Published: 05 April 2022
Keywords: fatty acids; eicosanoid precursors; relative amounts; correlation rules; ranges; chicken muscle
Background: Polyunsaturated fatty acids with 20 or 22 carbon atoms are precursors of eicosanoids and docosanoids, which are important regulatory molecules in cell physiology. In breast muscle of chickens, we recently reported that percentages of these precursors were positively associated. Subsequently, we observed that the concentration ranges of the fatty acids seemed to cause the positive associations, e.g. between %EPA (eicosapentaenoic acid, 20:5: n3) and %AA (arachidonic acid, 20:4 n6).
Aim: To explain further correlations between relative amounts of eicosanoid and docosanoid precursors.
Methods: Typically, the precursors had low numbers and low variability, as compared with the predominant fatty acids, such as oleic acid (18:1 c9). We first present considerations concerning associations in general between relative amounts of three positive scale variables, two of which (A, B) having narrow ranges relative to the third one (C). Next, we show results of computer experiments to test the reasoning.
Results and Discussions: We made S = A + B + C, i.e. %A + %B + %C = 100. %A correlated positively with %B, whereas %A (%B) related negatively to %C. The particular ranges of A, B, and C seemed to explain these associations. We found that slope of %A (abscissa) vs. %B approached B/A. Furthermore, slope of %A (abscissa) vs. %C approached –(1 +B/A), and that of %B (abscissa) vs. %C was near –(1+ A/B). We also show equations of regression lines concerning associations between A (B, C) percentages of S, when ranges of A and B are narrow relative to C. Finally, we compare slope values obtained by the formulas, and by linear regression.
Conclusions: We suggest that Intended Ranges of eicosanoid precursor fatty acids might have arisen through evolutionary selection, thereby causing Distribution Dependent Correlations, mathematically. Possibly, this selection could improve the balance between eicosanoids (docosanoids).
Definitions and Abbreviations:
Variability: the width or spread of a distribution, measured e.g. by the range and standard deviation.
Distribution: graph showing the frequency distribution of a variable within a particular range. In this article, we also use distribution when referring to a particular range, a – b, on the scale.
Uniform distribution: every value within the range is equally likely. In this article, we may write “Distributions of A, B, and C were a - b, c - d, and e - f, respectively”.
OA = Oleic Acid (18:1 c9); LA = Linoleic Acid (18:2 n6); ALA = Alpha Linolenic Acid (18:3 n3); AA = Arachidonic Acid (20:4 n6); EPA = EicosaPentaenoic Acid (20:5 n3); DPA = DocosaPentaenoic Acid (22:5 n3); DHA = Docosa Hexaenoic Acid (22:6 n3); DGLA= Dihomo Gamma Linolenic Acid (20:3 n6); EDA = Eicosa Dienoic Acid (20:2 n6); ETA = Eicosa Trienoic acid (20:3 n3).
This work relates to body fatty acids, which are major diet constituents, and important factors in health and disease; polyunsaturated fatty acids with 20 or 22 carbon atoms are precursors of eicosanoids and docosanoids, which are significant regulatory molecules in cell physiology [1, 3]. AA, EPA, DPA, DHA, and DGLA are examples of such precursor fatty acids. Most organs and cell types produce eicosanoids, as catalyzed by cyclooxygenases, lipoxygenases, and epoxygenases [3].
EPA and AA represent two of the eicosanoid precursors, and these fatty acids seem to be metabolic antagonists [1 - 5]. EPA derived eicosanoids may decrease inflammatory diseases [6, 7], and may have a positive influence on coronary heart diseases [8, 9], and cancer [10]. However, a Cochrane Review of selected studies questioned the beneficial effects of long-chain n-3 fatty acids on all- cause and cardiovascular mortality [11].
We might expect positive effects of EPA if the fatty acid works to counteract effects of AA. LA, which is a major constituent in many plant oils, is the precursor of AA [1]. Under the catalysis of cyclooxygenase and lipoxygenase in tissues, AA may be transformed into various eicosanoids, i.e. prostacyclin, thromboxane, and leukotrienes [1, 4, 5]. Thromboxane A2 (TXA2) and leukotriene B4 (LTB4), synthesized from AA, have strong proinflammatory and prothrombotic properties [1, 2, 10], and may cause allergy [12]. Thus, an antagonism between EPA and AA could possibly explain positive health effects of EPA. In line with this reasoning, a decreased EPA/AA ratio in serum seems to be a risk factor for cancer death [10].
Also, docosanoids, originating from C22 fatty acids (DPA, DHA), have strong metabolic effects. Among these latter compounds are protectins, resolvins, and maresins, which may strongly counteract immune- and inflammatory reactions [3, 13]. Also, eicosatrienoic acid, i.e. 20:3 n6 (dihomo-gammalinolenic acid, DGLA) may give eicosanoids [3]. To our knowledge, there are less data on eicosanoids derived from three other C20 fatty acids: the two eicosatrienoic acids 20:3 n3 and 20:3 n9 (Mead acid), and eicosadienoic acid (20:2 n6).
We should accordingly expect regulatory mechanisms ensuring a proper balance between the relative amounts of EPA and AA, and possibly between other eicosanoid (docosanoid) precursor fatty acids. One such mechanism could be that increased (decreased) relative amount of one of the precursor fatty acid would be accompanied by increased (decreased) percentages of many other precursors as well. In line with this reasoning, we previously reported strong positive correlations (Spearman’s rho > 0.7) between relative amounts of many eicosanoid precursors, in breast muscle of chickens [14, 15].
Previously, we observed in muscle tissue of chickens that eicosanoid and docosanoid precursor fatty acids had narrow ranges (low variability) relative to ranges of the predominant fatty acids such as OA and ALA; the potential precursors were EPA, AA, DGLA, DPA, DHA, EDA, and ETA [20].
In computer experiments, we here used random numbers in lieu of the fatty acids, as reported previously [14-20]. To mimic the situation with eicosanoids, we made two of the variables (A and B) with narrow ranges, and a third (C) with broad range. Thus, C would represent sum of the remaining fatty acids, when omitting A and B. We generated uniformly distributed random numbers with true ranges. The outcome was, however, qualitatively the same if using random numbers with normal distribution (results not shown). Thus, A + B + C = S, where S is sum of the variables. Furthermore, each of the variables, and accordingly S, would have particular ranges, i.e. varying S – values for each of e.g. 200 “cases”. We may express relative amounts of the variables as fractions, or percentages of S. The A-, B-, and C-fractions of S would be Af =A/S, Bf = B/S, and Cf = C/S. Hence, Af + Bf + Cf =1, or e.g. Bf = -Af + (1 - Cf). Alternatively, we may use percentages of S, i.e. %A = (A/S) ·100; %B = (B/S) ·100; and %C = (C/S) ·100. Thus, %A + %B + %C = 100, or e.g. %B = -%A + (100 - %C). These formulas show dependency between the fractions (percentages).
Previously, we reported correlation coefficients (Spearman’s rho), and scatterplots of e.g. %EPA (=”%A”) vs.
Associations between eicosanoid and docosanoid precursor fatty acids
We previously reported that relative amounts of EPA, AA, DGLA, DPA, DHA, EDA, and ETA correlated positively in chicken breast muscle [20]. Furthermore, we were able to reproduce the correlations, using random numbers in lieu of the true values, if the numbers had true ranges of the precursor fatty acids. Below, we try to clarify linearity and slope of associations between the precursor percentages.
Associations between A (B, C) ranges and A (B, C) fractions of S
If S = A + B + C, we previously [14 - 21] utilized the equation of a straight line (y = ax + b), to explain correlations between %A, %B, and %C. Additionally, we considered the relationship between S and A (B, C) fractions of S. Below, we extend these analyses, focusing upon how ranges of the variables relate to the A (B, C) fractions (percentages) of S.
We define S to be the sum of three positive scale variables (A, B, C), making %A + %B + %C = 100. With ranges of the variables included (in parentheses), the equation would be:%A(p-q) + %B(r-s) +%C(t-u) =100, or %B(r-s)= - %A(p-q) +(100 - %C(t-u)
For simplicity in the presentation, below we omit indication of ranges, and mostly use A (B, C) fractions instead of percentages. Thus, Af + Bf + Cf =1. The A-fraction of S is Af = A/(A + B + C) = 1/[1 + (B + C)/A]. Similarly, the B fractions of S is Bf = B/(A + B + C) = 1/[1 + (A + C)/B], and the C-fraction is Cf = C/(A + B + C) = 1/[1 + (A + B)/C]. We see that the three fractions of S have similar structures, and that three ratios govern the fractions, i.e. R1 = (B + C)/A; R2 = (A + C)/B, and R3 = (A + B)/C, respectively. Thus, sum of two of the variables makes the numerators of the three ratios, and the remaining one is the denominator.
Furthermore, each of the fractions Af = 1/[1 + (B + C)/A]; Bf = 1/[1 + (A + C)/B]; and Cf = 1/[1 + (A + B)/C] should decrease as the numerators of R1 (R2, R3) increase, and increase as the denominators increase.
Since these fractions are functions of three variables, each of which with particular ranges, it could in general be hard to predict the combined influence of A, B, and C upon each of the fractions. However, in some situations we might predict how the fractions should respond as A (B, C) goes from lowest to highest value within the range. Below, we present one of these conditions, presumably relating to ranges of eicosanoid (docosanoid) precursor fatty acids (vide infra). We previously reported that ranges of these fatty acids were narrow relative to the large-amount fatty acids, e.g. OA and ALA, as observed in chicken muscle [19,20].
When reasoning about associations between ranges and A (B, C) fractions, a crucial point would be to clarify whether there is a main variable, and how each of the fractions should relate to this variable. As discussed below, we suggest that the main variable should have broad range relative to ranges of the other variables. Furthermore, we would expect positive (negative) associations between fractions (percentages) of two of the three variables, if their relative amounts relate similarly (in opposite directions) to the main variable.
Mimicking ranges of eicosanoid precursors: Two of three variables (A, B) having narrow ranges relative to a third one (C)
We previously encountered variables in physiology with narrow ranges of some variables relative to others [14-26]. For example, in chicken breast muscle, the concentration of fatty acids that are precursors of eicosanoids (docosanoids) had narrow ranges as compared with other fatty acids [20]; the former ones had coefficients of variation about 10%, against 40 to 60% for other fatty acids.
Very narrow range of a variable would make this variable approaching a fixed number. Thus, with two of three variables approaching constants, we have one main variable only, implying that all fractions would depend mainly on this variable. To elucidate direction and strength of associations between fractions in this case, we start studying associations between fractions when two (A, B) of three variables are constants, and the third (C) has broad range. Below, we reason about linearity, slope, and equation concerning these associations.
LINEARITY and SLOPE of Af (abscissa) vs. Bf when ranges of A and B are very narrow relative to the C-range
To clarify the association between Af and Bf in this case, we consider Af = 1/(1 + B/A + C/A), and Bf = 1/( 1 + A/B + C/B). Since A and B are close to constants, we may simplify to Af = 1/(k + C/A), and Bf = 1/( t + C/B), where k = 1 + B/A, and t = 1 + A/B. Accordingly, both fractions should decrease as C increases, implying that Af should correlate positively with Bf. Since Af and Bf depend mainly on C, we make C the abscissa variable when plotting C vs. Af (Bf).
We next raise the question of whether the Af vs. Bf association is linear in this particular case. If so, we should find a constant slope estimate, i.e. ΔY/ΔX. When computing slope estimates of associations between e.g. Af and Bf, it is crucial to know which one is the abscissa and the ordinate. Below, we clarify by writing Af (abscissa) vs. Bf, Af (abscissa) vs. Cf, and Bf (abscissa) vs. Cf.
To investigate linearity (slope) of the Af (abscissa) vs. Bf association, we raise the question of what happens to Bf (= Y), as Af (= X) increases, realizing that X as well as Y are mainly functions of C. For simplicity, we first consider A and B to be constants. If there is a linear relationship between X and Y, the equation of a straight line (y = ax + b) should apply. Thus, we should expect ΔY/ΔX = (Y2 – Y1)/(X2 – X1) to be constant. Thus, we find the C value (C1) corresponding to X1 and Y1. X1 = A/(A + B + C1); i.e. C1 = (A – AX1 – BX1)/X1. We next compute C2 (corresponding to X2 and Y2) by adding ΔX to X1. To simplify the presentation, below we use ΔX = 1, however obtaining the same result if using just ΔX (not shown). Hence, X1 +1 = A/(A + B + C2), giving C2 = (- B – AX1 – BX1)/(X1 + 1).
To find ΔY, we use C1 and C2, and compute Y1 and Y2. Thus, Y1 = B/(A+B+C1); i.e.
Y1 = X1·B/A. Similarly, Y2 =B/(A + B + C2); i.e.Y2 = (X1 + 1)·B/A. Accordingly, ΔY = Y2 - Y1 = (X1 + 1)·B/A – X1·B/A = B/A, which is the change in Y per one-unit increase in X1, i.e. ΔY/ΔX = (B/A)/1= B/A. Thus, there should be a linear, positive association between Af (%A=abscissa) and Bf (%B), the slope being estimated by ΔY/ΔX = B/A.
LINEARITY and SLOPE of Af (abscissa) vs. Cf, when ranges of A and B are very narrow relative to the C- range
If there is a linear relationship between Af (=X) and Cf (=Y), the equation of a straight line (y = ax + b) should apply to the relationship. Thus, we should find a constant slope value equal to ΔY/ΔX = (Y2 – Y1) /(X2 –X1). We accordingly need to find what happens to ΔY when increasing X1 by ΔX, e.g. by one unit. Realizing that C governs both X and Y, we first find the C-values (C1,C2) that correspond to X1 and X2 = X1 +1. Below, we use A and B to denote the near to constant values of A and B.
Finding C1 and C2: By definition, X1 = A/(A + B + C1), i.e. C1 = ( A – AX1 – BX1)/X1. To find C2, we add one X-unit to X1. Thus, (X1 + 1) = X1/(A + B + C2), i.e. C2 = (- B – AX1 – BX1)/(X1 + 1).
Computing Y1 and Y2: We use the above expressions of C1 and C2 to find the Y- values (Y1 and Y2) corresponding to X1 and X2. Thus, Y1 = C1/(A + B + C1);i.e. Y1 = [(A – AX1 – BX1)/X1]/[A + B +(A – AX1 – BX1)/X1]. Simplifying this expression, we obtain
Y1 = (A – AX1 – BX1)/A.
To find Y2, we use C2, i.e. Y2 = C2/(A + B + C2). Inserting the expression above, in lieu of C2, we obtain: Y2 = [(- B – AX1 – BX1)/(X1 + 1)]/[ A + B + (- B – AX1 – BX1)/(X1 + 1)]. Simplifying this expression, we obtain Y2 = (-B –AX1 – BX1)/A.
Accordingly, ΔY = Y2 – Y1 = (-B – AX1 – BX1)/A – (A – AX1 – BX1)/A = (-B – A)/A, i.e. ΔY = – (1 + B/A), which is the change in Y corresponding to a one-unit increase in X, i.e. ΔY/ΔX = – (1 + B/A)/1 = – (1 + B/A). Thus, Af ( %A =(abscissa) should have a negative, linear relationship to CF (%C), with slope = ΔY/ΔX = – (1 + B/A).
LINEARITY and SLOPE of Bf (abscissa) vs. Cf when ranges of A and B are very narrow
Using the approach above, we find that Bf (abscissa) should have a negative, linear association with Cf, the slope being estimated by ΔY/ΔX = – (1 + A/B).
Thus, if A, as well as B have very narrow ranges relative to C, then we have three slope estimates for the linear associations between relative amounts of A (B, C). 1) B/A estimates slope of %A(abscissa) vs. %B; 2) – (1 + B/A) estimates slope of %A (abscissa) vs. %C; and 3) – (1 + A/B) estimates slope of %B (abscissa) vs. %C.
We suggest that the slope estimates found above should apply also to conditions where the ranges of A and B are somewhat broadened. However, since we then would violate the requirement of having near constant values of A and B (relative to C), the scatterplots – and correlation coefficients - should be poorer, and the slope estimates should not work well, especially if increasing the A and/or B ranges appreciably (vide infra).
Suggested general rule, pertaining unit systems consisting of three positive scale variables (A, B, C, with S = A + B + C), where A and B have very narrow ranges relative to C:
%A (abscissa) should have a positive, linear association with %B, with slope approaching B/A. Furthermore, %A (abscissa) should have a negative, linear association with %C, with slope approaching – (1 + B/A), and %B (abscissa) should relate linearly and negatively to %C, with slope approaching – (1 + A/B).
If using these formulas, we emphasize that A and B must be the two close-to-constant variables, and C the broad-range variable. The crucial point is to define the abscissa variable correctly.
Finding EQUATION of the positive, linear Af (abscissa) vs. Bf association when ranges of A and B are very narrow relative to the C-range
We next try to find the complete equation of the relationship between relative amounts of A and B, knowing that the formula of a straight line (y = ax + b) should apply. Above, we computed the slope value to approach B/A, if A and B have very narrow ranges relative to C. Thus, if Y = Bf and X = Af, we have Y = (B/A)·X + b. To find b, we use corresponding values of X and Y, e.g. their maximum or minimum values. Thus,
b = Ymin – (B/A) · Xmin, and b = Ymax – (B/A) · Xmax. Accordingly, equation of the linear, positive X (Af) vs. Y (Bf) association should be:
Y = (B/A)·X +Ymin – (B/A) · Xmin , or Y = (B/A)·X +Ymax – (B/A) · Xmax
Example: A = 1, B = 2, C 1-10. We first use minimum and maximum values of X (= Af) and Y (= Bf). Thus, Y = B/(A + B + C) = 1/[1 +(A + C)/B]; Ymin = 1/[1 +(A + Cmax)/B], i.e. Ymin = 1/[1 +(1 + 10)/2] =1/6.5 = 0.154 (15.4%).
Similarly, X (=Af) = A/(A + B + C) = 1/[1 +(B + C)/A]. Thus, Xmin = 1/[1 +(2 + 10)/1] = 0.077 (7.7%). Inserting the actual numbers into Y = (B/A)·X +Ymin – (B/A) · Xmin, we obtain Y = (2/1)·X + 0.154 – (2/1)·0.077 = 0, i.e. Y = 2X. Thus, Bf = 2Af, or %B = 2·%A
We obtain the same result if using maximum values of X and Y to compute b. Thus,
Ymax = 1/[1+ (A +Cmin)/B] = 1/[1 +(1+1)/2] = 0.5. Similarly, X =Af = A/(A + B + C) = 1/[1 +(B + Cmin)/A). Xmax = 1/[1 + (2 + 1)/1] = 0.25. Using the equation above, i.e.
Y = Af = (B/A)·X + Ymax – (B/A) · Xmax, we obtain Y = (2/1) ·X + 0.5 – 2·0.25= 2X. Thus, Y = 2X, which may be written Bf =2Af, or %B = 2·%A.
Thus, in this particular case, Af vs. Bf shows a straight line with slope = 2. The extrapolated line should pass through (X, Y = 0, 0).
Finding EQUATION of the linear, negative Af (abscissa) vs. Cf association
As shown above, there should be a linear, negative association between Cf and Af (Bf). We define Cf = Y, and Af = X. Applying the equation of a straight line (y = ax + b), and the slope expression computed above, we have Y = - (1 + B/A)·X + b. We find b using corresponding values of X and Y, e.g. their maximum (minimum) values. Since there is an inverse relationship between X and Y, Ymax corresponds to Xmin,
Thus, Ymax = -(1 + B/A)·Xmin + b , and Ymin = -(1 + B/A)·Xmax + b. We compute
b = Ymax + (1 + B/A)·Xmin. Inserting this b-value into Y = - (1 + B/A)·X + b, we obtain
Y = - (1 + B/A)·X + Ymax + (1 + B/A)·Xmin
We next need to find Ymax and Xmin. By definition, Cf (i.e. Y) = C/(A+ B + C) = 1/[ 1 + (A + B)/C]. Using numbers of the example above, i.e. A = 1; B = 2.0; C 1- 10, we obtain Ymax = 1/[1 + (1 + 2)/10] = 1/1.3 = 0.77. Similarly, Af (i.e. X) = A/(A + B + C) = 1/[1 + (B + C)/A]. Thus, Xmin = 1/[1 + (2 + 10)/1] = 0.077. The equation of X vs. Y in this case should be Y = -(1 +2/1)·X + 0.77 + (1 + 2/1)·0.077 = 1, i.e. Y = -3X + 1.
Accordingly, the inverse, linear association between X (Af ) and Y (Cf) should be Y = -3X + 1.00 . Since Y = Cf, and X = Af , we may write Cf = -3Af + 1.00 , or %C = -3·%A + 100.
Alternatively, we could use Ymin = -(1 + B/A)·Xmax + b, i.e. b = Ymin +(1 + B/A)·Xmax Hence, the alternative, general formula would be
Y = - (1 + B/A)·X + Ymin + (1 + B/A)·Xmax
Finding Ymin and Xmax: Cf (i.e. Y) = C/(A+ B + C) = 1/[ 1 + (A + B)/C . Thus, Ymin= 1/[1 + (1 + 2)/1] = 0.25. Af (i.e. X) = A/(A + B + C) = 1/[1 + (B + C)/A], i.e. Xmax = 1/[1 + (2 + 1)/1] = 0.25. We insert the numbers into the general formula, i.e. Y = - (1 + 2/1)·X + 0.25 + (1 + 2/1)·0.25, i.e. Y = -3X + 1. Thus, the equation of the negative Af vs. Cf association should be Cf = -3·Af + 1.00 (or %C = -3·%A + 100).
Finding EQUATION of the linear, negative Bf (abscissa) vs. Cf association
The general equation is Y = - (1 + A/B)·X + b, where Y = Cf and X = Bf. We find b using corresponding values of X and Y, e.g. their maximum (minimum) values. Since there is an inverse relationship between X and Y, Ymax corresponds to Xmin.
Using the slope value found above, we have Ymax = -(1 + A/B)·Xmin + b , and Ymin = -(1 + A/B)·Xmax + b. We next compute b =Ymax + (1 + A/B)·Xmin = Ymax + (1 + A/B)·Xmin . Accordingly, the general formula would be
Y = - (1 + A/B)·X + Ymax + (1 + A/B)·Xmin
We may alternatively use Xmax and Ymin, giving the equation
Y = - (1 + A/B)·X + Ymin + (1 + A/B)·Xmax
With the example above, i.e. A = 1; B = 2.0; C 1- 10, we find max (min) value of Cf (=Y), and min (max) value of Bf (=X). Since Cf = C/(A + B + C) = 1/[1 + (A + B)/C], Cfmax = 1/[1 + (1 + 2)/10] =0.77, and Cfmin = 1/[1 + (1 + 2)/1] =0.25.
Similarly, Bf = B/(A + B + C) = 1/[1 + (A + C)/B]; Bfmin = 1/[1 + (1 + 10)/2] = 1/6.5 = 0.154, and Bfmax =1/[1 + (1 + 1)/2] = 0.5.
Thus, Cf = - (1 + A/B)·Bf + Cfmax + (1 + A/B)·Bfmin = -1.5·Bf + 0.77 + 1.5·0.154, i.e. Cf = -1.5Bf + 1.00, or %C = -1.5·%B + 100.
Alternatively, we may compute Cf = -1.5·Bf + 0.25 + 1.5·0.5, i.e. Cf = -1.5Bf + 1.00.
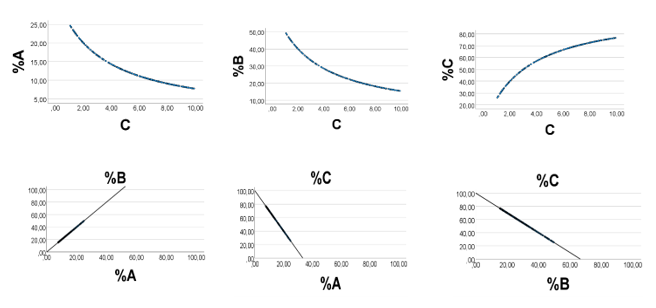
Computer Test: With A = 1; B = 2.0; C 1- 10, the A (B, C) - fractions of S are Af = 1/(3 + C); Bf = 2/(3 +C); and Cf =C/(3 + C)= 1/(1 +3/C). Thus, C is the only variable; Af and Bf should decrease as C runs from lowest to highest value, whereas Cf should increase (Fig. 1, upper panels). Accordingly, we should expect a strong positive association The outcome was as expected (Fig. 1, lower panels). There was a perfect positive association (rho = 1.000, p<0 n =200), xss=removed xss=removed n =200.>%C = -3·%A + 100, and %C = -1.5·%B + 100. We previously explained the curvilinear associations, shown in the top panels [21].
This work deals with computer experiments. To evaluate the suggested concepts of Intended Ranges and Distribution Dependent Correlations, we need diet trials in various species, including man.
The present study explains in more detail the strong correlations between eicosanoid (docosanoid) precursor fatty acid percentages in chicken muscle. In particular, our results explain why the associations should be positive and linear. Thus, if A, as well as B represent two of the precursor fatty acids, and C the remaining ones, we have A + B + C = S. Then, slope of %A (abscissa) vs. %B would approach B/A. Furthermore, slope of %A (abscissa) vs. %C would be near –(1+B/A), and slope of %B (abscissa) vs. %C would be close to –(1+A/B).
The study supports the idea that Intended Ranges could make Distribution Dependent Correlations, mathematically. We suggest that such ranges might have arisen through evolutionary selection. Possibly, eicosanoid and docosanoid precursor fatty acids in chicken breast muscle are examples of intended ranges, which would make their relative amounts correlate positively.
None.
Dear Editorial Team, Clinical Medical Reviews and Reports. My experience with the journal was highly positive. The peer-review process was rigorous, constructive, and completed in a timely manner. The reviewers provided valuable comments that helped improve the quality and clarity of our manuscript. The editorial office was professional, responsive, and supportive throughout all stages of the publication process. Communication was clear and efficient, and any questions were addressed promptly. Overall, I found the journal to maintain high scientific standards and an excellent publication workflow. I would be pleased to consider submitting future work to this journal. Best wishes from, Elena Popa.

It was my pleasure to submit my testimonial concerning the Reviewer Board of our Scientific Journal “Brain and Neurological Disorders”. The Reviewers focused on some modifications and their contribution was helpful. The ladies of our Editorial Office were also supported my efforts. It was my honor to have such a co-operation and I am looking forward for more collaboration.

Dear Grace Pierce, Editorial Coordinator of Journal of Clinical Research and Reports, Thank you for the speedy and efficient peer review process. I appreciate the fact that your peer reviewers do not take months to respond like with some other journals. I would also like to thank the editorial office for responding quickly to my questions. It is an excellent journal. I plan to submit more manuscripts in the future. Best wishes from, Robert W. McGee

Dear Grace Pierce, Editorial Coordinator of Journal of Clinical Research and Reports, Working with you and your team on our recent publication in JCRR has been a truly wonderful and enjoyable experience. The responses were prompt, and the reviewers were patient, constructive, and highly professional. One reviewer in particular gave me the feeling that a professor was carefully reading and commenting on my coursework, which was deeply touching. The entire process was straightforward and hassle‑free, with no tedious online forms to complete. I highly recommend this journal. Best wishes from, DR Aibing Rao, Head of R&D

I Appreciate the Opportunity to Share my Experience with the Journal of Clinical Research and Reports. The peer review process was timely and constructive, and the feedback provided helped improve the quality of our manuscript. The editorial office was professional, responsive, and supportive throughout the process, ensuring smooth communication and efficient handling of the submission. Overall, it was a positive experience collaborating with your team.

Dear Mercy Grace, Editorial Coordinator of Obstetrics Gynecology and Reproductive Sciences, We would like to express our gratitude for your help at all stages of publishing and editing the article. The editors of the magazine answer all the necessary questions and help at every stage. We will definitely continue to cooperate and publish other works in the Obstetrics Gynecology and Reproductive Sciences! Best wishes from, Alla Konstantinovna Politova,
