
Research Article | DOI: https://doi.org/10.31579/2637-8914/260
Department of Food Science Department Bowen University Iwo.
*Corresponding Author: Eniola Jayeola, Department of Food Science Department Bowen University Iwo.
Citation: Jayeola Eniola and Olunlade B.A, (2024), Production of Bread from Composites of Wheat, Maize, and Soybeans Flours, J. Nutrition and Food Processing, 7(12); DOI:10.31579/2637-8914/260
Copyright: © 2024, Eniola Jayeola. This is an open access article distributed under the Creative Commons Attribution License, which permits unrestricted use, distribution, and reproduction in any medium, provided the original work is properly cited.
Received: 23 August 2024 | Accepted: 05 September 2024 | Published: 23 September 2024
Keywords: bread; composite flour; wheat; maize; soybeans
Bread consumption prepared from solely wheat flour have remained popular in Nigeria. The low protein and fiber content of wheat flour and its associated high cost are the major concerns in its utilization as ingredient in bakery industries.
The use of wheat flour, maize flour and soybeans flour blends in varying proportions for the production of bread was studied. Wheat flour was substituted with maize and soybeans flour in ratios 9:5:5, 8:15:5, 8:10:10, 8:5:15, 7:25:5, 7:20:10, 7:15:15, 7:10:20 while wheat flour bread served as control. The different bread samples were produced and subsequently were analyzed for functional properties, proximate compositions, physical parameters, sensory evaluation, pasting properties and shelf-life studies. The crude protein of the composite bread samples ranged from 8.75% to 29.17%. Sensory properties of the composite bread were significantly (p< 0.05) affected by blending ratio.
(T6) had the highest value compared to other treatments, while (T5 and T8) had the least value and are not significantly different from each other. However, there was significance difference (P≤0.05) among the entire treatments. The bread with blend 70% wheat flour, 20% maize flour and 10% soybean flour was organoleptically preferred as much as that of whole wheat flour and it also has the highest protein value of 29.17%when compared with bread from other treatment. The shelf life study also indicated that all the bread samples can be stored for 5 days before the onset of mould growth.
Bread is an important staple food and the most widely consumed bakery product (Aini and Maimon, 1996). It constitutes one of the most important sources of nutrients such as carbohydrates, protein, fiber, vitamins and minerals in the diets of many people worldwide.
Bread is a fermented confectionary product produced mainly from white wheat flour, water, yeast and salt by a series of processes involving mixing, kneading, proofing, shaping and baking (Dewettinck et al., 2008).
Wheat flour for bread has starches and functional protein glutens that favor the processing of leavened aerated bread, but is limited in fat and balanced amino acids (Goesaert et al., 2005).
Maize nutritionally is superior to others cereals in many ways, except in protein value. Maize has high nutrients profile. It is rich in carbohydrates which are a good source of energy, fats, fibers, phosphorous, sodium, sulfur, riboflavin, amino acids, minerals, calcium, iron, potassium, thiamine, vitamin-C, magnesium and copper as well as ashes are present in the maize kernels (Breadley, 1992). These nutrients make the maize high profile nutrients.
Soybeans are high in protein and a decent source of both carbohydrates and fat. They are a rich source of various vitamins, minerals, and beneficial plant compounds, such as isoflavones. Soybean is rich in high quality proteins with balanced amino acids, lipids, minerals and bioactive compounds but is limited in starches (Garg, Lule, Malik, &Tomar, 2016). The protein content of soybean is about 2 times of other pulses, 4 times of wheat, 6 times of rice grain, 4 times of egg and 12 times of milk. It is also rich in calcium, phosphorous, isoflavones and Vitamins A, B, C and D, and it has been referred to as “the protein hope of the future” (Islam et al. 2007). Soybean protein is rich in valuable amino acid lysine (5%), which is deficient in most of the cereals. Hence, soybean is the richest in food value of all plant foods consumed in the world (Bolarinwa, 2016).
The use of composite flour has been identified by researchers as a possible avenue of producing high-quality nutritious food products, reduced celiac diseases and a means of reducing the huge amount of foreign exchange spent by Nigeria in the importation of wheat flour (Vaugha et al., 2014). One method to alleviate the shortage of wheat flour, increase the nutritional quality and bioactive contents of the bread is to use composite flours prepared from different crops like protein rich legumes, tubers rich in starches and/or other cereal grain flours (Nwanekezi, 2013).
Since bread comprised of a significant proportion of wheat flour products, fortification of flour used for their production presents an opportunity to improve nutrient intake among bread consumers, particularly given the increasing demand for bread, hence this study will utilize incorporation of maize and soybeans into wheat flour for the fortification of a nutrient dense, palatable, affordable and shelf stable bread from locally available raw materials. The fortified bread will be of a balanced diet for all categories of consumers.
The raw materials used were wheat flour, maize, soybeans, butter, yeast, sugar and salt.
Golden penny’ brand of wheat flour produced by Flour Mill of Nigeria Plc. was purchased from a licensed marketer in Iwo, Osun State Iwo,
Maize grain, soybeans, and other ingredients were obtained from a supermarket in Iwo Osun State
Flour Preparation
Wheat flour
This was bought in an open market
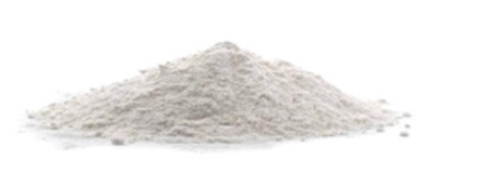
Wheat flour (Plate 1) is a key ingredient in baking products. Wheat flour is unique among cereals because when mixed with water, it forms a visco-elastic dough.

Maize flour (Plate 2) is gluten-free and cannot be used to make rising breads on its own
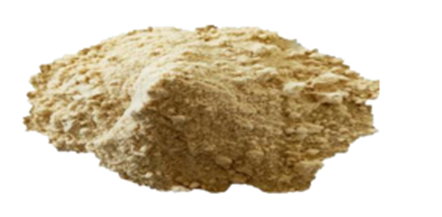
Soy flour (Plate 3) is made by milling processed soybeans
Production of maize flour
The production of maize flour as described by Houssou and Ayemor (2002).
Water was sprinkled on cleaned maize seeds so as to allow absorption of water by the grains, toughening the pericarp and germ so they do not splinter during milling. The grains were left for about 10 min before dehulling and milling. The flour was sieved using 250 μm mesh size
Production of soybeans flour
The seeds were cleaned by removing dirt and other foreign materials before being soaked in water for about 8 hours. The soaked beans were dehulled and dried in an oven at 80oC for 8 hr. The dried soybeans were allowed to cool, milled and sieved with a 250 μm mesh
Formulation of recipe
The recipe formulation for the wheat, maize and soybeans flour incorporated bread
| T1 | T2 | T3 | T4 | T5 | T6 | T7 | T8 | |
Wheat flour | 90.0g | 80.0g | 80.0g | 80.0g | 70.0g | 70.0g | 70.0g | 70.0g |
Maize flour | 5.0g | 15.0g | 10.0g | 5.0g | 25.0g | 20.0g | 15.0g | 10.0g |
Soybea ns flour | 5.0g | 5.0g | 10.0g | 15.0g | 5.0g | 10.0g | 15.0g | 20.0g |
| Fat | 4.0g | 4.0g | 4.0g | 4.0g | 4.0g | 4.0g | 4.0g | 4.0g |
| Sugar | 5.0g | 5.0g | 5.0g | 5.0g | 5.0g | 5.0g | 5.0g | 5.0g |
| Yeast | 2.0g | 2.0g | 2.0g | 2.0g | 2.0g | 2.0g | 2.0g | 2.0g |
| Salt | 2.0g | 2.0g | 2.0g | 2.0g | 2.0g | 2.0g | 2.0g | 2.0g |
| Water | 62.0ml | 62.0ml | 62.0ml | 62.0ml | 62.0ml | 62.0ml | 62.0ml | 62.0ml |
Table 1. Recipe formulation for bread
Production of composite bread
The straight dough method was used to produce the bread. This method involves the addition of all the ingredients (flour, salt, water, sugar, yeast etc.) at mixing stage and kneading same to obtain the dough. The different dough samples were placed in baking pans smeared with vegetable oil and was covered for the dough to ferment resulting in gas production and gluten development for about 3 hour. The dough was then baked in the oven at 2200C for 30 minutes. The baked loaves were carefully removed from the pans and allowed to cool and packaged in polyethylene bags for analysis.
Plate 4: Composition of different bread blends
Determination of physical properties of bread loaves
The physical characteristics of the breads investigated included height, breadth, weight, length, and specific volume were determined according to the method described by Ceserani et al. (1995). The height, breadth and length were measured by a metal rule. The weight was determined using a weighing balance. Specific volume was determined using the formula below.
Thus, Specific volume (cm3 /g) = HxBxL W Where L = Bread length
B = bread breadth H = bread height W = bread weight.
Determination of functional properties
The bulk density of flour was determined as described by (Ojinnaka et al., 2013). Ten grams of each flour sample was measured into a clean 100 ml graduated measuring cylinder. It was taped repeatedly on a padded table until constant volume of flour was obtained. This was express as weight of flour per its constant volume.
The proximate composition of the bread samples was estimated using AOAC 2012. Moisture, pH, Protein, Fat, Ash, Crude fibre were determined using (A.O.A.C 2012)
Sensory evaluation
Bread loaves were cut into slices of uniform thickness and transferred onto white coloured plates coded with random 3-digit codes. A sensory panel consisting of 25 semi-trained students at Bowen University and familiar with sensory attributes of local bread was employed to evaluate the products. A 5-point Hedonic scale was used to rate the breads for crumb appearance, colour, taste, texture, flavour and overall acceptability. A score of 1 represented “dislike extremely” and a score of 5 represented “like extremely”. An atmosphere of complete quietness and privacy was provided for each panelist.
Statistical Package for Social Sciences (SPSS) version 26.0 computer was used to analyze the data. Means was used to analyze the continuous variables and standard deviations were calculated to show the statistical variability. Descriptive statistics was performed and the generated means were compared using the least significant (P<0>
| Treatment | Bulk density (g/ ml) | Dispersibility (%) | Water absorption capacity (%) |
| T1 | 0.53±0.00d | 73.33±0.57bc | 2.52±0.23bc |
| T2 | 0.56±0.03c | 75.00±0.00a | 2.80±0.00a |
| T3 | 0.57±0.01c | 72.00±1.00d | 2.61±0.12ab |
| T4 | 0.50±0.00e | 72.00±0.00d | 2.13±0.24de |
| T5 | 0.61±0.02b | 73.33±0.57bc | 2.33±0.02cd |
| T6 | 0.57±0.01c | 74.33±0.57ab | 2.29±0.03cd |
| T7 | 0.63±0.00b | 72.33±0.57cd | 2.47±0.14bc |
| T8 | 0.53±0.00d | 73.33±0.57bc | 2.03±0.11e |
Values with different superscripts within the same column are significantly different (p≤0.05) using Duncans mean separation method.
T1: 90% Wheat flour + 5% Maize flour + 5%Soybeans flour
T2: 80% Wheat flour + 15% Maize flour + 5%Soybeans flour
T3: 80% Wheat flour + 10% Maize flour + 10%Soybeans flour
T4: 80%Wheat flour + 5% Maize flour + 15%Soybeans flour
T5: 70% Wheat flour + 25% Maize flour + 5%Soybeans flour
T6: 70% Wheat flour + 20% Maize flour + 10%Soybeans flour
T7: 70% Wheat flour + 15% Maize flour + 15% Soybeans flour
T8: 70% Wheat flour + 10% Maize flour + 20%Soybeans flour
Table 2: Functional properties of flour blends
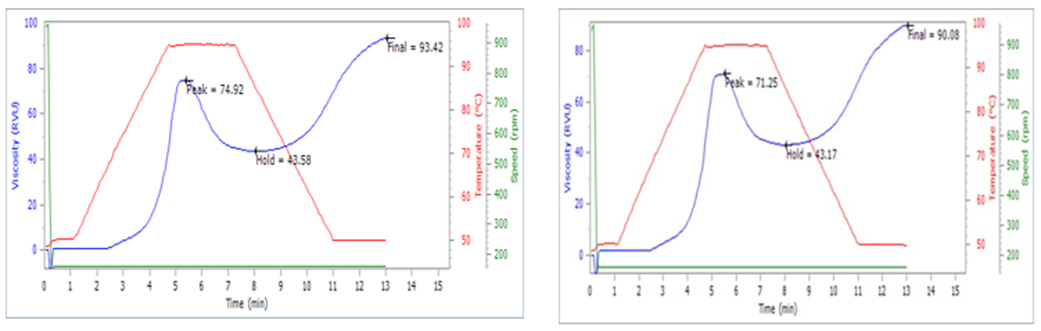
Figure 2: Influence of heating time on the viscosity of sample T2 (80% Wheat flour + 15% Maize flour + 5%Soybeans flour).
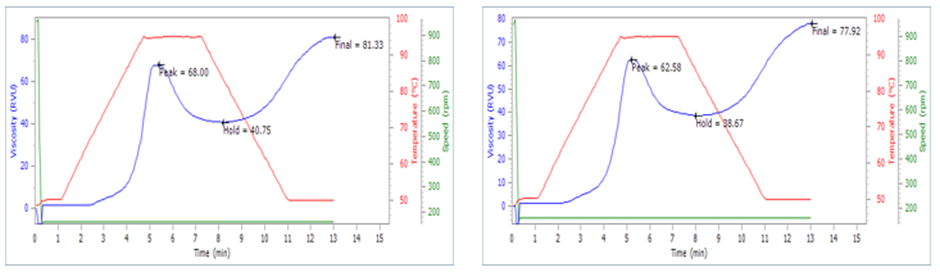
Figure 3: Influence of heating time on the viscosity of sample T3 (80% Wheat flour + 10% Maize flour + 10%Soybeans flour).
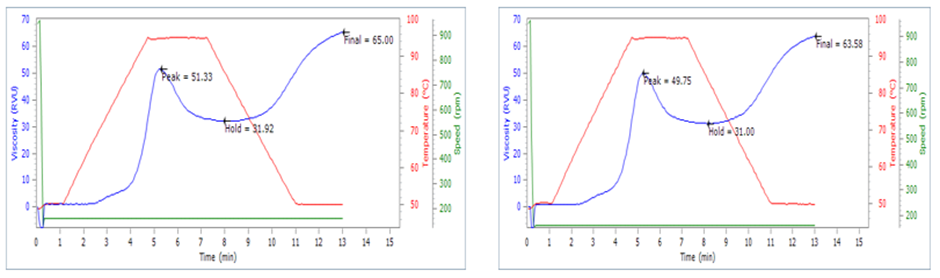
Figure 4: Influence of heating time on the viscosity of sample T4 (80%Wheat flour + 5% Maize flour+ 15%Soybeans flour).
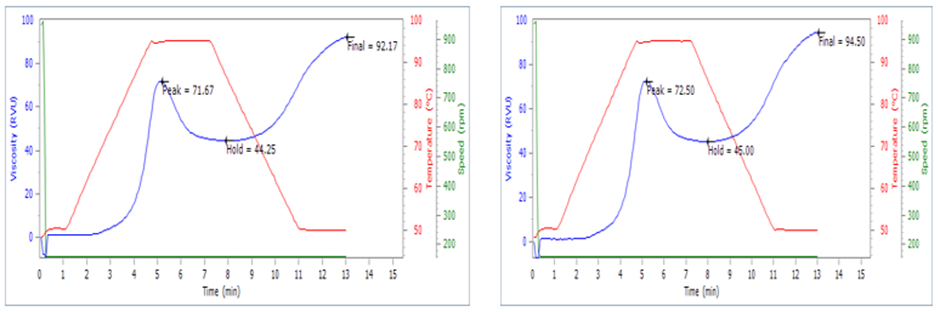
Figure 5: Influence of heating time on the viscosity of sample T5 (70% Wheat flour + 25% Maize flour + 5%Soybeans flour).
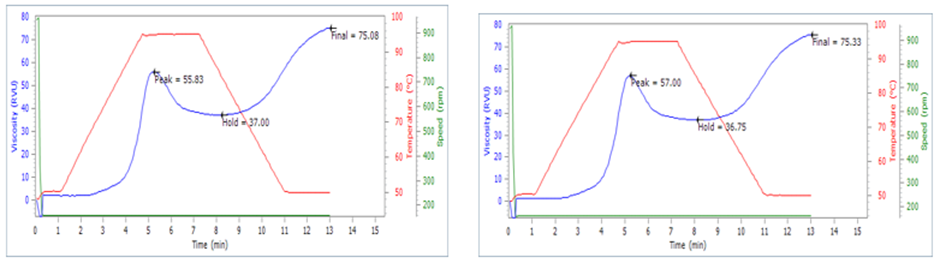
Figure 6: Influence of heating time on the viscosity of sample T6 (70% Wheat flour + 20% Maize flour + 10%Soybeans flour).
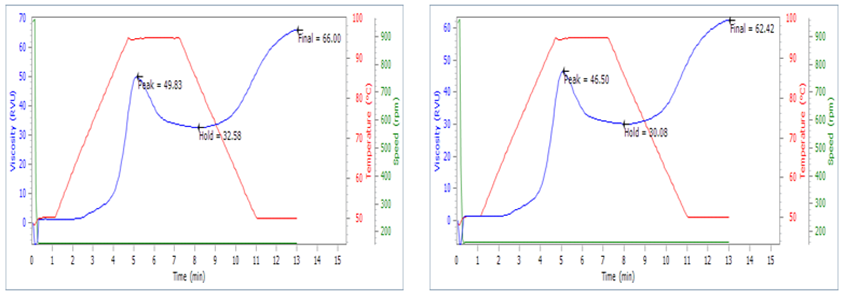
Figure 7: Influence of heating time on the viscosity of sample T7 (70% Wheat flour + 15% Maize flour + 15% Soybeans flour).
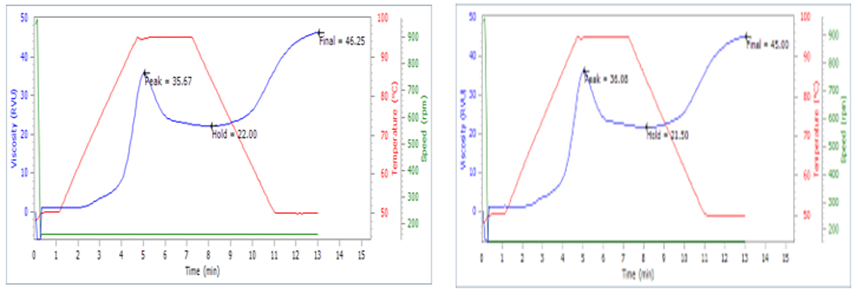
Figure 8: Influence of heating time on the viscosity of sample T8 (70% Wheat flour + 10% Maize flour + 20%Soybeans flour).
| Treatment | Length(cm) | Breadth(cm) | Height(cm) | Weight(g) | Specific volume(cm3/g) |
| T1 | 14.36±0.15bc | 9.66±0.57ab | 4.26±0.25b | 258.33±2.08c | 2.29±0.19ab |
| T2 | 14.00±0.20c | 9.73±0.11ab | 4.23±0.20b | 233.33±1.52e | 2.47±0.17a |
| T3 | 13.23±0.251d | 9.43±0.20b | 5.00±0.26a | 247.33±1.15d | 2.52±0.21a |
| T4 | 14.16±0.76bc | 10.06±0.25a | 5.03±0.15a | 273.66±2.51b | 2.62±0.24a |
| T5 | 14.63±0.11b | 9.56±0.30ab | 3.46±0.25c | 291.33±1.52a | 1.67±0.11c |
| T6 | 15.46±0.25a | 9.60±0.30ab | 3.43±0.15c | 292.66±2.51a | 1.74±0.12c |
| T7 | 15.53±0.15a | 9.60±0.34ab | 4.23±0.25b | 293.00±5.29a | 2.15±0.15b |
| T8 | 14.70±0.10b | 9.53±0.15ab | 4.20±0.17b | 234.66±4.16e | 2.50±0.11a |
Values with different superscripts within the same column are significantly different (p≤0.05) using Duncans mean separation method.
T1: 90% Wheat flour + 5% Maize flour + 5%Soybeans flour
T2: 80% Wheat flour + 15% Maize flour + 5%Soybeans flour
T3: 80% Wheat flour + 10% Maize flour + 10%Soybeans flour
T4: 80%Wheat flour + 5% Maize flour + 15%Soybeans flour
T5: 70% Wheat flour + 25% Maize flour + 5%Soybeans flour
T6: 70% Wheat flour + 20% Maize flour + 10%Soybeans flour
T7: 70% Wheat flour + 15% Maize flour + 15% Soybeans flour
T8: 70% Wheat flour + 10% Maize flour + 20%Soybeans flour 110
(T4) has the highest level of Specific volume which was not significant different from sample (T4, T3 and T8). (T5) shows the lowest level of specific volume of 1.67cm3/g.
Table 3: Results of physical parameters of composite bread
Proximate analysis and pH value of composite bread
Table 4 below shows the moisture, crude protein, fat, ash, total dietary fiber, carbohydrate content and pH of the various bread treatments. There was a significant difference in the proximate composition and pH value of the tested samples.
The moisture content of the composite bread ranged from 32.05% to 39.53 with (T2) having the least and (T1) had the highest as shown in table 4.10 below. There was significant difference (P≤0.05) in the moisture content of the various treatments. However, (T1 and T5, T3, T4 and T8, T6 and T7) are not significantly different from each other but are significantly different from other treatments.
The crude protein of the composite bread samples ranged from 8.75% to 29.17%. (T6) had the highest value compared to other treatments, while (T5 and T8) had the least value and are not significantly different from each other. However, there was significance difference (P≤0.05) among the entire treatments.
The crude fat of the composite bread samples ranged from 1.85% to 2.30%. (T5) has the highest fat followed by (T6) while (T4) has the lowest fat. There was significant differences (P≤0.05) among the entire samples but, (T1and T7, T2, T3, andT8) are also not significantly different from each other but significantly different from other treatments.
| Treatment | Moisture (%) | Crude protein (%) | Crude fat (%) | Crude fiber (%) | Total ash (%) | Carbohydrat e (%) | pH |
| 1 | 39.53±1.94a | 21.87±4.37 bc | 2.08±0.07d | 6.06±0.05a | 1.06±0.06b | 29.41±2.37c | 6.00±0.00e |
| 2 | 32.05±0.01c | 13.13±0.00 cd | 1.95±0.05e | 4.95±0.05b | 0.90±0.09b | 47.04±0.13b | 6.06±0.01d |
| 3 | 34.52±2.04bc | 26.25±4.37b | 2.00±0.00e | 4.40±0.00e | 1.08±0.00b | 31.73±6.41c | 6.17±0.01b |
| 4 | 34.32±0.07bc | 14.58±6.68 cd | 1.85±0.05f | 4.63±0.02c | 1.28±0.04b | 46.95±2.25b | 6.24±0.02a |
| 5 | 38.64±1.47a | 8.75±0.05d | 2.40±0.00b | 5.00±0.00b | 0.90±0.08b | 44.30±1.39b | 6.06±0.00d |
| 6 | 34.75±1.73b | 29.17±6.68 b | 2.30±0.00c | 4.50±0.00d | 1.12±0.08b | 28.89±8.21c | 6.15±0.02b c |
| 7 | 35.49±1.23b | 17.50±7.58 cd | 2.10±0.00d | 4.95±0.05b | 1.03±0.04b | 41.14±5.32b | 6.14±0.01c |
| 8 | 33.23±0.85bc | 8.75±0.00d | 2.00±0.00e | 4.60±0.00c | 2.13±0.78a | 49.22±1.63b | 6.22±0.01a |
Values with different superscripts within the same column are significantly different (p≤0.05) using Duncans mean separation method
T1: 90% Wheat flour + 5% Maize flour + 5%Soybeans flour
T2: 80% Wheat flour + 15% Maize flour + 5%Soybeans flour
T3: 80% Wheat flour + 10% Maize flour + 10%Soybeans flour
T4: 80%Wheat flour + 5% Maize flour + 15%Soybeans flour
T5: 70% Wheat flour + 25% Maize flour + 5%Soybeans flour
T6: 70% Wheat flour + 20% Maize flour + 10%Soybeans flour
T7: 70% Wheat flour + 15% Maize flour + 15% Soybeans flour
T8: 70% Wheat flour + 10% Maize flour + 20%Soybeans flour
Table 4: Results of proximate analysis and pH value of composite bread
The crude fiber of the composite bread samples ranged from 4.40% to 6.06%. (T1) has the highest value compared to other treatments. There was significant difference (P≤0.05) in the crude fiber of (T1) when compared to other treatments while (T3) has the lowest fiber content and also significantly differ when compared with other treatments.
The total ash of the composite bread samples ranged from 0.90% to 2.13. (T8) has the highest value and there was a significant difference (P≤0.05) compared to other treatments while (T2 and T5) had the lowest value and are not significantly different from each other but are significantly different from other treatments.
The carbohydrate content of the composite bread samples ranged from 49.22% to 28.89%. (T8) had the highest carbohydrate value followed by
(T2) while (T6) had the lowest carbohydrate value. There was significant difference (P≤0.05) among the entire treatments but, (T1, T3 and T6, T2, T4, T5, T7 and T8) are not significantly different from each other but are significantly different from other treatments.
The pH value of the composite bread samples ranged from 6.00 to 6.24. (T4) had the highest pH value followed by (T8), while (T1) had the lowest pH value. There was significant difference (P≤0.05) among the entire treatments. However, It was observed that (T2 and T5) had similar values and there was no significant difference between the two treatments. Composite bread was produced with varying proportion of wheat flour, maize flour and soybeans flour i.e. 8 formulations incorporating different proportion of wheat flour with respect to maize flour along soybeans flour in every samples
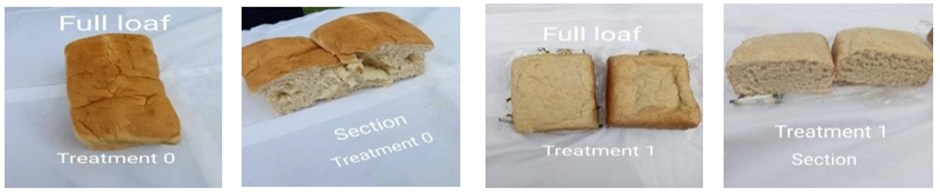
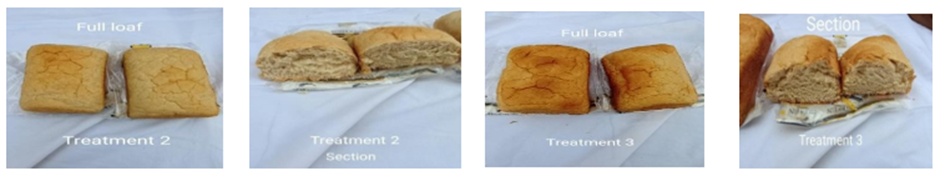
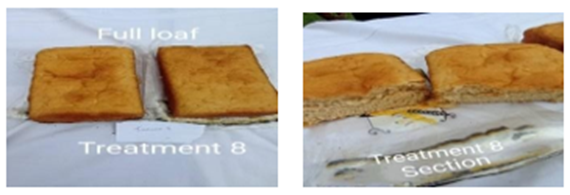
Plate 5: Showing bread from replacement blends
T1: 90% Wheat flour + 5% Maize flour + 5%Soybeans flour,
T2: 80% Wheat flour + 15% Maize flour + 5%Soybeans flour,
T3: 80% Wheat flour + 10% Maize flour + 10%Soybeans flour,
T4: 80%Wheat flour + 5% Maize flour + 15%Soybeans flour,
T5: 70% Wheat flour + 25% Maize flour + 5%Soybeans flour,
T6: 70% Wheat flour + 20% Maize flour + 10%Soybeans flour
T7: 70% Wheat flour + 15% Maize flour + 15% Soybeans flour,
T8: 70% Wheat flour + 10% Maize flour + 20%Soybeans flour.
4.11 Colour parameters of composite bread
The results of colour parameter is shown in Table 4.11 below
The L* values of crumb colour ranged from 63.83 to 66.98 with (T5) having the highest value and (T8) having the lowest value. There was no consistence variation in the value of the various treatments of the crust colour.
The a* values of the crumb colour ranged between 0.89 and 2.34 with (T8) having the highest value and (T1) having the lowest value. It was observed that there was no consistence variation in the value of the various treatments of the crust colour.
The b* values of the crumb colour ranged from 17.53 to 19.58 with (T1) having the highest value and (T8) having the lowest value. There was also no consistence variation in the value of the various treatments of the crust colour.
However, a* and b* values are always higher in the crust compared to the crumb and this is due to caramelization and Maillard reaction during crust formation. During baking, the two processes are important since they transform reducing sugars to other components and change the color of bread samples (Jusoh et al., 2008). Martins et al. (2000) indicated that caramelization and Maillard browning are governed by baking temperature and time.
| Treatment | L* | a* | b* |
| 1 | 58.80±0.20ef | 2.90±0.10f | 18.70±0.18d |
| 2 | 58.29±0.17f | 8.60±0.11b | 23.83±0.11a |
| 3 | 65.40±0.12a | 5.07±0.02d | 23.04±0.06b |
| 4 | 59.01±0.19e | 6.29±0.28c | 22.16±0.23c |
| 5 | 64.22±0.63b | 3.45±0.28ef | 18.97±0.83d |
| 6 | 60.69±0.34d | 3.62±0.01e | 18.92±0.24d |
| 7 | 61.63±0.29c | 5.36±0.82d | 22.32±0.74bc |
| 8 | 50.86±0.63g | 10.20±0.05a | 22.54±0.34bc |
Crumb colour
| Treatment | L* | a* | b* |
| 1 | 65.39±0.44b | 0.89±0.01f | 17.53±0.00f |
| 2 | 65.28±0.22bc | 0.95±0.02ef | 17.91±0.08e |
| 3 | 64.29±0.21d | 1.53±0.05d | 18.12±0.08e |
| 4 | 65.16±0.20bc | 2.01±0.02b | 19.13±0.14c |
| 5 | 66.98±0.58a | 1.04±0.15e | 17.78±0.07ef |
| 6 | 66.89±0.55a | 1.69±0.03c | 18.84±0.26cd |
| 7 | 64.51±0.28cd | 1.51±0.03d | 18.53±0.23d |
| 8 | 63.83±0.79d | 2.34±0.09a | 19.58±0.38b |
T1: 90% Wheat flour + 5% Maize flour + 5%Soybeans flour,
T2: 80% Wheat flour + 15% Maize flour+ 5%Soybeans flour,
T3: 80% Wheat flour + 10% Maize flour + 10%Soybeans flour,
T4: 80%Wheat flour + 5% Maize flour + 15%Soybeans flour,
T5: 70% Wheat flour + 25% Maize flour + 5%Soybeans flour,
T6: 70% Wheat flour + 20% Maize flour + 10%Soybeans flour,
T7: 70% Wheat flour + 15% Maize flour + 15% Soybeans flour,
T8: 70% Wheat flour + 10% Maize flour + 20%Soybeans flour
Table 5: Results of colour parameters of composite bread Crust colour
Shelf life study of composite bread
After baking, bread quality deteriorates, resulting in large monetary losses for the bakery sector and the consumer. (Axel, C. et.al, 2017). Bread spoilage is a complex process that involves chemical (nutritional value changes, rancidity), physical (moisture redistribution, staling), and microbiological (yeast, bacterial spoilage, and mold) changes and contributes to the "staling process" of bread. (Melini, V. et. al, 2018). Staling reduces bread's shelf life, which is defined as the amount of time that food remains "acceptable" for consumption under specific storage conditions. Acceptable indicates that it retains the required sensory, chemical, physical, and biological properties while also being safe. (Nicoli, M.C et al. 2012). Microbial deterioration, which eventually results in detectable mold growth and the development of mycotoxins that are not recognized, is another key factor for the lowering of the shelf life of bakery items through post- baking storage. High moisture levels (aw = 0.94-0.99) promote the growth of nearly all bacteria, yeasts, and molds. (Sun, L. et al., 2020).
The shelf life study of the composite bread was observed as shown in Table 6 below
At day 1 to 4, there was no visible growth among the various treatments of the composite bread, but at day 5, it was observed that (T1, T2, T5, T6, T7, and T8) had superficial growth of mold, while (T3 and T4) had no superficial growth of mold. However, at day 6, it was observed that (T3 and T4) had superficial growth of mold as shown in Table 6 below.
| Treatments1 | Days 2 | 3 | 4 | 5 | 6 | 7 | |
| 1 | − | − | − | − | + | + | + |
| 2 | − | − | − | − | + | + | + |
| 3 | − | − | − | − | − | + | + |
| 4 | − | − | − | − | − | + | + |
| 5 | − | − | − | − | + | + | + |
| 6 | − | − | − | − | + | + | + |
| 7 | − | − | − | − | + | + | + |
| 8 | − | − | − | − | + | + | + |
Results are expressed as follows: (−) means no superficial growth detected; (+) means superficial growth detected.
Table 6: Shelf life study of composite bread

Plate 6: Bread baked from blends affected by microbial spoilage
T1: 90% Wheat flour + 5% Maize flour + 5%Soybeans flour,
T2: 80% Wheat flour + 15% Maize flour + 5%Soybeans flour,
T3: 80% Wheat flour + 10% Maize flour + 10%Soybeans flour,
T4: 80%Wheat flour + 5% Maize flour + 15%Soybeans flour,
T5: 70% Wheat flour + 25% Maize flour + 5%Soybeans flour,
T6: 70% Wheat flour + 20% Maize flour + 10%Soybeans flour
T7: 70% Wheat flour + 15% Maize flour + 15% Soybeans flour,
T8: 70% Wheat flour + 10% Maize flour + 20%Soybeans flour.
This study was carried out to evaluate the effect of adding maize flour and soybeans flour on the quality of wheat bread. Maize and soybeans were processed into flour and added in different percentages to wheat flour for bread production. Bread with high nutrients and soybean bioactive compounds can be processed. Utilization of the maize and soybean flours in bread formulation has a significant implication in improving nutrition and reducing the rising price of bread processed from 100% wheat flours. The information could be useful for job creation for cooperatives such as women associations who can provide breads for different sectors in countries that could not afford 100% wheat bread. Composite bread from wheat, maize and soy beans flour can be prepared successfully. The statistical analysis showed that treatment with 70% wheat, 20% maize and 10% soya bean flour was significantly acceptable in terms of crumb appearance, taste, flavor, and overall acceptability among other treatments and thus can compete favorably with 100% wheat bread. However, sensory evaluation results also indicated a decrease in acceptance of bread with higher soybeans flour substitution
The findings of this project indicated that bread production from composite flours of wheat, maize and soybeans is possible. Therefore, this recipe should be made available for bakers so as to reduce high cost of bread produced mainly from wheat.
Further research activities are necessary to utilize other classes of cereal and legumes to produce protein dense and high fiber bread that is nutritious and health
Dear Editorial Team, Clinical Medical Reviews and Reports. My experience with the journal was highly positive. The peer-review process was rigorous, constructive, and completed in a timely manner. The reviewers provided valuable comments that helped improve the quality and clarity of our manuscript. The editorial office was professional, responsive, and supportive throughout all stages of the publication process. Communication was clear and efficient, and any questions were addressed promptly. Overall, I found the journal to maintain high scientific standards and an excellent publication workflow. I would be pleased to consider submitting future work to this journal. Best wishes from, Elena Popa.

It was my pleasure to submit my testimonial concerning the Reviewer Board of our Scientific Journal “Brain and Neurological Disorders”. The Reviewers focused on some modifications and their contribution was helpful. The ladies of our Editorial Office were also supported my efforts. It was my honor to have such a co-operation and I am looking forward for more collaboration.

Dear Grace Pierce, Editorial Coordinator of Journal of Clinical Research and Reports, Thank you for the speedy and efficient peer review process. I appreciate the fact that your peer reviewers do not take months to respond like with some other journals. I would also like to thank the editorial office for responding quickly to my questions. It is an excellent journal. I plan to submit more manuscripts in the future. Best wishes from, Robert W. McGee

Dear Grace Pierce, Editorial Coordinator of Journal of Clinical Research and Reports, Working with you and your team on our recent publication in JCRR has been a truly wonderful and enjoyable experience. The responses were prompt, and the reviewers were patient, constructive, and highly professional. One reviewer in particular gave me the feeling that a professor was carefully reading and commenting on my coursework, which was deeply touching. The entire process was straightforward and hassle‑free, with no tedious online forms to complete. I highly recommend this journal. Best wishes from, DR Aibing Rao, Head of R&D

I Appreciate the Opportunity to Share my Experience with the Journal of Clinical Research and Reports. The peer review process was timely and constructive, and the feedback provided helped improve the quality of our manuscript. The editorial office was professional, responsive, and supportive throughout the process, ensuring smooth communication and efficient handling of the submission. Overall, it was a positive experience collaborating with your team.

Dear Mercy Grace, Editorial Coordinator of Obstetrics Gynecology and Reproductive Sciences, We would like to express our gratitude for your help at all stages of publishing and editing the article. The editors of the magazine answer all the necessary questions and help at every stage. We will definitely continue to cooperate and publish other works in the Obstetrics Gynecology and Reproductive Sciences! Best wishes from, Alla Konstantinovna Politova,
