
Research | DOI: https://doi.org/10.31579/2637-8914/058
*Corresponding Author: Arjun Ghimire. Department of Food Technology, Central Campus of Technology, Dharan, Nepal.
Citation: Arjun Ghimire, Laxmi Aryal and Ranjana Poudel (2021) Preparation and Quality Evaluation of Buckwheat Incorporated Bread. J Nutrition and Food Processing, 4(5); DOI:10.31579/2637-8914/058
Copyright: © 2021 Arjun Ghimire, This is an open access article distributed under the Creative Commons Attribution License, which permits unrestricted use, distribution, and reproduction in any medium, provided the original work is properly cited.
Received: 27 June 2021 | Accepted: 22 July 2021 | Published: 03 August 2021
Keywords: buckwheat; composite bread; iron content; sensory characteristics; emulsifiers; anti-staling agents; potassium persulphate; saccharomyces cerevisiae; DOE
This study aimed to optimize buckwheat flour in bread. The product formulation was based on the results obtained from the DOE (Design of Expert) v 7.1.5. Buckwheat flour incorporated bread was prepared with the incorporation of buckwheat flour in 10%, 17.5%, 20%, 25%, 30%, 32.5%, and 40% concentration with wheat flour. The physical properties of buckwheat were analyzed along with the different physical properties of the prepared product. The proximate along with iron content and sensory analysis of buckwheat incorporated bread of different concentrations was carried out and the means were compared at a 5% level of significance.
The physical properties of buckwheat revealed the l/b ratio of 1.51, bulk density of 70.23 Kg/HL, and 1000 Kernel weight of 22.12g, respectively. Physical analysis of the bread formulations showed that the loaf volume and specific loaf volume decreased while the weight increased with the incorporation of buckwheat flour. The lowest loaf volume of 204 cm3 and specific loaf volume of 1.86cm3/g was recorded for 40% buckwheat incorporated bread with an increased weight of 109.40g. The protein, fat, crude fiber, ash, and iron were found to be 12.55%, 4.89%, 1.56%, 2.43%, and 3.27 mg/100 g respectively, in 25% buckwheat flour incorporated bread. The formulation of 25% buckwheat flour was found to be best in sensory characteristics in terms of color, taste, flavor, crumb appearance, and overall acceptability. Hence, the results concluded that 25% buckwheat incorporated flour bread was the optimum bread formulation for the preparation of composite bread.
Bread is a mixture of flour, water, yeast, and sodium chloride, with or without butter, kneaded, fermented, and cooked in an oven in the proper proportions. Bread baking is one of the earliest human pursuits [1]. The World Health Organization advises that each individual consumes 250 grams of bread each day which varies by country. As a result, baked goods are one of the most frequently eaten foods on the planet, with yearly global bread consumption exceeding 9 billion kg (20 billion lb) [6]. The volume, texture, color, and flavor of bread are usually used to determine its quality [14].
Bread is a leavened product made from wheat flour sugars released from starch by the action of natural flour enzymes. It differs from other typical foods in that it is a leavened product made from the fermentation of wheat flour sugars freed from starch by the action of natural flour enzymes. Baker's yeast is the commercial name for the organism Saccharomyces cerevisiae, which causes fermentation. Sugar is transformed into moisture and CO2 during fermentation. Due to the expansion of water vapor and CO2 as a result of the high temperature, they function as an insulator, limiting a rapid rise in bread crumb temperature and the potential of excessive moisture evaporation. To start the fermentation process, sugar is introduced, and the salt is used to strengthen the gluten and convert the yeast's activity into regulated dough expansion [20]. Fresh bread has a brownish, crispy crust, a nice scent, fine slicing qualities, a soft, elastic crumb texture, and a moist mouthfeel [12]. To attain the necessary quality, functional food additives such as emulsifiers and anti-staling agents in bread are now required because of automation, large-scale manufacturing, and rising customer demand for high quality, convenience, and extended shelf life [28]. Emulsifiers are very essential in large-scale, industrial bread baking because they increase dough strength, improve the rate of hydration, enhance crumb structure, improve slicing characteristics, improve gas holding capacity, and lengthen shelf life [20].
The steps of bread production include combining the ingredients, resting the dough, splitting and shaping it, proving, and baking, with the intermediate stage varying greatly depending on the kind of result. The dough is exposed to various shear and significant extensional deformations (including fracture) during mixing, fermenting, and baking, which is primarily influenced by temperature and water hydration [25]. Several physical changes occur during the bread-making process, with gluten proteins being primarily responsible for the creation of bread dough structure and starch being mostly responsible for final textural qualities and stability [24].
Buckwheat (Fagopyrum esculentum), a Polygonaceae dicotyledonous plant, is a moisture-loving, cool-climate annual grain with a lot of promise for application in sustainable tropical cropping systems. Buckwheat cultivation is not limited to a certain type of soil or fertilizer need, and it is also cultivated at higher elevations in Nepal and Bhutan, over 3,000 meters [31]. Buckwheat is a gluten-free pseudo-cereal with a high nutritional content that has been proved to have several health benefits. The many products created from the inclusion of buckwheat flour may be used in gluten-free meals for gluten-intolerant patients. Buckwheat is well-known for being a good source of nutritionally important protein, lipid, dietary fiber, and minerals, and when combined with other health-promoting components like phenolic compounds and sterols, as well as antioxidant capacity, it is gaining popularity as a potential functional food [13].
Many studies on the nutritional content of ordinary wheat flour loaves have been conducted. The findings of that study point to a fundamental shortcoming in such bread, which is mostly due to a lack of mineral content. As a result, the necessity for this research was identified to address a deficit in wheat loaves by partially incorporating buckwheat flour, which has a higher mineral content than regular wheat flour, and to make gluten-free bread.
1. Preparation of buckwheat incorporated bread
The essential ingredients for bread including wheat flour, buckwheat, butter, yeast, saccharine, table salt were procured from the local market of Dharan, Nepal.
All chemicals, glassware, and equipment required were used from the laboratory of Dharan Multiple Campus, Dharan, Nepal.
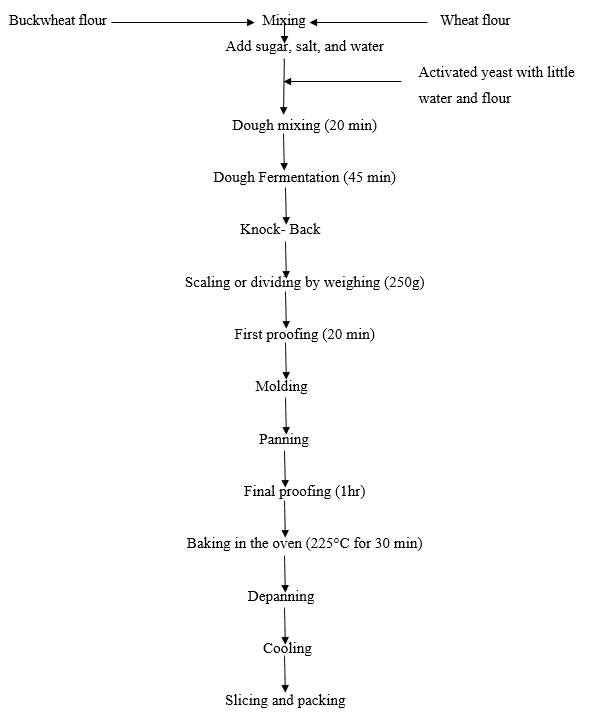
A simple flow diagram of the preparation of buckwheat incorporated bread is shown in (Figure 1).
2. Formulation of recipe
Design Expert v 7.1.5 software is used to create the recipe. A rotatable central composite design is used to formulate the recipe. The independent variables for the experiment are the concentration of buckwheat flour. The recipe formulation for the buckwheat incorporated bread was carried out as given in Table 1.
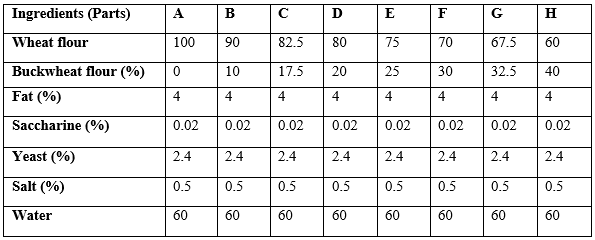
The bread was made as per the recipe formulation done and coded names A, B, C, D, E, F, G, and H, were given to each recipe. Composite bread was prepared using the straight dough development method as in (Figure 1).
3. Analysis of raw materials and products
3.1 Determination of physical properties of buckwheat
The knowledge of the physical properties of different grain is necessary for the design of various separating, handling, sorting, and grading equipment.
3.1.1 (l/b ratio)
l/b ratio of grain was determined as mentioned in [26].
3.1.2 Bulk density
The bulk density was measured as mentioned in [7] by pouring the grains into the funnel-shaped hopper, the hopper was centered over the measuring bushel, the hopper valve was opened quickly, and the grains were allowed to flow freely into the measuring bushel. After the bushel was filled, the excess material was leveled off with gentle zigzag strokes using the standard Seedburo striking stick. The filled measuring bushel was then weighed, and the mass of grains in the bushel was determined by subtracting the mass of the measuring bushel itself. The bulk density (ρ) of grain was then calculated using Eq. 1:

3.1.3 1000 kernels weight
The 1000 kernel weight of raw materials was determined by measuring the weight of 1000 kernels of buckwheat seeds after selecting the appropriate sample size by the quartering method as stated by [5].
3.2 Determination of physical properties of the product
3.2.1 Volume
The volume of bread was determined by the rapeseed displacement method as mentioned in AACC (1995) for white bread.
3.2.2 Specific loaf volume of the bread
Specific loaf volume of bread is defined as the ratio of the volume of bread to the weight of bread. The specific loaf volume of bread was determined as illustrated by [3] as shown in Eq. 2.

3.3 Proximate analysis
3.3.1 Moisture content
The moisture content of the sample was determined by heating in an oven at 100 ± 5°C to get constant weight [23].
3.3.2 Crude fat
The crude fat content of the samples was determined by solvent extraction method using soxhlet apparatus and solvent petroleum ether [23].
3.3.3 Crude protein content
The crude protein content of the samples was determined indirectly by measuring total nitrogen content by the micro Kjeldahl method. Factor 6.25 was used to convert the nitrogen content to crude protein [23].
3.3.4 Crude fiber content
The crude fiber content of the samples was determined by the method given by [23].
3.3.5 Total ash
The total ash content of the samples was determined by following the method given by Ranganna (1986) using a muffle furnace.
3.3.6 Carbohydrate
The carbohydrate content of the sample was determined by a difference method as given in Eq. 3.

3.4 Iron content
The iron content of the sample was determined as per [23]. The iron in foods was determined by converting the iron to ferric form using oxidizing agents like potassium persulphate or hydrogen peroxide and then treating with potassium thiocyanate to form the red ferric thiocyanate which was measured calorimetrically at 480 nm.
3.5 Sensory analysis
Sensory scores were done by the semi-trained panelists according to the 9-point hedonic scale (9=like extremely, 1= dislike) for composite bread formulations. The sensory of the product was done in a closed room so that panelists can sensory the product without any disturbance for evaluation of crumb appearance, color, texture, taste, flavor, and overall acceptability of buckwheat flour incorporated bread.
3.6 Statistical Analysis
The obtained mean data from proximate analysis and sensory evaluations were analyzed statistically by Genstat Discovery Edition 3 (DE3), for Analysis of Variance (ANOVA) at a 5% level of significance.
This effort was done to make several bread formulations using varied proportions of buckwheat flour and wheat flour. Because bread is a product that is frequently consumed by the general public, buckwheat integrated bread was chosen as a vehicle to drive nutritious components in this study because it provides value to the nutritional profile. Physical and chemical analyses of the key basic components were performed initially.
1. Physical properties of buckwheat
The physical properties of the buckwheat are shown in Table 2.

The values are the means of triplicate samples and the values in the parenthesis are standard deviation. The length of the buckwheat ranged from 3.6- 6.52 mm. The breadth ranged from 2.73- 4.22 mm, and the length to breadth ratio of buckwheat ranged from 1.31-1.54. The study conducted by [30] showed similar values for the l/b ratio of buckwheat seeds. Bulk density was found to be 70.23 kg/Hl while 1000 kernels' weight was found to be 22.12g. The study conducted by [4] showed slightly lower values for 1000 kernels weight and bulk density. The reason for this variation in the present study may be due to varietal divergence.
2. Chemical composition of wheat flour and buckwheat flour
The chemical composition of wheat flour and buckwheat flour is shown in Table 3.
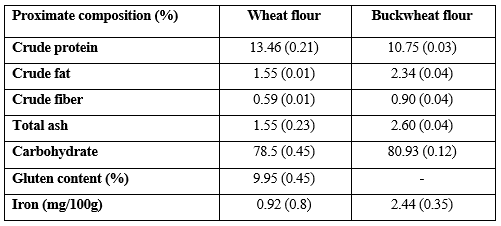
The values are the means of triplicate samples and the values in the parenthesis are standard deviation. The protein, fat, crude fiber, ash, and carbohydrate of wheat flour were found to be 13.46, 1.55, 0.59, 1.55, and 78.5% respectively [4]. Reported respective proximate values were 12.73, 12.86, 1.80, 0.67, 1.38, and 73.9% respectively. And that for buckwheat flour, the similar values were found to be 10.75, 2.34, 0.90, 2.60, and 80.93 respectively which was in the normal range as described by [4]. The iron content of wheat flour and buckwheat flour was found to be 0.92 and 2.44mg/100g respectively which was in the normal range as described by [4]. The gluten content of the wheat flour was found to be 9.95%, while in the case of buckwheat flour gluten was not observed which resembles the gluten-less explanation of buckwheat flour as explained by [8].
3. Physical parameters of buckwheat flour incorporated bread.

The values are the means of triplicate samples and the values in the parenthesis are standard deviation. Physical parameters of bread such as loaf volume, weight, and specific loaf volume were affected by the substitution increment of the level of buckwheat flour which is presented in Table 4. The results indicated that the weight of bread increased with increasing substitution percentage of buckwheat flour. 40 parts buckwheat flour incorporated bread revealed the maximum weight (109.40g). An increase in loaf weight may be due to increased absorption of water as revealed by [15].
Moreover, the results of loaf volume and specific loaf volume of bread revealed a reduction in loaf volume from 265 to 204 cm3 and specific loaf volume from 3.09 to 1.86 cm3/g. It is obvious that as the amount of buckwheat flour in the loaf grew, the volume of the loaf and the specific volume of the loaf for each treated bread dropped. The drop in loaf volume and specific volume might be attributed to a decrease in the gluten network in the dough, as well as the dough's capacity to rise due to a weaker cell structure [18].
4. Sensory properties of bread
Statistical analysis of the sensory scores was obtained from 11 semi-trained panelists using a 9-point hedonic rating scale (9=like extremely, 1= dislike) for composite bread formulations. Sensory analysis was performed with the aid of different panelists evaluating crumb appearance, color, texture, taste, flavor, and overall acceptability of buckwheat flour incorporated bread against the blank.
4.1 Color
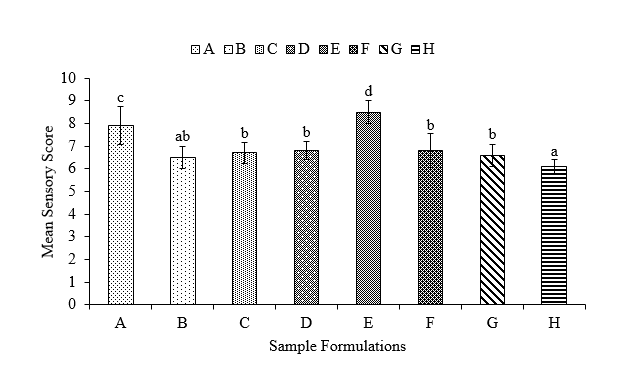
The mean sensory score for the color of bread samples of the different formulation is shown in (Figure 2).

The mean sensory score for color was found to be 8, 6.6, 6.3, 6.4, 8.4, 6.8, 6.7, and 6.1 for the bread formulation A, B, C, D, E, F, G, and H respectively. Statistical analysis showed that the partial substitution of wheat flour with buckwheat flour had a significant effect (p< 0>
4.2 Taste
The mean sensory score for Taste of bread samples of the different formulation is shown in (Figure 3).
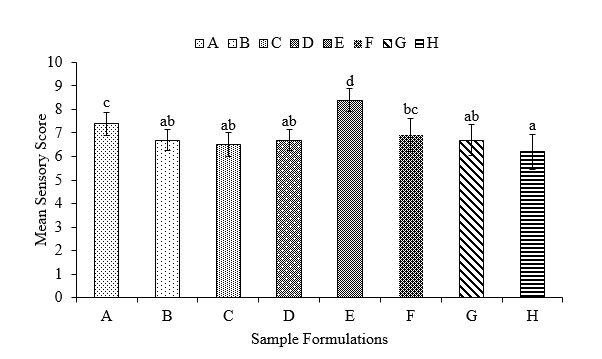
The mean sensory score for taste was found to be 7.4, 6.7, 6.5, 6.7, 8.4, 6.9, 6.7, and 6.2 for the bread formulation A, B, C, D, E, F, G, and H respectively. Statistical analysis showed that the partial substitution of wheat flour with buckwheat flour had a significant effect (p< 0>
4.3 Flavor
The mean sensory score for the flavor of bread samples of the different formulation is shown in (Figure 4).

The mean sensory score for flavor was found to be 7.4, 6.3, 6.5, 6.4, 8.1, 6.9, 6.8, and 6.4 for the bread formulation A, B, C, D, E, F, G, and H respectively. Statistical analysis showed that the partial substitution of wheat flour with buckwheat flour had a significant effect (p< 0>
4.4 Texture
The mean sensory score for the texture of bread samples of the different formulation is shown in (Figure 5).

The mean sensory score for texture was found to be 8.1, 8, 7.9, 7.7, 7.5, 6.8, 6.6, and 6.5 for the bread formulation A, B, C, D, E, F, G, and H respectively. Statistical analysis showed that the partial substitution of wheat flour with buckwheat flour had a significant effect (p< 0>
4.5 Crumb Appearance
The mean sensory score for the crumb appearance of bread samples of the different formulation is shown in (Figure 6).

The mean sensory score for crumb appearance was found to be 8.2, 6.4, 6.7, 6.6, 8.5, 7, 6.4, and 6.3 for the bread formulation A, B, C, D, E, F, G, and H respectively. Statistical analysis showed that the partial substitution of wheat flour with buckwheat flour had a significant effect (p< 0>
4.6 Overall Acceptability
The mean sensory score for the overall acceptability of bread samples of the different formulation is shown in (Figure 7).
The mean sensory score for crumb appearance was found to be 7.9, 6.5, 6.7, 6.8, 8.5, 6.8, 6.6, and 6.1 for the bread formulation A, B, C, D, E, F, G, and H respectively. Statistical analysis showed that the partial substitution of wheat flour with buckwheat flour had a significant effect (p< 0>
4.7 Chemical composition of optimized product
The composition of the best product and the control bread from the chemical analysis was carried out. The result of the analysis is given in (Table 5).

The protein, fat, crude fiber, and ash of product A were found to be 14.54, 4.29, 0.98, and 2.14% respectively, and that of product E was found to be 12.55, 4.89, 1.56, and 2.43% respectively.
The moisture content of the whole wheat bread and composite bread decreased with the increase in the proportion of the buckwheat flour substitution. This trend is similar to the findings of [19,9], but differs from the studies of [21, 22] who found that the moisture content of the composite bread increased with the increase in the non-wheat flour substitution. And this was attributed to the greater water holding capacity of the non-wheat flour substitution [29]. Because buckwheat flour has a lower moisture content than wheat flour, the drop in moisture content of the product with buckwheat integrated bread might be attributable to the buckwheat itself. The high moisture content renders it vulnerable to microbial assault, which can shorten the product's shelf life, but it also gives the bread its distinctive hardness.
The protein content of the buckwheat incorporated bread has decreased concerning the wheat bread with no buckwheat. This could be because of the lower protein present in the buckwheat, but the protein content did not differ significantly between the bread. The crude protein content of the whole wheat bread and composite bread decreased with the increase in the proportion of the buckwheat flour substitution. This trend is similar to the findings of [4]. Buckwheat protein is a good source of dietary protein for gluten-sensitive people since it contains less gluten than wheat. Wheat flour has a little greater crude fat content than buckwheat flour into bread. This might be related to buckwheat flour's limited fat retention capacity. Buckwheat flour also has a high crude fiber content. As a result, the fiber content of bread made using buckwheat flour increased. Greater levels of iron (3.27 mg/100g) show the higher level of minerals in buckwheat flour integrated bread. The increased number of these components in buckwheat flour compared to wheat flour increased mineral content [32]. To combat iron deficiency, buckwheat flour with a higher iron content can be used to make bread.
Preparation of buckwheat incorporated bread can be carried out successfully. The statistical analysis showed that formulation with 25% buckwheat flour was significantly superior in terms of taste, crumb, flavor, texture, and overall acceptability among formulations. The proximate composition of optimized bread is significantly different from the control bread at a 5% level of significance. The 25% buckwheat flour incorporated in bread is superior in, crude fat, crude fiber, crude ash as compared to the control bread. The iron content of the buckwheat flour incorporated formulations was increased due to the supplementation of buckwheat flour and was higher than control bread and the retention of iron content was found to be high in bread. Hence, it can be concluded that buckwheat flour incorporated bread can be more nutritious than bread without buckwheat.
The authors appreciate all the faculties and staff of the Dharan Multiple Campus, Nepal for their support and technical assistance.
The author(s) declared no potential conflicts of interest for the research, authorship, and/or publication of this article.
The author(s) received no financial support for the research, authorship, and/or publication of this article.
Dear Editorial Team, Clinical Medical Reviews and Reports. My experience with the journal was highly positive. The peer-review process was rigorous, constructive, and completed in a timely manner. The reviewers provided valuable comments that helped improve the quality and clarity of our manuscript. The editorial office was professional, responsive, and supportive throughout all stages of the publication process. Communication was clear and efficient, and any questions were addressed promptly. Overall, I found the journal to maintain high scientific standards and an excellent publication workflow. I would be pleased to consider submitting future work to this journal. Best wishes from, Elena Popa.

It was my pleasure to submit my testimonial concerning the Reviewer Board of our Scientific Journal “Brain and Neurological Disorders”. The Reviewers focused on some modifications and their contribution was helpful. The ladies of our Editorial Office were also supported my efforts. It was my honor to have such a co-operation and I am looking forward for more collaboration.

Dear Grace Pierce, Editorial Coordinator of Journal of Clinical Research and Reports, Thank you for the speedy and efficient peer review process. I appreciate the fact that your peer reviewers do not take months to respond like with some other journals. I would also like to thank the editorial office for responding quickly to my questions. It is an excellent journal. I plan to submit more manuscripts in the future. Best wishes from, Robert W. McGee

Dear Grace Pierce, Editorial Coordinator of Journal of Clinical Research and Reports, Working with you and your team on our recent publication in JCRR has been a truly wonderful and enjoyable experience. The responses were prompt, and the reviewers were patient, constructive, and highly professional. One reviewer in particular gave me the feeling that a professor was carefully reading and commenting on my coursework, which was deeply touching. The entire process was straightforward and hassle‑free, with no tedious online forms to complete. I highly recommend this journal. Best wishes from, DR Aibing Rao, Head of R&D

I Appreciate the Opportunity to Share my Experience with the Journal of Clinical Research and Reports. The peer review process was timely and constructive, and the feedback provided helped improve the quality of our manuscript. The editorial office was professional, responsive, and supportive throughout the process, ensuring smooth communication and efficient handling of the submission. Overall, it was a positive experience collaborating with your team.

Dear Mercy Grace, Editorial Coordinator of Obstetrics Gynecology and Reproductive Sciences, We would like to express our gratitude for your help at all stages of publishing and editing the article. The editors of the magazine answer all the necessary questions and help at every stage. We will definitely continue to cooperate and publish other works in the Obstetrics Gynecology and Reproductive Sciences! Best wishes from, Alla Konstantinovna Politova,
