
Research Article | DOI: https://doi.org/10.31579/2637-8914/256
1Department of Biochemistry, Federal University of Technology, Owerri, Imo State, Nigeria.
2Department of Biochemistry, Lead City University, Ibadan, Oyo State, Nigeria.
*Corresponding Author: Chimdi E. Esonu, Department of Biochemistry, Federal University of Technology, Owerri, Imo State, Nigeria.
Citation: Chimdi E. Esonu, Callistus I. Iheme, Onyinyechi C. Njoku, Linus O. Agwu and Augustine I. Airaodion, et.al, (2024), Investigation of Proximate Composition and Bioactive Components in Banana (Musa acuminata) Peels Using Advanced Analytical Techniques, J. Nutrition and Food Processing, 7(10); DOI:10.31579/2637-8914/256
Copyright: © 2024, Chimdi E. Esonu. This is an open access article distributed under the Creative Commons Attribution License, which permits unrestricted use, distribution, and reproduction in any medium, provided the original work is properly cited.
Received: 03 July 2024 | Accepted: 22 July 2024 | Published: 09 August 2024
Keywords: Musa acuminata; banana peels; proximate composition; bioactive components; GC-MS; FT-IR; nutritional analysis.
Background: Banana peels, often considered waste, contain valuable nutrients and bioactive compounds. This study investigates the proximate composition and bioactive components of banana (Musa acuminata) peels using advanced analytical techniques.
Materials and Methods: Banana peels were collected from household wastes and processing facilities, washed, dried, and ground into fine powder. Proximate analysis was performed to determine moisture, carbohydrate, ash, crude fiber, protein, and crude fat content using standard methods. Gas Chromatography-Mass Spectrometry (GC-MS) and Fourier Transform Infrared Spectroscopy (FT-IR) were employed to identify and characterize bioactive components and functional groups.
Results: The proximate composition revealed moisture (7.36 ± 0.37%), carbohydrate (23.15 ± 0.05%), ash (12.11 ± 0.09%), crude fibre (30.53 ± 0.77%), protein (16.42 ± 0.45%), and crude fat (10.43 ± 0.67%). GC-MS analysis identified various bioactive compounds, including 13-Docosenoic acid methyl ester (12.67%), 1-Docosene (12.63%), and Octadecanal (9.45%). FT-IR analysis indicated the presence of functional groups such as alkane (2746.688 cm^-1), ester (1888.360 cm^-1), and primary amine (3514.793 cm^-1).
Conclusion: Banana peels possess significant nutritional and bioactive components, making them a potential resource for various industrial applications. The study highlights the importance of valorizing banana peels for nutritional and therapeutic uses.
Bananas (Musa acuminata) are one of the most consumed fruits globally due to their nutritional benefits and availability. However, the peels, which constitute approximately 35% of the fruit's total weight, are often discarded as waste despite their potential health benefits and bioactive compounds [1]. Recent research has focused on the valorization of banana peels as a sustainable source of nutrients and bioactive compounds that can be used in various industrial applications [2].
The proximate composition of banana peels includes moisture, ash, protein, fat, fibre, and carbohydrates. Several studies have reported varying compositions based on factors such as banana variety, ripeness, and environmental conditions [3]. For instance, the moisture content can range from 6% to 9%, while the fiber content can be as high as 50% of the dry weight [1]. Understanding the proximate composition is crucial for evaluating the nutritional value and potential uses of banana peels in food and non-food industries.
Banana peels are rich in bioactive components such as phenolics, flavonoids, and carotenoids, which have been linked to various health benefits including antioxidant, antimicrobial, and anti-inflammatory properties [4]. Phenolic compounds, in particular, are known for their potent antioxidant activities, which can help in preventing oxidative stress-related diseases [5]. The presence of these bioactive compounds makes banana peels a valuable resource for developing functional foods and nutraceuticals.
GC-MS is a powerful analytical technique used to identify and quantify volatile and semi-volatile compounds in complex matrices. It combines the features of gas chromatography and mass spectrometry to provide detailed information on the molecular structure of the compounds present in banana peels [6]. This technique is particularly useful for analyzing the lipid and volatile fractions of the peels, which contain essential oils and other bioactive compounds.
FT-IR spectroscopy is another advanced analytical technique that provides information on the functional groups and molecular interactions within a sample. By measuring the absorption of infrared radiation by the sample, FT-IR can identify characteristic peaks corresponding to different chemical bonds [7]. This technique is useful for assessing the overall chemical composition of banana peels, including carbohydrates, proteins, and lipids.
Investigating the proximate composition and bioactive components of banana peels using advanced analytical techniques such as GC-MS and FT-IR is significant for several reasons. First, it can provide a comprehensive understanding of the nutritional and functional properties of banana peels, which can promote their utilization in various applications. Second, the identification of bioactive compounds can lead to the development of new functional foods, dietary supplements, and pharmaceuticals. Lastly, this study contributes to the growing field of sustainable food production by exploring ways to reduce food waste and maximize the use of agricultural by-products.
2.1 Collection and Preparation of Sample
Banana peels were collected from household wastes and processing facilities. The peels were washed properly and chopped into tiny pieces and left to dry. The dried peels were then grinded into fine powder and stored in an air tight container ready for use.
2.2 Proximate Analysis
2.2.1 Moisture Content
Moisture content was determined using the methods of AOAC [8]. Briefly, a crucible was washed and dried in the oven. Approximately 2 g of the sample was weighed into crucible. The weight of the crucible and sample was noted before drying. The crucible and sample were put in the oven and heated at 105-200 oC for 2hr, the result noted and heated for another 1hr until a steady result was obtained and the weight was noted. The drying procedure was continued until a constant weight was obtained
% moisture content = [(W1 – W2) ÷ weight of sample] × 100
Where: W1 = Weight of crucible & sample before drying.
W2 = weight of crucible & sample after (drying to constant weight).
Percentage Dry Matter (%DM) = 100 – Moisture content.
2.2.2 Carbohydrate Determination
Carbohydrate content was determined using Antrone Method. Briefly, 1 ml of each of the prepared standard glucose solution was pipetted into different test tubes. One milliliitre (1 ml) of the prepared sample solution was added to a different test tube and the volume of all test tubes were made up to 3 ml with distilled water. All tubes were transferred to ice cold water and 6 ml of Anthrone reagent was added. Blank was prepared with distilled water and Anthrone, and all tubes were heated for 5 mins in water bath. Absorbance of each test tube was read against the blank. A calibration curve of absorbance against concentration was plotted using the standard glucose concentration and the concentration of the sample solution was extrapolated from the curve.
2.2.3 Determination of Ash Content
Ash content was determined according to the method outlined by Airaodion et al. [9]. Briefly, empty crucible was washed, oven dried and the weight was noted. Approximately 2 g of sample was weighed into the crucible and placed in an oven at 200-300 oC till sample was ashed. The sample was cooled after burning and weighed
%Ash content = [(W3 – W1) ÷ (W2 – W1)] × 100
Where:
W1= weight of empty crucible.
W2 = weight of crucible and sample before burning.
W3 = Weight of crucible and ash.
2.2.4 Determination of Crude fibre
Crude fibre was determined using the methods outlined by Onabanjo and Airaodion [10]. Briefly, sample was defatted by weighing 2g of sample and adding 50ml of petroleum ether, stirred very well and decanted, repeat this step 3 more times. Boiled in water bath for 30mins with 200ml of a solution containing 1.25% of H2SO4 per 100 ml of solution. The solution was filtered through Linen. Washed with boiling water until the washings are no longer acid. Transferred the residue to a beaker and boiled for 30 mins with 200 ml of a solution containing 1.25 g for carbonate free NaOH per 100ml. Then filtered the final residue through Linen. The residue is dried in an electric oven and weighed. Then incinerated to ash, cooled and weighed. The loss in weight after incineration x 100 is the percentage of crude fibre.
%Crude fibre = (Weight of fibre ÷ Weight of sample) × 100
2.2.5 Determination of Crude Proteins
Crude protein was determined using Buiret method outlined by Airaodion et al. [11]. Briefly, 1ml of each of the prepared standard protein solution were pipetted into different test tubes. One millilitre (1 ml) of the prepared sample solution was added to a different test tube. Three millilire (3 ml) of Buiret reagent was added to all test tube. A blank was prepared with distilled water and Buiret reagent. The content of each test tube was mixed very well and incubated at 37 oC for 10 mins. All tubes were cooled to room temperature and the absorbance of each test tube was read against the blank at 540 nm. A standard curve was plotted with the absorbance and concentration of the protein standard and the concentration of the sample was extrapolated from the curve.
2.2.6 Determination of Crude Fat
Crude fat content was determined using differential method.
Crude fat = 100 – (Moisture content + Carbohydrate content + Ash content + Protein content + Crude fibre).
2.3 Gas Chromatography-Mass Spectrometry (GC-MS) Analysis
The Clarus 500 GC used in the analysis was equipped with a fused silica column, packed with Elite-1 (100% dimethyl poly siloxane, 30 nm × 0.25 nm ID × 1 µm df) and the components were separated using Helium as carrier gas at a constant flow of 1ml/min. 2µl sample extract was injected into the instrument and was detected by the Turbo gold mass detector (Perkin Elmer) with the aid of the Turbo mass 5.1 software. During the 36th minute Gas chromatography extraction process, the oven was maintained at a temperature of 110°C with 2 minutes holding. The injector temperature was set at 250°C (mass analyser). The different parameters involved in the operation of the Clarus 500 MS, were also standardized (Inlet line temperature: 200°C; Source temperature: 200°C). Mass spectra were taken at 70 eV; a scan interval of 0.5s and fragments from 45 to 450 Da. The MS detection was completed in 36 minutes.
2.3.1 Identification of components
Interpretation of mass spectrum obtained from GC-MS was conducted using the database of National Institute Standard and Technology (NIST) having more than 82,000 patterns. The spectrum of the unknown component was compared with the spectra of the known components stored in the NIST library. The name, molecular weight, molecular formula and structure of the components of the test materials were ascertained.
2.4 Fourier Transform Infrared Spectroscopy (FT-IR) Analysis
Two milligrams (2 mg) of the sample extract was mixed with 100mg potassium bromide (KBr of FT-IR grade) and then compressed to prepare a salt-disc (3 mm diameter). The disc was immediately kept in the sample holder and FT-IR spectra were recorded in the absorption range between 400 and 4000 cm–1. All investigations were carried out with a Shimadzu FT-IR spectrometer.
2.4.1 Identification of functional groups
The FT-IR spectrum was used to identify the functional groups of the active components present in the Musa acuminata sample based on the peak values in the region of Infrared radiation. When the sample extract was passed into FT-IR, the functional groups of the components were separated based on their peak ratio.
The proximate analysis of Musa acuminata (banana) peels revealed the following composition: moisture content was 7.36 ± 0.37%, carbohydrate content was 23.15 ± 0.05%, ash content was 12.11 ± 0.09%, crude fiber content was 30.53 ± 0.77%, protein content was 16.42 ± 0.45%, and crude fat content was 10.43 ± 0.67%. These values represent the mean ± standard deviation for three groups of measured samples, indicating consistent findings across different samples.
The gas chromatogram of methanolic extracts from Musa acuminata peels identified several compounds with varying molecular weights and formulas. Notably, the chromatogram revealed the presence of compounds such as chloroacetic acid, propyl ester, xanthumin, isobutylamine, acetic acid, chloro-, ethyl ester, methanol, chloro-, acetate, and various other esters, alcohols, and acids. The area percentages varied, with some compounds like 1-heptanol, 7-chloro- (2.85%) and metolachlor (2.43%) showing higher concentrations compared to others. The most abundant compounds were octadecane, 1-chloro- (9.45%), 13-docosenoic acid, methyl ester (12.67%), and cyclohexane, (1-butylhexadecyl)- (13.42%).
The FT-IR analysis of the banana peels identified various functional groups and their corresponding bonds. The wave numbers and peak intensities indicated the presence of compounds such as 1,2 disubstituted aromatic compounds (Sp2 C-H out of plane bending), trisubstituted alkenes (C=C bending or C-Cl stretching), amines (C-N stretching), aromatic esters (C-O stretching), alkanes (C-H stretching), conjugated alkenes (C=C stretching), esters and anhydrides (C=O stretching), isothiocyanates (N=C=S stretching), alkynes (C≡C stretching), isocyanates (N=C=O stretching), carbon dioxide (O=C=O stretching), thiols (S-H stretching), amine salts (N-H stretching), alcohols (O-H stretching), alkenes (C-H stretching), alkynes (C-H stretching), and primary amines (N-H stretching).
These analyses highlight the complex chemical composition of Musa acuminata peels, indicating their potential for various industrial applications due to the presence of diverse compounds and functional groups. The proximate composition suggests a significant presence of carbohydrates, fiber, protein, and fat, making the peels a potential source of nutritional and functional components. The detailed chemical profile from the gas chromatogram and FT-IR analyses further supports the potential for extracting valuable compounds for use in different industries.
| PROXIMATE | CONCENTRATION (%) |
| Moisture content | 7.36 ± 0.37 |
| Carbohydrate content | 23.15 ± 0.05 |
| Ash content | 12.11 ±0.09 |
| Crude fibre | 30.53 ± 0.77 |
| Protein content | 16.42 ± 0.45 |
| Crude fat | 10.43 ± 0.67 |
Results are expressed as mean ± standard deviation for triplicate measurement
Table 1: Proximate composition of Musa acuminata (banana) peels.
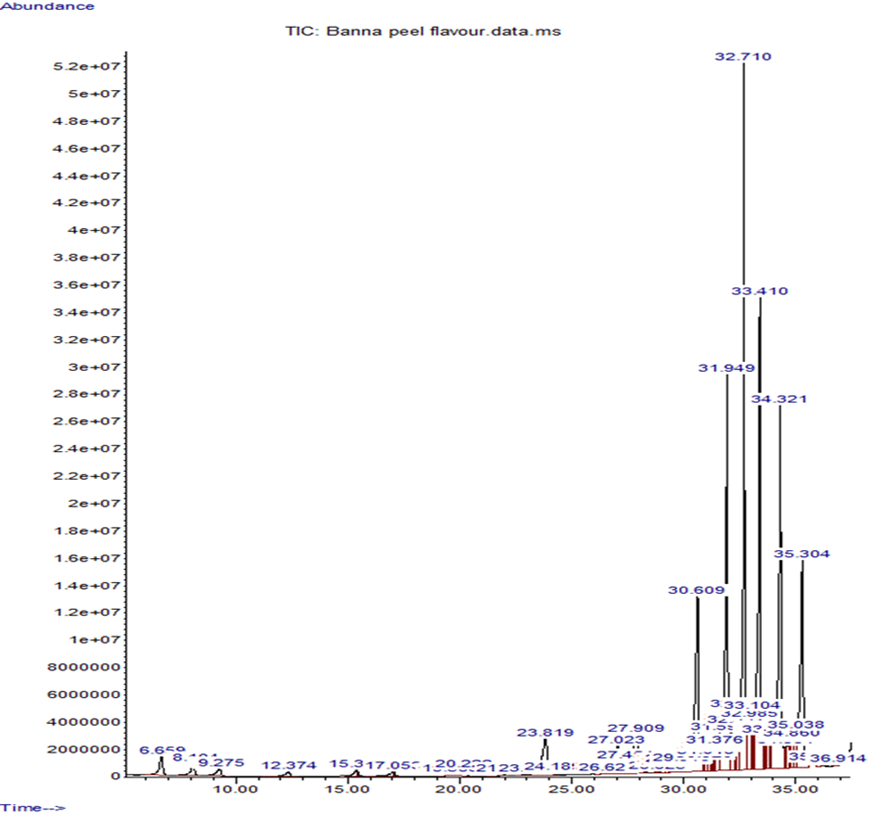
Graph 1: Gas Chromatogram of methanolic extracts of Musa acuminata peel
| S/No. | RT | COMPOUND NAME | MW | FORMULA | AREA % |
| 1 | 6.659 | Chloroacetic acid, propyl ester | 136.58 | C5H9ClO | 0.90 |
| 2 | 8.104 | Xanthumin | 152.11 | C5H4N4O2 | 0.64 |
| 3 | 9.275 | Isobutylamine | 73.14 | C4H11N | 0.38 |
| 4 | 12.374 | Acetic acid, chloro-, ethyl ester | 122.55 | C4H7ClO | 0.34 |
| 5 | 15.371 | Methanol, chloro-, acetate | 108.52 | C3H5ClO | 0.24 |
| 6 | 15.398 | Xanthumin | 152.11 | C5H4NO2 | 0.13 |
| 7 | 17.006 | Xanthumin | 152.11 | C5H4NO2 | 0.29 |
| 8 | 17.053 | Aceticacid,chloro-, 1-methylbutyl | 164.63 | C7H13ClO | 0.10 |
| 9 | 19.383 | 1-Tridecene | 182.35 | C13H | 0.00 |
| 10 | 19.585 | Octane, 2-methyl- | 128.26 | C9H20 | 0.01 |
| 11 | 20.222 | Bromoaceticacid,tetradecyl ester | 335.32 | C16H31BrO | 0.38 |
| 12 | 21.997 | Decane, 2-methyl | 156.31 | C11H | 0.04 |
| 13 | 23.023 | Cyclotetradecane | 196.37 | C14H28 | 0.06 |
| 14 | 23.819 | 1-Heptanol, 7-chloro- | 192.68 | C9H17ClO | 2.85 |
| 15 | 24.189 | Tetradecane, 1-fluoro- | 216.36 | C14H29F | 0.07 |
| 16 | 26.460 | Hexadecanoic acid, 2-methyl- | 284.48 | C18H36O | 0.07 |
| 17 | 26.620 | 1-Heptadec-1-ynylcyclopentanol | 86.13 | C5H10O | 0.01 |
| 18 | 27.023 | Metolachlor | 283.79 | C15H22ClNO | 2.43 |
| 19 | 27.454 | Metolachlor | 283.79 | C15H22ClNO | 0.13 |
| 20 | 27.909 | 2-Piperidinone,N-[4-bromo-n-but | 213.11 | C10H13Br | 3.47 |
| 21 | 28.760 | Cyclopentane, (2-hexyloctyl)- | 266.51 | C19H38 | 0.02 |
| 22 | 28.825 | Z-2-Octadecen-1-ol | 268.48 | C18H36O | 0.01 |
| 23 | 29.151 | 7-Dodecenol | 184.32 | C12H24O | 0.20 |
| 24 | 29.243 | Z-2-Octadecen-1-ol | 268.48 | C18H36O | 0.23 |
| 25 | 29.351 | 1-Docosene | 308.58 | C22H | 0.05 |
| 26 | 29.401 | Z-2-Octadecen-1-ol | 268.48 | C18H36O | 0.05 |
| 27 | 29.472 | Oxirane, tetradecyl- | 249.42 | C16H32O | 0.09 |
| 28 | 29.571 | Octadecane, 1-chloro- | 288.94 | C18H37Cl | 0.23 |
| 29 | 29.845 | 1-Docosene | 308.58 | C22H | 0.29 |
| 30 | 29.916 | Decane, 5-cyclohexyl- | 224.43 | C16H | 0.14 |
| 31 | 30.609 | Octadecanal | 268.48 | C18H36O | 9.45 |
| 32 | 30.920 | Dodecane, 1,2-dibromo | 328.13 | C12H24Br | 0.11 |
| 33 | 31.018 | Dodecane, 1,2-dibromo- | 328.13 | C12H24Br | 0.43 |
| 34 | 31.155 | 6-Nitroundec-5-ene | 199.29 | C11H21NO2 | 0.38 |
| 35 | 31.213 | 1-Docosene | 308.58 | C22H | 0.38 |
| 36 | 31.318 | Oxalic acid, hexyl octadecyl ester | 368.64 | C24H48O | 0.36 |
| 37 | 31.376 | 2,15-Octadecadien-1-ol acetate | 308.49 | C20H36O | 0.34 |
| 38 | 31.597 | 1-Docosene | 308.58 | C22H | 1.65 |
| 39 | 31.949 | 13-Docosenoic acid, methyl ester | 352.59 | C23H44O | 12.67 |
| 40 | 32.246 | 13-Docosenoic acid, methyl ester | 352.59 | C23H44O | 1.78 |
| 41 | 32.332 | 13-Docosenoic acid, methyl ester | 352.59 | C23H44O | 0.63 |
| 42 | 32.477 | 1-Docosene | 308.58 | C22H | 1.52 |
| 43 | 32.710 | 1-Docosene | 308.58 | C22H | 12.63 |
| 44 | 32.985 | Oxalic acid, allyl hexadecyl ester | 480.85 | C32H64O | 2.02 |
| 45 | 33.082 | Piperidinone,N-[4-bromo-n-butyl | 234.13 | C9H16BrNO | 1.05 |
| 46 | 33.104 | 13-Docosenoic acid, methyl ester | 352.59 | C23H44O | 0.58 |
| 47 | 33.410 | Cyclohexane,(1-butylhexadecyl)- | 126.24 | C9H18 | 13.42 |
| 48 | 33.590 | Cyclodocosane, ethyl- | 210.39 | C15H | 0.32 |
| 49 | 33.661 | 6-Nitroundec-5-ene | 199.29 | C11H21NO2 | 0.65 |
| 50 | 33.710 | Cyclodocosane, ethyl- | 210.39 | C15H | 0.40 |
| 51 | 33.777 | Oxalic acid, allyl hexadecyl ester | 480.85 | C32H64O | 0.64 |
| 52 | 33.821 | Oxalic acid, allyl hexadecyl ester | 480.85 | C32H64O | 0.30 |
| 53 | 33.883 | 13-Docosenoic acid, methyl ester | 352.59 | C23H44O | 0.44 |
| 54 | 34.321 | 6-Nitroundec-5-ene | 199.29 | C11H21NO2 | 12.21 |
| 55 | 34.554 | 13-Docosenoic acid, methyl ester | 352.59 | C23H44O | 0.32 |
| 56 | 34.682 | Oxalic acid, allyl octadecyl ester | 90.03 | C2H2O | 0.62 |
| 57 | 34.793 | Oxalic acid, allyl hexadecyl ester | 354.50 | C21H38O4 | 0.69 |
| 58 | 34.860 | Oxalic acid, allyl octadecyl ester | 90.03 | C2H2O | 0.50 |
| 59 | 35.038 | Oxalic acid, allyl hexadecyl ester | 354.50 | C21H38O4 | 1.25 |
| 60 | 35.304 | Cyclopentane, (4-octyldodecyl)- | 350.66 | C25H | 8.22 |
| 61 | 35.965 | Oxalic acid, allyl octadecyl ester | 90.03 | C2H2O | 0.18 |
| 62 | 36.787 | Oxalic acid, allyl hexadecyl ester | 354.50 | C21H38O4 | 0.01 |
| 63 | 36.858 | Oxirane, tetradecyl | 240.42 | C16H32O | 0.00 |
| 64 | 39.914 | Oxalic acid, allyl hexadecyl ester | 354.50 | C21H38O4 | 0 .00 |
Table 2: Composition of methanolic extracts of Musa acuminata peel
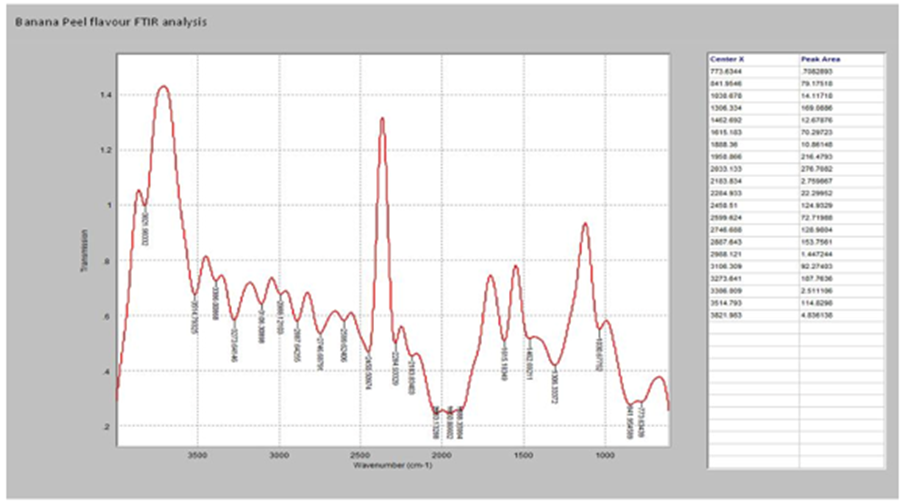
Graph 2: Peak lengths of functional groups present in banana (Musa acuminata) peels from FT-IR analysis.
| Wave number | Peak intensity | Peak shape | Bond | Compound |
| 773.6344 | Strong | Broad | Sp2 C-H out of plane bending | 1,2 disubstituted aromatic compound |
| 841.9546 | Strong | Broad | C=C bending or C-Cl stretching | Trisubstituted alkene |
| 1030.678 | Strong | Sharp | C-N stretching | Amine |
| 1306.334 | Strong | Broad | C-O stretching | Aromatic ester |
| 1462.692 | Medium | Broad | C-H stretching | Alkane |
| 1615.183 | Medium | Sharp | C=C stretching | Conjugated alkene |
| 1888.360 | Strong | Broad | C=O stretching | Ester, Anhydride |
| 1950.866 | Weak | Broad | C-H bending | Aromatic compound |
| 2033.133 | Strong | Broad | N=C=S stretching | Isothiocyanate |
| 2183.834 | Medium | Broad | C≡C stretching | Alkynes |
| 2284.933 | Strong | Sharp | N=C=O stretching | Isocyanate |
| 2450.510 | Strong | Sharp | O=C=O Stretching | Carbon iv oxide |
| 2599.624 | Weak | Sharp | S-H stretching | Thiol |
| 2746.688 | Medium | Sharp | C-H stretching | Alkane |
| 2887.643 | Medium | Sharp | N-H stretching | Amine salt |
| 2988.121 | Weak | Sharp | O-H stretching | Alcohol |
| 3106.309 | Medium | Sharp | C-H stretching | Alkene |
| 3273.641 | Medium | Sharp | C-H stretching | Alkyne |
| 3386.009 | Weak | Sharp | N-H stretching | Aliphatic pri amine |
| 3514.793 | Strong | Sharp | N-H stretching | Primary amine |
| 3821.983 | Medium | Sharp | O-H stretching | Free alcohol |
Table 3: functional groups, bond type, peak intensity and wave number of banana (Musa acuminata) peels
The utilization of banana (Musa acuminata) peels, a common agricultural waste, has gained interest due to their potential bioactive components and nutritional value. This study investigates the proximate composition and bioactive compounds in banana peels using advanced analytical techniques.
The proximate composition and bioactive components of Musa acuminata (banana) peels reveal significant nutritional and potential health benefits, highlighting the potential for utilizing this agricultural byproduct in various applications. The results of the proximate composition analysis, as presented in Table 1, show that banana peels have considerable amounts of moisture, carbohydrates, ash, crude fiber, protein, and crude fat.
The moisture content of the banana peels was found to be 7.36 ± 0.37%. This value is relatively low, which is advantageous for the storage and preservation of banana peels as a raw material. In comparison, a study by Anhwange et al. [3] reported a moisture content of 10.5% in banana peels, indicating slight variability that could be attributed to differences in banana species, geographical location, or drying methods used. Lower moisture content, as observed in this study, may reduce microbial activity and prolong the shelf life of the peels.
The carbohydrate content in the banana peels was measured at 23.15 ± 0.05%. This is consistent with previous findings by Emaga et al. [1], who reported carbohydrate contents ranging from 23.6% to 30.0%. Carbohydrates in banana peels primarily consist of dietary fibers and sugars, which contribute to their potential as a functional food ingredient. The presence of carbohydrates, particularly non-digestible fibers, can aid in digestive health and act as prebiotics, promoting the growth of beneficial gut bacteria.
The ash content, indicative of the total mineral content, was found to be 12.11 ± 0.09%. This value is higher than that reported by Emaga et al. [1], which documented ash content of around 8.9%. The elevated ash content suggests a richer mineral composition, which could include essential elements such as potassium, calcium, and magnesium. High ash content can enhance the nutritional value of banana peel-derived products, making them suitable for supplementation in animal feeds or as a mineral-rich ingredient in human diets.
Crude fiber content was measured at 30.53 ± 0.77%, which is notably high. Previous studies by Mohapatra et al. [12] reported crude fiber content in the range of 6-12%. The significantly higher fiber content observed in this study underscores the potential of banana peels as an excellent source of dietary fiber. High dietary fiber intake is associated with numerous health benefits, including improved bowel movements, reduced cholesterol levels, and better glycemic control [13].
The protein content of banana peels was found to be 16.42 ± 0.45%. This value is higher compared to the findings of Oliveira et al. [14], who reported protein content of approximately 6-9%. The higher protein content observed in this study highlights the potential of banana peels as a supplementary protein source, particularly in regions where protein malnutrition is prevalent. The amino acid profile of banana peel proteins, although not analyzed in this study, should be investigated to determine their nutritional quality and bioavailability.
The crude fat content was measured at 10.43 ± 0.67%. This value is consistent with the findings of some previous studies but slightly higher than the 3.8% reported by Mohapatra et al. [12]. The higher fat content could be beneficial for energy-dense food formulations and could provide essential fatty acids that play a crucial role in cellular functions and overall health [15]
Comparing the results of this study with previous research, it is evident that there is variability in the proximate composition of banana peels, likely due to differences in banana varieties, growing conditions, and processing methods.
The gas chromatogram of the methanolic extracts of banana peels demonstrated the presence of various chemical constituents, highlighting the complexity and richness of the banana peel matrix. The analysis identified several key compounds with varying concentrations. The major constituents include 13-Docosenoic acid, methyl ester (12.67%), 1-Docosene (12.63%), Cyclohexane, (1-butylhexadecyl)- (13.42%), and Octadecanal (9.45%). These findings are consistent with previous studies that have reported fatty acids, esters, and aldehydes as significant components in banana peels [1,5].
The high concentration of 13-Docosenoic acid, methyl ester (also known as erucic acid methyl ester) suggests that banana peels are a rich source of long-chain fatty acids. These compounds are known for their potential health benefits, including anti-inflammatory and lipid-lowering effects [16]. The presence of other esters, such as Oxalic acid, allyl hexadecyl ester, in multiple forms, further supports the nutritional and therapeutic potential of banana peels.
Octadecanal, a long-chain aldehyde, was also found in significant amounts. Aldehydes in plant materials are often associated with antimicrobial properties [17]. The identification of various hydrocarbons, such as 1-Docosene and Cyclohexane derivatives, indicates the presence of non-polar bioactive compounds, which could contribute to the overall bioactivity of the extracts.
The presence of bioactive compounds in banana peels has been extensively documented in the literature. For instance, Sulaiman et al. [4] reported the identification of several phenolic compounds, including gallocatechin, epicatechin, and catechol, which were not specifically identified in our study but are indicative of the peel’s antioxidant potential. The variations in compound identification could be attributed to differences in extraction methods, analytical techniques, and the maturity of the banana peels used.
Previous studies have highlighted the antioxidant properties of banana peels, attributed to the presence of phenolic compounds [18]. Although our analysis did not explicitly identify phenolics, the presence of fatty acids, esters, and aldehydes suggests potential antioxidant activity. The compounds identified, such as erucic acid methyl ester and octadecanal, are known to exhibit antioxidant properties, supporting the hypothesis that banana peels can serve as a valuable source of natural antioxidants.
The identification of compounds like 1-Heptanol, 7-chloro- (2.85%) and 2-Piperidinone, N-[4-bromo-n-but (3.47%) indicates potential antimicrobial activity. Similar findings have been reported by other researchers who noted the antimicrobial properties of banana peel extracts against various pathogens [19,20]. These compounds could be explored further for their use in natural antimicrobial formulations.
The FT-IR analysis of banana peels revealed a diverse array of functional groups and bond types, indicative of the complex biochemical composition of the peels. The detailed results are presented in Table 3. The FT-IR analysis identified various functional groups, including aromatic compounds, alkenes, amines, esters, anhydrides, isothiocyanates, alkynes, isocyanates, carbon dioxide, thiols, alcohols, and primary amines. These findings are consistent with previous studies on the proximate composition and bioactive components of banana peels.
For instance, Sharma et al. [21] identified similar functional groups in their FT-IR analysis of banana peel extracts. They reported the presence of C-H, C=O, C-N, and O-H stretching vibrations, which correspond to alkanes, esters, amines, and alcohols, respectively. These similarities suggest a consistent biochemical composition across different banana peel samples, despite potential variations in environmental and genetic factors.
The peak intensities and shapes observed in this study align with previous research findings. The strong, broad peaks at 773.6344 cm-1 and 841.9546 cm-1, corresponding to 1,2 disubstituted aromatic compounds and trisubstituted alkenes, were similarly reported by Oliveira et al. [14]. These broad peaks indicate significant structural complexity and the presence of conjugated systems within the banana peel matrix.
Furthermore, the medium and sharp peaks observed at 1462.692 cm-1 and 2887.643 cm-1, associated with C-H stretching in alkanes and N-H stretching in amine salts, respectively, were also identified in previous studies. According to Waliszewski et al. [22], such peaks are indicative of the presence of lipophilic compounds and proteinaceous materials in banana peels.
Some unique peaks identified in this study, such as the strong and sharp peaks at 2450.510 cm-1 (O=C=O stretching, carbon dioxide) and 3821.983 cm-1 (O-H stretching, free alcohol), highlight additional components that may not have been as prominently reported in earlier studies. These findings could indicate variations in the sample preparation or the specific analytical techniques employed.
In their comprehensive analysis, Bhardwaj et al. [23] noted that such variations could result from differences in the geographical origin of the banana samples, the degree of ripeness at the time of analysis, and the specific methods used for sample extraction and preparation. These factors underscore the importance of standardized methodologies to enable more accurate comparisons across studies.
Banana peels possess significant nutritional and bioactive components, highlighting their potential for various applications, including functional food ingredients and nutraceuticals. Further studies are needed to explore their specific health benefits and industrial applications.
Dear Editorial Team, Clinical Medical Reviews and Reports. My experience with the journal was highly positive. The peer-review process was rigorous, constructive, and completed in a timely manner. The reviewers provided valuable comments that helped improve the quality and clarity of our manuscript. The editorial office was professional, responsive, and supportive throughout all stages of the publication process. Communication was clear and efficient, and any questions were addressed promptly. Overall, I found the journal to maintain high scientific standards and an excellent publication workflow. I would be pleased to consider submitting future work to this journal. Best wishes from, Elena Popa.

It was my pleasure to submit my testimonial concerning the Reviewer Board of our Scientific Journal “Brain and Neurological Disorders”. The Reviewers focused on some modifications and their contribution was helpful. The ladies of our Editorial Office were also supported my efforts. It was my honor to have such a co-operation and I am looking forward for more collaboration.

Dear Grace Pierce, Editorial Coordinator of Journal of Clinical Research and Reports, Thank you for the speedy and efficient peer review process. I appreciate the fact that your peer reviewers do not take months to respond like with some other journals. I would also like to thank the editorial office for responding quickly to my questions. It is an excellent journal. I plan to submit more manuscripts in the future. Best wishes from, Robert W. McGee

Dear Grace Pierce, Editorial Coordinator of Journal of Clinical Research and Reports, Working with you and your team on our recent publication in JCRR has been a truly wonderful and enjoyable experience. The responses were prompt, and the reviewers were patient, constructive, and highly professional. One reviewer in particular gave me the feeling that a professor was carefully reading and commenting on my coursework, which was deeply touching. The entire process was straightforward and hassle‑free, with no tedious online forms to complete. I highly recommend this journal. Best wishes from, DR Aibing Rao, Head of R&D

I Appreciate the Opportunity to Share my Experience with the Journal of Clinical Research and Reports. The peer review process was timely and constructive, and the feedback provided helped improve the quality of our manuscript. The editorial office was professional, responsive, and supportive throughout the process, ensuring smooth communication and efficient handling of the submission. Overall, it was a positive experience collaborating with your team.

Dear Mercy Grace, Editorial Coordinator of Obstetrics Gynecology and Reproductive Sciences, We would like to express our gratitude for your help at all stages of publishing and editing the article. The editors of the magazine answer all the necessary questions and help at every stage. We will definitely continue to cooperate and publish other works in the Obstetrics Gynecology and Reproductive Sciences! Best wishes from, Alla Konstantinovna Politova,
