
Research Article | DOI: https://doi.org/10.31579/2637-8914/252
1 Laboratory of Toxicology & Pharmacology, Department of Biochemistry, Faculty of Science, University of Yaounde 1, BP 812, Yaounde Cameroon.
2 Agri-Food Safety and One Health Agency (AFS1HA), Yaounde Cameroon.
3 Integrated Health for All Foundation (IHAF) Cameroon.
4 Department of Biochemistry, Faculty of Science, University of Buea, PO Box 63, Buea, Cameroon.
*Corresponding Author: Wilfred A. Abia, Department of Biochemistry, University of Yaounde 1, Yaoundé, Cameroon. email: abiawilfred@gmail.com
Citation: Dimala S. Charlette, Aseneck A. Marchel, Kamal A. Hassan, Achidi U. Aduni, Tchana N. Angele, and Wilfred A. Abia (2024)., Food Security, Dietary Intake, Foodways, and Aflatoxins-Food Safety Levels amongst the Elderly Population (50 Years and Above) of Obam Ongola Community in Yaoundé, Cameroon, J. Nutrition and Food Processing, 7(11); DOI:10.31579/2637-8914/252
Copyright: © 2024 Wilfred A. Abia. This is an open access article distributed under the Creative Commons Attribution License, which permits unrestricted use, distribution, and reproduction in any medium, provided the original work is properly cited.
Received: 19 July 2024 | Accepted: 20 August 2024 | Published: 04 September 2024
Keywords: aflatoxins; food in-/security; dietary intake; foodways; dietary aflatoxins exposure; food safety; malnutrition-risk factor; elderly people’s health
This cross-sectional study assessed the levels of food security, dietary intake, foodways, and dietary aflatoxin (FSDIFWDA) exposures amongst the elderly population in Obam ongola in Yaoundé Cameroon. A FSDIFWDA awareness survey was carried out using a semi-structured questionnaire. Food security categories were determined using Household Food Insecurity Access Scale. Dietary intake was determied by converting food intake to energy and nutrients using macronutrient values of local meals of some Cameroonian traditional communities. Sociodemographic parameters were exploited to determine foodways. Nnam owondo (NO) samples were analyzed for aflatoxin using ELISA kit. Results showed that 62.5% (45/72) were food-secure sub-populations. Foodways varied partly due to average monthly household income vis-à-vis the number of people in a household and marital status. All NO samples were tainted with aflatoxins (mean: 16.7, range: 0.13-32.3 µg/Kg), with an estimated margin of exposure value of 0.013. Thus, NO consumers are exposed to aflatoxins, needing public health attention.
UNDESAPD : United Nations Department of Economic and Social Affairs Population Division
IARC : International Agency for Research on Cancer
JECFA : Joint FAO/WHO Expert Committee on Food Additives
EFSA : European Food Safety Authority).
CAST : Council for Agricultural Science and Technology (Task Force Report No. 139).
CAC : Codex Alimentarius Commission
HFIAS : Household Food Insecurity Access Scale
AFT : Aflatoxins
NO : Nnam owondo
EDI : Estimated Daily Intake
BMDL : Benchmark dose lower limit
MOE : Margin of Exposure
F : Food secure
FinS : Food insecure
n Number of participants consuming less than the recommended values.
n>RV : Number of participants consuming the recommended values
AHMI : average household monthly income;
NPW_DHMI : number of people who depend on the AHMI.
Fcfa :Franc de la Communauté Financière Africaine (African Financial Community Franc) – local currency in Cameroon
M : Married
S : Single
W : Widow
n.d. : not detected
The global demographic structure of the population is changing dramatically, notably in Africa, due to several social and economic milestones (United Nations Department of Economic and Social Affairs Population Division, UNDESAPD, 2019). A demographic transition from predominantly young to old population is gradually taking place. The number of persons aged 50 years or older worldwide is projected to grow to almost 2 billion by 2050 (Morley and Thomas, 2007). Aging is accompanied by changes that cause adults to become more vulnerable to disease.
The rapidly growing population in Africa is a concern, particularly in sustaining their health and nutritional status. Malnutrition in old age people is associated with both short- and long-term negative health outcomes (Bain et al., 2013). However, the reported burdens of malnutrition are fragmented and inconsistent, where more compiled evidence is warranted to aid decision-makers (Ahmed and Netsanet, 2022). The risk of malnutrition among older people in Africa is a major challenge to the healthcare system and needs special and urgent attention. The usual food production practices, marketing style, and living standards have all contributed to an increase in the use of low-cost, packaged products that are high in fat, energy, and salt, yet low in nutritional quality.
More importantly, poor infrastructures and limited access to healthcare services are factors that contribute to the overwhelming levels of malnutrition and food insecurity on the continent. Several Studies on the nutritional status of elderly people aged 50 years and above have been conducted in Africa but do not agree on the tools and methods of assessment (Shuremu, Belachew and Hassen, 2023). There are inadequate reports in this domain. However, studies on the socio-economic situation of the elderly in Cameroon revealed that in 2010, 47.5% of the elderly were of moderate economic vulnerability, 39.6 % were in severe economic vulnerability, 2.9 % were hypertensive, and 5.7 % had a disability (Mabiama, 2022). On the other hand, information concerning their food security level, nutritional status, and their eating behavior is still vague (Mabiama, 2022).
Aflatoxins are well-known carcinogenic food contaminants that exert toxic effects on consumers after ingestion of contaminated food. It is classified by the International Agency for Research on Cancer (IARC, 2012) as a group 1 human carcinogen. Preliminary reports on aflatoxins from Cameroon revealed its high occurrence frequencies in occasionally high amounts exceeding regulatory limits (Tchana et al., 2010; Abia et al., 2013a,2017), with groundnuts being the most vulnerable commodity. This speculates the possibility of contamination of the popular dish Nnam owondo in Obam ongola with aflatoxins.
Therefore, this paper reports on the dietary intake, foodways (cultural, and socio-economic practices that affect food access, consumption, and preference), and aflatoxins food safety levels of the older adults in Obam ongola, Cameroon, which may provide vital information on factors and or behaviors influencing their health.
2.1. Participants and Setting
This descriptive cross-sectional study was conducted in an urban setting in Yaoundé Cameroon, Obam ongola, in Yaoundé III sub-Division, Cameroon. This quarter is mostly made up of the Beti, Ewondo, and Bulu people of the Central region of Cameroon. This study site was considered suitable for this study on food security/safety, food quality, and foodways, considering it is amongst the closest villages to the heart of the cosmopolitan administrative capital city of Cameroon, Yaoundé, but still practice their village lifestyles. Additionally, it is ideal for elderly people over 50 years and who have lived in the same locality for at least 5 years, when considering the chaotic nature of city life and space. After discussing this study with the elder people and in the presence of a son/daughter, the elderly people (age > 50 years) who voluntarily accepted to participate in this study and ascertained by signing an informed concern form (N=72,) were considered as participants.
2.2. Measures
2.2.1. Questionnaires, food sampling and anthropometric measures
Questionnaire
Structured questionnaires were interviewer-administered by the researchers in either English or French depending on the language spoken and understood by each participant. There were different sections on the questionnaires and each of them had a specific focus. Section one of the questionnaire was focused on sociodemographic variables. questions included information on house type, house ownership, the highest level of education completed marital status, household density, household income, number of people in the household financially supported by household income.
Section two consisted of the household food insecurity access scale (HFIAS), made up of nine questions, that reflect concerns about access to food (question 1), insufficient food quality (questions 2-4), and insufficient food intake and its physical consequences (question 5-9) within the previous 3 days. Each question that elicited a “yes” response was followed by a frequency of occurrence question with three options: “rarely”, “sometimes” and “often”. Responses were scored (“no” = 0, rarely = 1, sometimes = 2, often = 3) and the scores were summed. The continuous scores were divided into four categories, representing food secure (0-1), mildly (2-8), moderately (9-16), and severely food insecure (17-27) households, according to the categorization scheme in the HFIAS indicator Guide. A binary variable was created by combining food secure and mildly food insecure categories and classifying them as “food secure”, while the moderate and severely food insecure categories were combined and classified as “food insecure”.
The third section of the questionnaire was a 3-day food frequency questionnaire (including food variety, ingredients, amongst others), where was recorded the frequency of foods consumed during the previous 3 days. The amount of food consumed was reported in household measures or volumes and was converted to grams using the US measurements. Food intake was converted to energy and nutrients using macronutrient values of local meals of some Cameroonian traditional communities (Nyangono et al., 2021).
Food sampling
The cooked groundnut-based paste, Nnam owondo (NO), was identified to be commonly produced and sold by several households in the study locality. Therefore, during the survey, samples of NO were purchased from 26 randomly selected participating households with one or more elderly persons (aged 50 years and above), transported to the laboratory of Food, Health and Environment of the IMPT, and stored at -4 oC until analysis. Nnam owondo sample collection and the subsequent aflatoxins analysis were performed within the framework of our ethical clearance (CE No 1932/CRERSHC/2020) secured from the National Ethical Committee for Human Health and Research (NECHHR).
Anthropometric Measurements
During the questionnaire administration, the height and weight of participants were taken without them wearing shoes. Height was measured and recorded to the nearest 0.1 cm. Weight was measured to the nearest 0.1 kg on a calibrated, electronic scale. The body mass index (BMI) was calculated as kilograms divided by meters squared and categorized as either underweight (<18>
2.2.2- Dietary levels of total aflatoxins (AFT) in the delicacy of the Obam ongola people, Nnam Owondo (NO)
NO samples were analyzed using a direct competitive ELISA (Enzyme-Linked Immuno-Sorbent Assay, PriboLab, (Pte. Ltd. Singapore, EKT-011-48/96T) kit according to the manufacturer’s description. In brief, the analysis was made in two stages.
The first stage consisted of sample preparation. For this, each NO sample was brought to room temperature (25±1 °C) and thoroughly mixed. 5 g of each sample was carefully taken from several spots (CAST, 2003; EC, 2023), and weighed using a graduated balance (500g/0.1g) into a 50 mL Falcon tube. 25 mL of the extraction solution (Methanol–Distilled water; v/v; 70:30) was added into each Falcon tube containing 5 g of each sample and mixed using a vortex mixer (Thermo Scientific, Vortex Maxi Mix) for 10 mins. Thereafter, each mixture was centrifuged at 4000 rpm for 20 mins using a centrifuge machine (Centrifuge; ROTOFIX 32 A). Then, 200 µL of each of the supernatant was transferred into a fresh Eppendorf tube (1.5 mL) with the aid of a micropipette. 300 µL of sample diluent solution A was added into each of the Eppendorf tubes bringing the volume to 500 µL.
The second stage consisted of quantifying aflatoxins in the samples for the analysis of total aflatoxins (AFT) using the ELISA Kit. Standard solutions and samples were all prepared and analyzed under the same conditions and in duplicates. 50 µL of each standard solution (with total aflatoxins levels: 0, 0.25, 0.5, 1.0, and 2.0 ng/mL), as well as each Nnam owondo extract solution, was placed into a corresponding well in duplicated. Into each of the wells containing either a standard solution or a sample extract solution, was added 50 µL of the aflatoxin antibody. The microtiter plate was then covered with aluminum foil and mixed gently by rocking the plate manually for approximately 1 minute and thereafter incubated for 20 minutes at room temperature (25±1 °C) in the dark. The content of each well in the microtiter plate was washed away with 1x washing buffer (approximately 300 µL /well) 4⁓5 times at 10-second intervals and the microplate was gently taped on an absorbent paper towel to dry the wells. 50 µL of substrate solution was later added into each well and mixed gently by rocking the plate manually. The microplate containing the standard solutions and the sample extract solutions was then incubated at room temperature (37 ℃) for 10 minutes in the dark. Thereafter, 50 µL of stop solution was added into each well and mixed gently by rocking the plate manually. Then, the absorbance of each microwell was read on an ELISA microplate reader (‘EL 800 Biotek Instruments Inco, Winooski, VT, VS’) at 450 nm wavelength. Standard solutions of total aflatoxins at different concentrations (0, 0.25, 0.5, 1, and 2 ng/mL) were used to plot a calibration curve which was used to calculate the total aflatoxins content of each sample.
The aflatoxins dietary exposure assessment was performed using the dietary intake of aflatoxins of participants in this study following NO consumption. It was calculated as an individual estimated daily intake (EDI).
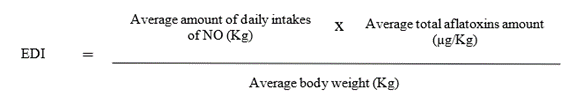
Aflatoxin health risk assessment was performed based on the Margin of Exposure (MOE) approach proposed by the European Food Safety Authority (EFSA, 2005; 2017). The health risk associated with Nnam owondo consumption vis-à-vis the aflatoxins contents in the studied Nnam owondo samples was calculated using the Margin of Exposure (MOE) (EFSA, 2005). This was linked to dietary total aflatoxins exposures as assumed by the European Food Safety Authority (EFSA)’s Scientific Panel on Contaminants in Food Chain, CONTAM (EFSA, 2007, 2020) and the Joint WHO/FAO European Committee on Food Additives, JECFA (FAO/WHO, 2018). The equation below was used to calculate the MOE.
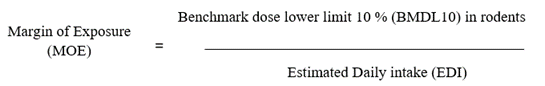
The observed MOE value was interpreted as follows (EFSA, 2005, 2007, 2020; Scientific Committee on Food, 2019) as a public health concern (MOE<10>1,000,000).
2.3. Data Analysis
Considering that participants generally used measurements such as cups, and estimated them as small, medium, or large, all participants in this study were found to use the medium size (2 cups being equivalent to 400g) using the table contents of macronutrients values per 100g of food consumed from some Cameroonian traditional dishes. The value was converted to 400g after which we summed the macronutrient intakes for each of the three days and divided them by three to have the average of macronutrients consumed per day.
Data collected from the investigation were edited in Microsoft Excel 2013 and descriptive statistics were applied to summarize data as frequencies and percentages. The statistical software Stat Graphic Centurion XV version 16.1.18 (Stat Point Technologies, Inc., Virginia, and USA) was used to perform Analysis of variance on the AFT contents of samples.
3.1- Food security
After analyzing the HFIAS questionnaire, considering the 72 participants (48 elderly males, 66.67%; and 24 elderly females, 33.33%), there were more food-secure males (45.80%) when compared to food-insecure males as opposed to the equality in female food secured vis-à-vis food insecure populations. Altogether, 62.50% of the total study participants were food secure, while 37.50% were food insecure as seen in Table 1.
| Parameter | Food security or insecurity situation (%) | ||
| Elderly women (n=24) | Elderly men (n=48) | Total (N=72) | |
| Food secure (FS) | 12 (16.67) | 33 (45.80) | 45 (62.50) |
| Food insecure (FinS) | 12 (16.67) | 15 (20.80) | 27 (37.50) |
| Total | 24 (33.33) | 48 (66.67) | 72 (100.00) |
Table 1: Percentage of food secure and food insecure participants
In addition, more food insecure participants were found to be in a state of underweight (7,41%), or normal weight (59,26%) while more food secure participants were found to be in a state of overweight (28.89) and obese (17.78) as shown in table 2.
| Parameter | Frequency (Percentage) | ||||
| Underweight | Normal weight | Overweight | Obese | Total | |
| Food secure (FS) | 3 (6.67) | 21 (46.67) | 13 (28.89) | 8 (17.78) | 45 |
| Food insecure (FinS) | 2 (7.41) | 16 (59.26) | 7 (25.93) | 2 (7.41) | 27 |
| Total | 5 (6.94) | 37 (51.39) | 20 (27.78) | 10 (13.89) | 72 |
Table 2: Food security or insecurity situation as against weight
3.2- Dietary intake
Analysis of the food frequency questionnaire revealed that, out of the 72 participants that were recruited, 36% consumed less than the recommended value of energy, proteins, and carbohydrates. Most men (67%) and women (58%) had the recommended energy intake. Most men (69%) and women (54%) had the recommended protein intake. 58% of males consume the recommended value of carbohydrates while 75% of women consume the recommended value of carbohydrates, as shown in the table below (Table 3).
| Mean intake value (Range) | n | n>RV (%) | ||
| Males (>50 years old) | Energy (KCal) | 2026 (926 - 3200) | 16 (33) | 32 (67) |
| Protein (g) | 57.2 (1.1 - 80.7) | 15 (31) | 33 (69) | |
| Carbohydrate (g) | 132 (40 -168) | 20 (42) | 28 (58) | |
| Females (>50 years old) | Energy (KCal) | 1612 (425 - 2785) | 10 (42) | 14 (58) |
| Protein (g) | 63.3 (9.6- 475.8) | 11 (46) | 13 (54) | |
| Carbohydrate (g) | 151.2 (13 - 381) | 6 (25) | 18 (75) | |
| Female and Male | Energy (KCal) | 1819 (425 - 3200) | 26 (36) | 46 (63.8) |
| Protein (g) | 60.3 (1,1-475.8) | 26 (36) | 46(63.8) | |
| Carbohydrate (g) | 141.6 (13 - 381) | 26 (36) | 46 (63.8) |
Table 3: Mean values of intakes of energy and macronutrients (proteins, and carbohydrates); and percentage of participants (males: n=48, and females: n=24) who were found to consume less than (n
The study equally revealed that more than 26% and 40% of food-secure and food-insecure participants respectively, were found to consume less than recommended values for energy, protein, and carbohydrates (Table 4).
| Number (percentage) of FS consuming | |||
Energy (kcal) | Protein (g) | Carbohydrates (g) | |
| Food-secure participants (n=45) | 12 (26.7) | 14 (31.1) | 15 (33.3) |
| Food-insecure participants (n=27) | 14 (51.9) | 12 (44.4) | 11 (40.7) |
NB: FS: Food-secure; Table 4: Number (percentage) of food secure and food insecure participants consuming less than the recommended value for energy, protein, and carbohydrates. 3.3-Foodways a)- Cultural aspect The table below (Table 5) gives the 4 most eaten dishes in the Obam-ongola community, and the ingredients used to prepare them. Their main dishes are “okok sucré”, “Sanga”, “Nnam owondo”, and “kpem” The Table clearly shows that Nnam owondo is more frequently consumed than the rest of the dishes (on average 3 days per week). 3 days per week Table 5. Food variety, ingredients, and intake frequency b)- Social aspect Analysis of sociodemographic parameters showed that food-secure participants have the highest average monthly income (282,750-franc cfa) with the lowest number of people who depend on household monthly income (1-4 people), while food-insecure participants have the lowest average monthly income (108,370-francs cfa) with the highest number of people who depend on household monthly income (1-8 people). Furthermore, as observed from Table 6, 17 participants were either singles or widows (as opposed to 55 married participants). Additionally, many more singles/widows (44.4%, 12/27) were found to be food insecure, in contrast with the many more married participants (88.9%, 40/45) who were food secure. Total (Fcfa) Number of married people (%) Men Women AHMI: average household monthly income; NPW_DHMI: number of people who depend on the AHMI. Table 6: Socio-demographic parameters 3.4- Measurement of aflatoxins in Nnam owondo. All the 26 studied NO samples were tainted with total aflatoxin at a mean (range) level of 16.67 (0.13-32.26) µg/Kg. Twelve samples (n=12/26, 46%) had mean total aflatoxins values (4.09, range: 0.13-8.93 µg/Kg) less than the Codex Alimentarius Commission (CAC) fixed maximum tolerable level (MTL) of 10 µg/Kg (CAC,2015). On the other hand, 14/26 (54%) of studied samples had mean total aflatoxin values (27.45, range: 14.22-32.26 µg/Kg) higher than the CAC fixed MTL of 10 µg/Kg (CAC,2015) (Table 7). Concentration of AFT (µg/Kg) Table 7: Levels of aflatoxin in Nnam owondo and the extent to which dietary levels exceed Codex Alimentarius 10 µg/Kg (CAC,2015) regulatory limits in food destined for human consumption. The estimated daily intakes (EDI) of Nnam owondo for the studied population in Obam Ongolo community, as well as the calculated margin of exposure (MOE), are presented in Table 8. The average amount of daily NO intake of randomly selected 26 participants from the households where food samples were collected was 123 g, and the average of their body weights was 68.44 Kg. Additionally, the MOE was calculated based on the EFSA (2015, 2020) accepted benchmark dose level 10 (BMDL10) for rodents, 0.0004 µg/Kg bw/d. On the above-mentioned basis, an average EDI of 0.029 µg/Kg and MOE of 0.013 were obtained. Samples with AFT levels above 10 µg/Kg CAC fixed MTL (n=14) CAC,2015) Estimated Daily amount of NO intake (Kg): Estimated AFT daily intake (EDI) (µg/Kg): Table 8: Aflatoxins dietary exposure levels, and estimated margin of exposures (considering benchmark dose level 10 (BMDL10 0.0004 µg/Kg bw/d) for rodents)Types of foods Ingredients Average intake frequency (Numbers of days per week) Okok sucre At least twice a week Sanga Once a week Nnam wondo Kpem Once a week AHMI (Fcfa) Number of Singles and Widows (%) Range of the NPW_DHMI per household Food secure (n=45) 159,000 123,750 282,750 5 (11.1) 40 (88.9) 1-4 Food insecure (n=27) 37,820 70,550 108,370 12 (44.4) 15 (55.6) 1-8 NO Sample code AFT levels below 10 µg/Kg CAC fixed MTL (CAC,2015) AFT levels above 10 µg/Kg CAC fixed MTL (CAC,2015) 1 5.41 2 0.57 3 8.49 4 26.98 5 14.22 6 8.93 7 0.13 8 7.17 9 31.38 10 32.26 11 30.94 12 30.94 13 25.66 14 24.78 15 26.10 16 25.66 17 29.62 18 23.02 19 32.26 20 30.50 21 2.77 22 2.77 23 1.01 24 1.45 25 5.41 26 4.97 Minimum [AFT]: 0.13 0.13 14.22 Maximum [AFT]: 32.26 8.93 32.26 Mean [AFT]: 16.67 4.09 27.45 Parameter All samples (N=26) Samples with AFT levels below 10 µg/Kg CAC fixed MTL (n=12) (CAC,2015) Average body weight (Kg): 68.44 68.44 68.44 Average AFT levels (µg/Kg): 16.67 4.09 27.45 0.123 0.123 0.123 0.029 0.007 0.049 Margin of Exposure (MOE) 0.013 0.054 0.008
This study which sets out to investigate the food-secure/-insecure levels, foodways, and food safety from aflatoxins exposure perspectives amongst the elderly people in the Obam ongola community in the central region of Cameroon has provided vital information that can be exploited to improve upon the nutritional status and health of the elderly in similar communities.
4.1. Food insecurity level
Findings from this study revealed that 62.5% (45/72) of the older adults of Obam-ongola were food secure, as opposed to 37.5% (27/72) who were food insecure. The percentage of food-secure elderly people was relatively higher than that of the food-insecure and an association was made between food insecurity level and marital status, with singles, widows, and or divorced being most affected by food insecurity. Our results are in line with that of a similar study carried out amongst the elderly populations in Sharpeville, South Africa by Oldewage-Theron and Egal (2021), where they obtained a prevalence of food security of 60% (which is numerically higher than that of food insecurity) and they also observed an association between food security level and marital status: married couples being more food secure and vice versa for those who were singles, widows, and or divorced. The findings from this current study also corroborate with that reviewed by Saha et al. (2021) on the prevalence of food insecurity and the related contributing factors of food insecurity among older adults in Sub-Saharan Africa. Saha et al. (2021) revealed marital status, specifically, widows and or divorced individuals were the most food insecure. Furthermore, the finding from this present study is in line with that of Karla et al. (2007) who reported that marital status was associated with food insecurity, especially among widow men. According to Lee et al. (2020), widows and or divorced individuals are very exposed to depression which greatly contributes to food insecurity. This is understandable considering that divorce and the loss of a spouse are emotionally challenging experiences. The stress and grief associated with these events can impact an individual's mental well-being, potentially affecting their appetite and eating habits. Emotional distress may lead to a decrease in appetite or an increase in unhealthy eating behaviors, contributing to food insecurity or nutritional deficiencies.
Altogether, when considering the relatively high number of participants in lower-income households, it is evident that participants with low monthly income tend to have more responsibilities (e.g. children) than participants with higher monthly income. Our findings are in concordance with those of Ihabi et al. (2013) and Mukherjee et al. (2021) who revealed a negative association between total household income and household food insecurity status. This shows that arise in the monthly household income may reduce the odds of being food insecure. This can be justified by the fact that income determines a household's purchasing power. Higher incomes enable households to afford an adequate quantity and quality of food. Adequate income ensures that households can purchase a diverse range of nutrient-rich foods, including fruits, vegetables, and protein sources. On the other hand, low-income households may struggle to afford enough food or may rely on cheaper, less nutritious options.
Furthermore, Divorce and widowhood often result in a significant change in financial circumstances. Individuals may experience a decrease in household income due to the separation of assets or the loss of a spouse's income. This financial strain can make it challenging to afford an adequate and nutritious diet, as a significant portion of income may need to be allocated to other expenses like housing, legal fees, or medical costs.
4.2. Dietary intake
Regarding dietary intake level, we found out that the median energy daily intake for female elderly (1612 KCal) was relatively lower than that of males (2026 kcal). Our results corroborate with that of a similar study conducted in the North-West region of Cameroon that revealed median energy daily intake for female elderly to be relatively lower than that of males in the same community (Mbah, 2020).This could be associated with the persistent gender discrimination in Africa. Within households, men and male children are prioritized when it comes to food allocation, leaving women and girls with limited access to sufficient and diverse diets. These findings are in line with that of Frumence et al. (2023) who found an association between gender inequality and women's dietary intake. In many African societies, there are certain traditions and food taboos that greatly influence the overall nutritional status of women. For instance, in some societies, women and girls eat what is left by men and boys and they are not allowed to eat smelly foods like meat and fish.
Furthermore, the relatively lower dietary intake of women as compared to men could be linked to the fact that most of the female participants were single mothers (widows or unmarried) with low monthly incomes. Widows or single women with children may face financial challenges, as they may be the sole breadwinners or have limited access to resources. This can restrict their ability to afford nutritious food, leading to compromising dietary intake. Most of the time, they eat less so that their children can have more to eat. These findings are in agreement with those of Odunitan-Wayas et al. (2021). An association was made between food security /insecurity state and dietary intake. diet quality and nutritional status decrease as household food insecurity worsens. Zalilah and Tham (2002).
In Cameroon, the national food value composition table is non-existent to our knowledge but a reflective food macronutrient value composition table for some local foods does exist (Nyangono et al., 2021). Based on the food macronutrient value composition table, macronutrient values per 100g of food consumed by some Cameroonian traditional dishes were computed and data provided (Supplementary Table 1a, and 1b), and further summarized in Tables 3 and 4. Out of the 72 participants that were recruited, 36% consumed less than the recommended value of energy, proteins, and carbohydrates. Most men and women had the recommended energy intake. Similarly, most men and women had the recommended protein intake. Most males and females consumed the recommended value of carbohydrates. This could be explained by the fact that the study area is a village located at the border of an urban area, made up of the Beti, Ewondo, and Bulu tribes who have preserved their cultures and traditions. Women indulge in cultivation while men still practice hunting and fish farming. crops grown in the area include starchy foods, notably cassava, relatively rich in carbohydrates, peanuts (rich in proteins and lipids), and palm nuts.Moreover, the dietary patterns of a population are determined by its foodways. Cultural and social norms guide the composition, frequency, and timing of meals, as well as the selection and combination of ingredients. For instance, some cultures have plant-based diets while others may have diets rich in animal products or specific culinary traditions. These dietary patterns influence the overall nutrient intake and health outcomes of individuals. This point is supported by Monterrosa et al. (2020) who also found an association between food culture/foodways and dietary intake.
4.3. Foodways
Based on the food intake variety and amounts (Table 3), it is evident that the elderly people in Obam ongola consume diversified meals consisting of green leafy vegetables (casava leaves amongst others), tubers (especially casava), cereals, nuts, and fruits seasonally. This is suggestive of good nutrition practices, especially if consumed in a balanced nature and the right amounts daily. For example, consumption of okok (Gnectum africanum Welw) leaves which is a dark green leafy vegetable, is known to be rich in nutrients (Abia et al., 2007). Furthermore, their diets are almost, if not all, containing groundnuts, as a source of plant-based proteins. Moreover, no single food is predominantly consumed daily. This is not entirely strange considering Obam ongola is a city-boarder community.
Generally, the food secure participants revealed a relatively higher average monthly income (282,750-franc cfa; Table 6) as opposed to the food insecure group (108,370 -francs cfa) with a relatively lower number of people who depend on household monthly income when compared with the food insecure group. Additionally, more food insecure sub-group individuals were either singles or widows relative to the food-secured group, thus speculating of inadequate nutrition.
4.4. The Obam-ongola population aflatoxins-food safety levels
Our study revealed that one of the delicacies in Obam ongola, Nnam owondo, was contaminated with aflatoxins at a mean (range) level of 16.67 (0.13-32.26) µg/Kg. This was not strange when considering the existing aflatoxins reports from Yaoundé, all of which revealed high and unacceptable levels of aflatoxins in groundnuts-based foods (Abia et al., 2013a, b, 2017), and elsewhere in Cameroon (Njobeh et al., 2010). The estimated margin of exposure value of 0.01335 implies that the popular diet consumed by the people of Obam ongola population is not safe for their health, and with aflatoxins being carcinogenic, the diet may serve as a risk factor for cancer. Altogether, the observed MOE values revealed that the consumer population is at risk of aflatoxins-associated health disorders such as hepatic carcinoma, and immunosuppression, amongst others, irrespective of whether the total aflatoxins levels were below or higher than the CAC fixed MTL.
Strengths and Limitations of the Study
Cameroon is made up of many ethnic groups with different cultures and each culture has a specific way of living which is closely linked to their foodways. This study was carried out in a small village in the central region of Cameroon. The sample collected is not representative of Cameroon as a whole, thus, the findings of this study cannot be generalized to Cameroonian adults.
Furthermore, the quantities of food registered in the food frequency questionnaire were not measured but estimated. This reduced sensitivity to detect the dietary intake of participants.
Also, the combination of the food secure and mildly food insecure on one side, then moderate and severely food insecure on the other due to the relatively small sample size did not permit us to appreciate the food security level of the studied population. Finally, the choice of the elderly (50+) as participants for this study may be regarded as a limitation as some of the participants may have unknown and or unreported underlying medical conditions that may influence the findings.
This study revealed that 63% (45/72) of the participants were food secure; while 38% (27/72) were food insecure, with at least 11 participants of either food in-/secure group that consumed less than the recommended values for energy, protein, and carbohydrate. Additionally, it showed that 26% of the studied elderly participants had energy (mean level: 1819; Male [33%]: 2026; Female [42%]: 1612 KCal), protein (mean level: 60.3; Male [31%]: 57; Female [46%]: 63 g), and carbohydrates (mean level: 141.6; Male [42%]: 132; Female [25%]: 151 g) values less than recommended dietary allowances (RDA). Furthermore, it has revealed vital factors relating to the foodways of the studied participants, including that they consumed a lot of green leafy vegetables and groundnuts, tubers especially cassava, with less fish and meat; those with low monthly income tend to have more responsibilities (children) than participants with higher monthly income; and matrimonial status likely has a role to play in the foodways of individuals as most of the singles opted for foods that were easy to cook and that do not require a lot of time to be prepared. Finally, the Obam ongola community is exposed to aflatoxins (mean level: 16.67, range: 0.13-32.26 µg/Kg; with 54% i.e., 14/26 samples at levels > 10 µg/Kg fixed by Codex Alimentarius; MOE: 0.008) via consumption of Nnam owondo irrespective of whether food secure or food insecure and thus, potentially exposed to aflatoxins-associated health implications such as hepatic carcinoma, immunosuppression, amongst others, a scenario which may be worse in cases of elderly populations, necessitating control actions. Education campaigns promoting healthy food awareness and healthy living on a budget are strategies to consider for improving the overall well-being of older adults in rural areas of Cameroon.
Dear Editorial Team, Clinical Medical Reviews and Reports. My experience with the journal was highly positive. The peer-review process was rigorous, constructive, and completed in a timely manner. The reviewers provided valuable comments that helped improve the quality and clarity of our manuscript. The editorial office was professional, responsive, and supportive throughout all stages of the publication process. Communication was clear and efficient, and any questions were addressed promptly. Overall, I found the journal to maintain high scientific standards and an excellent publication workflow. I would be pleased to consider submitting future work to this journal. Best wishes from, Elena Popa.

It was my pleasure to submit my testimonial concerning the Reviewer Board of our Scientific Journal “Brain and Neurological Disorders”. The Reviewers focused on some modifications and their contribution was helpful. The ladies of our Editorial Office were also supported my efforts. It was my honor to have such a co-operation and I am looking forward for more collaboration.

Dear Grace Pierce, Editorial Coordinator of Journal of Clinical Research and Reports, Thank you for the speedy and efficient peer review process. I appreciate the fact that your peer reviewers do not take months to respond like with some other journals. I would also like to thank the editorial office for responding quickly to my questions. It is an excellent journal. I plan to submit more manuscripts in the future. Best wishes from, Robert W. McGee

Dear Grace Pierce, Editorial Coordinator of Journal of Clinical Research and Reports, Working with you and your team on our recent publication in JCRR has been a truly wonderful and enjoyable experience. The responses were prompt, and the reviewers were patient, constructive, and highly professional. One reviewer in particular gave me the feeling that a professor was carefully reading and commenting on my coursework, which was deeply touching. The entire process was straightforward and hassle‑free, with no tedious online forms to complete. I highly recommend this journal. Best wishes from, DR Aibing Rao, Head of R&D

I Appreciate the Opportunity to Share my Experience with the Journal of Clinical Research and Reports. The peer review process was timely and constructive, and the feedback provided helped improve the quality of our manuscript. The editorial office was professional, responsive, and supportive throughout the process, ensuring smooth communication and efficient handling of the submission. Overall, it was a positive experience collaborating with your team.

Dear Mercy Grace, Editorial Coordinator of Obstetrics Gynecology and Reproductive Sciences, We would like to express our gratitude for your help at all stages of publishing and editing the article. The editors of the magazine answer all the necessary questions and help at every stage. We will definitely continue to cooperate and publish other works in the Obstetrics Gynecology and Reproductive Sciences! Best wishes from, Alla Konstantinovna Politova,
