
Research Article | DOI: https://doi.org/10.31579/2637-8914/042
*Corresponding Author: Arjun Ghimire, Department of Food Technology, Central Campus of Technology, Dharan, Nepal.
Citation: Ghimire A., Ashish N., Prajwal P, Ranjana P. and Ghimire A. (2021) Drying kinetics of indigenous fermented foods of the Himalaya region (Gundruk, Sinki, and Maseura). J Nutrition and Food Processing, 4(2); DOI:10.31579/2637-8914/042
Copyright: © 2021 Arjun Ghimire, This is an open access article distributed under the Creative Commons Attribution License, which permits unrestricted use, distribution, and reproduction in any medium, provided the original work is properly cited.
Received: 20 February 2021 | Accepted: 01 March 2021 | Published: 08 March 2021
Keywords: cabinet drying; moisture ratio; mathematical modeling; effective diffusivity; activation energy; himalaya region
Indigenous fermented foods Gundruk (fermented mustard leaves), Sinki (fermented radish taproot), and Maseura (fermented lentils) are mostly sun dried, and thus often deteriorate during the uncontrolled drying process. Herein, cabinet drying was done at 50, 55, and 60°C after fermentation, and the moisture loss was systematically recorded. The data were converted to moisture ratio and fitted to five semi-theoretical drying mathematical models: Modified Henderson and Pabis, Logarithmic, Two-Term, Midilli et al., and Approximate diffusion. All the models were validated using statistical parameters, namely: R2, RMSE, χ2, and SSE. The Midilli et al. model gave excellent fit for all three products, with R2 greater than 0.97. The effective diffusivity values increased with an increase in air temperature for all the samples. The activation energy values were found to be 56.25, 21.63 and 15.08 kJ/ mol while the diffusivity constants were found to be 1268.51, 0.028, and 8.655× 10⁻³ m2/s for Gundruk, Sinki, and Maseura, respectively.
Practical applications
All commercial cabinet dryers are fabricated on the principles of thin layer drying, which means drying as a single layer of slices or sample particles. A mathematical model for the thin-layer drying of three indigenous fermented foods of the Himalaya region: Gundruk, Sinki, and Maseura (moisture ratio against time) is presented in this paper. The study of moisture ratio as a function of drying conditions and time has many benefits in the drying process, such as (1) consumption of less energy, (2) minimal heat damage to the product, (3) lower capital cost, and (4) convenient handling of dryer systems. It is assumed that the present study should be helpful to people looking forward to optimize the engineering aspects of the drying system and their elements, and to identify the correct process parameters and configurations for the drying system.
The Himalaya encompasses a geographical region of approximately 3.4 million km2 and is unfold across nations of the Islamic State of Afghanistan, Pakistan, India, Nepal, China (Tibetan Autonomous Region), Bhutan, and Burma (Pandit et al., 2014).Various types of ethnic sourced foods and alcoholic beverages are prepared and consumed by the Himalayan peoples like bamboo, meat, fish, cereal, milk, vegetable, alcoholic beverages and soybean. The food culture is a distinctive mix of the milk–vegetable- eating Hindu culture from the south and also the soybean–alcohol-consuming Chinese culture from the north (Tamang, 2009). In the present paper, we report the drying kinetics of the three most popular fermented products of the Himalaya region (Gundruk, Sinki, and Maseura) aiming to offer scientific evidence for the exploitation of these indigenous products.
Gundruk is a nonsalted, fermented, and sour vegetable product indigenous to the Himalayas. During Gundruk fermentation, fresh leaves of native vegetables known as rayosag (Brassica rapa subsp. campestris var. cuneifolia), cauliflower leaves (Brassica oleracea L. var. botrytis L.), mustard leaves (Brassica juncea (L.), and cabbage (Brassica sp.) are wilted for 1-2 days. Wilted leaves are crushed gently and pressed tightly into a container or earthen pot, created airtight, and fermented naturally for period of 15–22 days. After fermentation, products are taken out and dried in the sun for 2–4 days. Gundruk is consumed as pickles or soups and has some likeliness with different fermented soured vegetable products like kimchi of Korea, sauerkraut of Germany, and sunki of Japan (Yan et al., 2008). A fermented acidic radish taproot product called Sinki is prepared by pit fermentation in the Himalayas, typically throughout winter, when radish taproot production is abundant. When the taproot is fermented, it is known as Sinki and, once the leaves of radish are fermented, it is called Gundruk (Tamang, 2009).
Maseura is a very important food item of Nepalese, mainly Newar communities. In its production, seeds of black gram (Vigna mungo), black lentil (Phaseolus mungo), or rice-bean (Phaseolus calcaratus) are cleaned, washed, and dipped in water overnight. Soaked seeds are dehulled by pressing through hands and the hulls are removed, ground into thick paste with mortar and pestle. Water is mixed while grinding until the paste becomes sticky, which is then hand-moulded to form small balls or cones. The mixture, then is placed on a bamboo mat and fermented in an open room for 2-3 days, after which it is sundried for 3-5 days relying on the weather conditions (Tamang et al., 2016).
One amongst the oldest and most ordinarily practiced methods of preservation, particularly within rural areas, is drying, which involves heat and mass transfer, leading to irreversible product changes that are either physical or as a result of chemical or biochemical reactions. Drying can either be done by old methods like sun drying or industrially by solar, hot air, and other drying methods (Tunde‐Akintunde & Afolabi, 2010).Traditional sun drying is usually practiced among small and medium-scale farmers and processors, particularly in developing countries because of its low operational, installation, and energy prices (Ertekin & Yaldiz, 2004).
Hot air drying is among the oldest food preservation processes. However, exposure to thermal energy will have an effect on vital food properties, such as the chemical composition, texture, color, and flavor. Therefore, the choice of an acceptable drying technique, developing an appropriate applicable mathematical model, and also determining the optimum operating parameters are useful to achieving prime quality and minimum cost products with the highest yield (Clemente et al., 2011). Hot air drying involves simultaneous heat and mass transfer operations, where the material is fully exposed to drying conditions of temperature and hot air, thus improving the drying method. The foremost vital aspects of thin-layer drying technology are the mathematical modeling of the drying process and the overall instrumentation, which can enable the choice of the most appropriate operating conditions. Thus, it is essential to explore the thin-layer modeling approach for determining the drying kinetics from the experimental data, describing the drying behavior, improving the drying process, and eventually minimizing the entire energy demand (Onwude et al., 2016).
Mathematical modeling and simulation of the drying curve directs better management of drying and to obtain prime quality products (Meisami-Asl et al., 2009). It may be used to study the drying variables, determine the drying kinetics, and optimize the drying parameters (Karathanos & Belessiotis, 1999; Yun et al., 2013). The principle of modeling relies on having a set of mathematical equations that satisfactorily describe the drying behaviors (Taheri-Garavand et al., 2011). Drying kinetics of agricultural materials like tea (Raveendran et al., 2013), paddy (Manikantan et al., 2014), bird’s eye chilies(LIMPAIBOON, 2015), jackfruit (Kaushal & Sharma, 2016), alfalfa (Farhang et al., 2010), beetroot leaves (Kakade & Hathan, 2014), unripe plantain chips (Famurewa, 2015), and bay leaves (Demir et al., 2004), were successfully represented by thin layer drying models.
The drying kinetics models are therefore vital in choosing the optimal drying conditions that are important parameters in terms of equipment design, optimization, and quality improvement of these indigenous fermented foods.
1.1. Materials
Fresh mustard leaves (Brassica juncea), Radish taproot, Split pulse Blackgram (Phaseolus mungo), and Colocasia tuber were purchased from the Dharan area of Nepal (26o48′41″ N, 87o16′8.0″ W) and preparations were done as shown in the supplementary section (A).
1.2. Drying experiments
Gundruk, Sinki, and Maseura with initial moisture contents of 1.56, 1.38, and 1.50 kg water/ kg dm were dried immediately after fermentation at three different temperatures of 50, 55, and 60 °C in a cabinet dryer (Cabinet -hot air convective dryer PCD-E3000 Serials, volts-220V, temperature range (0-300ºC)). The thicknesses of Gundruk, Sinki, and Maseura were 2.50×10⁻³, 8×10⁻³, and 3.78×10⁻² m, respectively. The samples were spreaded on the cabinet tray in a single layer, and the moisture contents of the sample were determined at 15 min intervals for Gundruk and Sinki, and at 30 minute intervals for Maseura. The drying process was terminated when the samples weights at three consecutive times were constant, and the moisture content was considered as the equilibrium moisture content. Drying experiments were carried out in triplicate at each temperature, and the drying curve was plotted from the average value.
1.3. Modeling of the drying process
1.3.1. Moisture Content
Moisture content was calculated using the following equation(Nguyen et al., 2019):
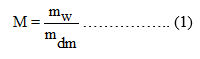
where, M is the moisture content (Kg water/Kg dry matter), mw is the mass of water in sample (Kg), and mdm is the mass of dry matter in sample (Kg).
1.3.2. Moisture ratio
The moisture ratio was calculated as shown below using equation (2) as modified by (Roberts et al., 2008) :
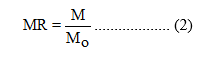
where, MR is the moisture ratio, M is the moisture content at time ‘t’ of the drying process (Kg/Kg dry solid) and Mo is the initial moisture content (Kg/Kg dry solid).
1.3.3. Drying Rate
Drying rate (DR) is defined as the amount of evaporated moisture with respect to time. The drying rate (Kg water/Kg dry matter/h) during the process of drying Gundruk, Sinki, and Maseura was determined using equation 3 (Afolabi et al., 2015):
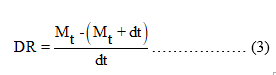
where, Mt is the moisture content at time ‘t’ (Kg water/Kg dry matter), (Mt+dt) is the moisture content (Kg water/Kg dry matter) at (t + dt) time, and dt is the drying time (h).
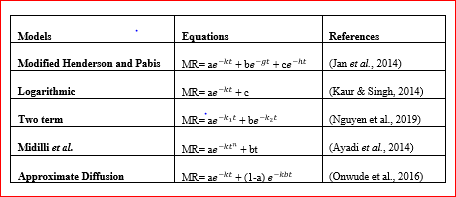
The drying curves were fitted by means of 5 completely different moisture ratio models that are widely used in most food and biological materials. These models were chosen on the basis of applications and additional variable values, as drying does not rely on a single factor. The different kinetic models used are presented in Table 1.
1.4. Statistical analysis for the determination of appropriate models
In order to select out the best suitable model to explain the drying behavior of any product with different drying methods or different conditions, nonlinear regression analysis was performed using Microsoft Excel 2016. The statistical values are outlined as follows (Nguyen et al., 2019):
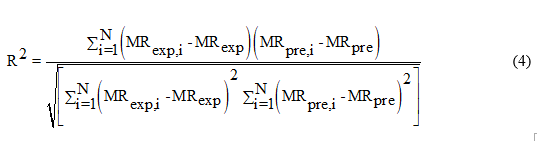
1.4.1. Coefficient of determination
It provides a measure of how well future outcomes are likely to be foreseen by the model. The coefficient of determination is not likely to be 0 or 1; however, rather somewhere between these limits. The nearer it is to 1, the larger relationship exists between the experimental and predicted values.
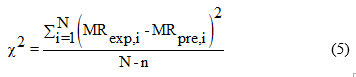
1.4.2. Reduced chi-square (χ2)
It is the mean square of the deviations between the experimental and predicted values for the models, and used to evaluate the fitting agreement of every model which can be calculated as:
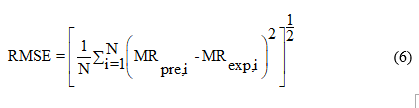
1.4.3. Root-mean-square error (RMSE)
It is often used to measure the differences between values predicted by a model or an estimator and the values truly observed from the thing being modeled or estimated, which can be calculated as:
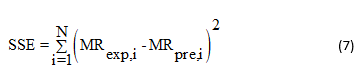
1.4.4 Sum of squared errors of prediction (SSE)
It is the sum of the squares of residuals (deviations predicted from actual empirical values of data). It is a computation of the discrepancy between the data and an estimation model. It is used as an associate criterion in parameter and model selection (Magar, 2017).
1.5. Determination of the effective moisture diffusivity
Fick’s second law of diffusion was applied to evaluate the effective diffusivity as the result of all the samples showed a falling rate period in their drying characteristics. The effective diffusivity of the samples was determined by equation 8 as shown below by linear fitting (Rahman et al., 2015):

where Deff, L, and t are the effective moisture diffusivity (m2/s), thin layer thickness (m), and time (h), respectively.
1.6. Determination of the activation energy
The relationship between effective diffusivity and temperature is given by the Arrhenius function of the type as mentioned in equation 9 (Akoy, 2014; Dianda et al., 2015; Saxena & Dash, 2015):
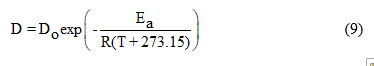
where Do is the pre-exponential factor called the diffusivity constant of the Arrhenius equation (m2/s), Ea is the activation energy (kJ/mol), R is the universal gas constant (R = 8.31451 J/mol/K), and T is the air temperature expressed in °C.
2.1. Drying characteristics
In this study show that the drying rate decreased continuously throughout the drying time, as shown in Figure 1. It was observed that the higher the drying temperature, the greater the drying rate, and hence, the highest values of drying rate were obtained during the experiment at 60 °C.
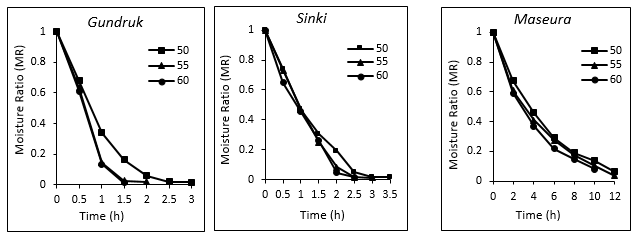
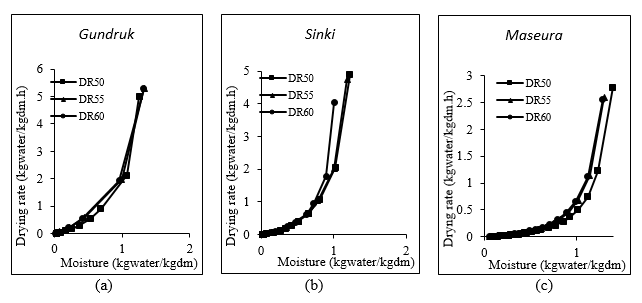
At the initial stage, moisture evaporation takes place rapidly in an exponential manner and then slowly ablated with an increase in drying time until the latter stages of drying when moisture evaporation became negligible. The moisture content was determined to reduce with an increase in drying time, which is mostly due to the reduction in available water for evaporation with progression in time. The minimization of total drying time with elevated temperature may be due to an increase in vapor pressure within the product with rise in temperature, that resulted in quicker migration of moisture to the product surface (Vega-Gálvez et al., 2011). This reduction in drying time with an increase in drying temperature is comparable to the results reported for other food materials like cocoyam slices, corn, lemongrass, and stone apple slices (Afolabi et al., 2015; Chayjan et al., 2011; Nguyen et al., 2019; Rayaguru & Routray, 2012). The critical moisture content was not found on the drying rate curve as the drying rate of all samples fell in the falling rate period (Figure 2).
Recent studies have also shown that the constant rate period was absent in the drying processes of fruits and vegetables, since this period often happens very rapidly (Onwude et al., 2016).
The drying rate was highest at 60oC and lowest at 50oC for all the samples. The drying decreased from an initial value of 4.991 to 0.008 kgwater/kg dm.h in 3h for Gundruk; 4.880 to 0.006 kgwater/kg dm.h in 3.5h for Sinki; and 2.781 to 0.007 kgwater/kg dm.h in 12h for Maseura, respectively at 50oC. Similarly, the drying decreased from an initial value of 5.277 to 0.013 kgwater/kg dm.h in 1.75h for Gundruk ; 4.025 to 0.008 kgwater/kg dm.h in 2.5h for Sinki; and 2.559 to 0.005 kgwater/kg dm.h in 11.5h for Maseura, respectively at 60oC. The low drying rate of Maseura can be attributed to the high water- holding capacity of proteins of the blackgram in Maseura. Higher drying rates were determined at higher drying air temperatures that resulted in quicker moisture evaporation and later on faster moisture content reduction therefore reducing the whole drying time. This is in agreement with the results obtained for other food products (Afolabi et al., 2015; Doymaz, 2010; Rayaguru & Routray, 2012). The presence of the falling rate period gave rise to the appearance of the models indicated in Table 1.
2.2 Evaluation of the models
The moisture content data were converted to a dimensionless parameter referred to as the moisture ratio, as shown in equation 1, and were fitted to the chosen thin-layer drying models (Table 1). The results of statistical analyses of these models for Gundruk, Sinki, and Maseura are shown in table 2, 3, and 4 respectively. Also the criteria and constants used to estimate goodness of the fit are presented in the tables. The best model was selected with the highest R2 and the lowest χ2, RMSE, and SSE (Taheri-Garavand et al., 2011). From the tables, R2, χ2, RMSE and SSE values were varied between 0.94482–0.99740, 0.96615 - 0.99667, and 0.99641- 0.99872; 0.00049– 0.02304, 0.00047– 0.00788, and 0.00010– 0.00036; 0.01853 - 0.10098, 0.01867- 0.06693, and 0.00957- 0.01785; 0.00290–0.08187, 0.00523 –0.05824, and 0.00219 –0.00797; respectively, for Gundruk, Sinki, and Maseura.
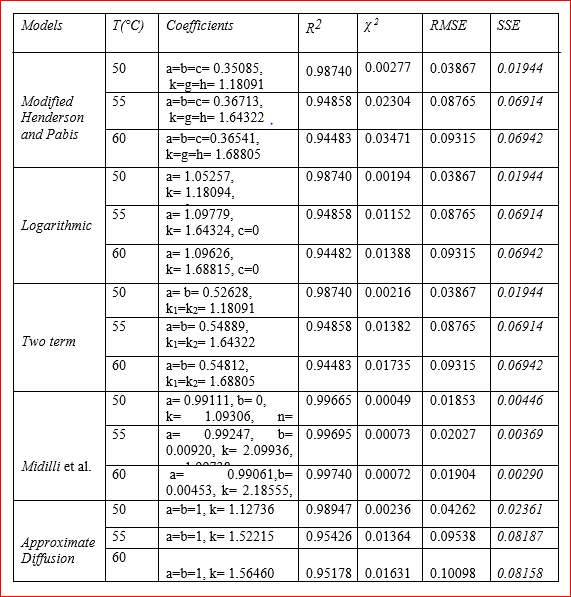
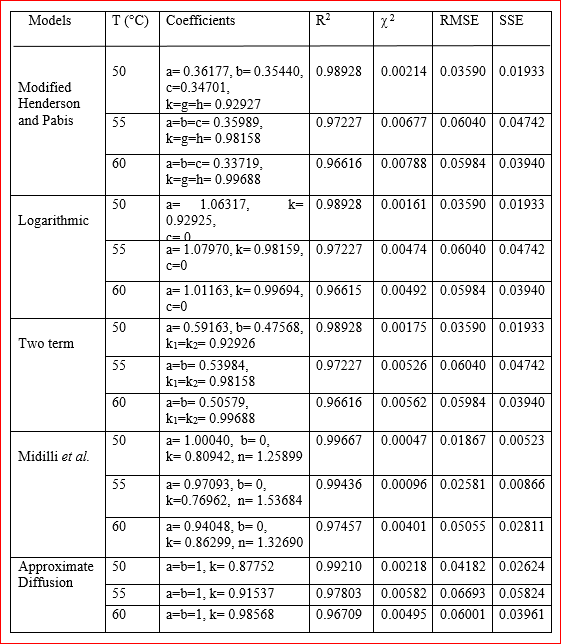
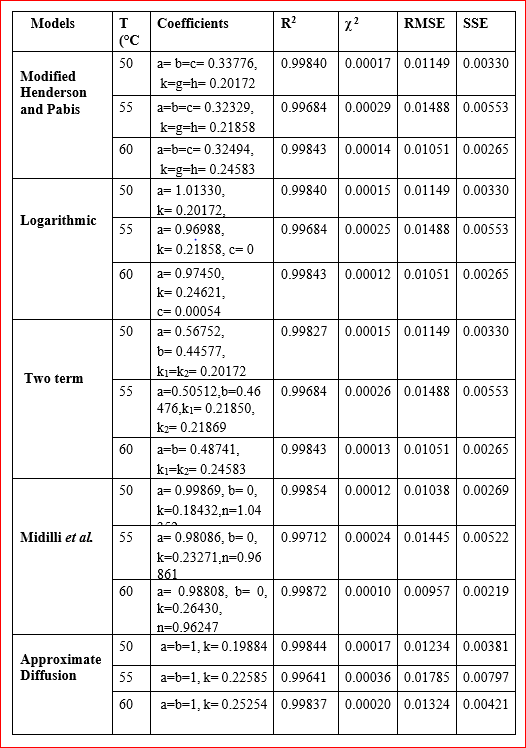
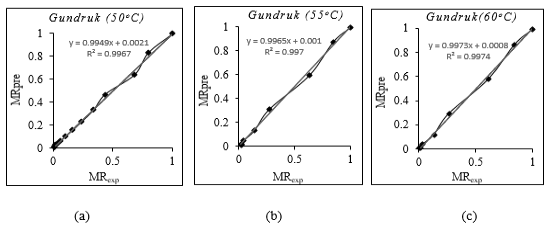
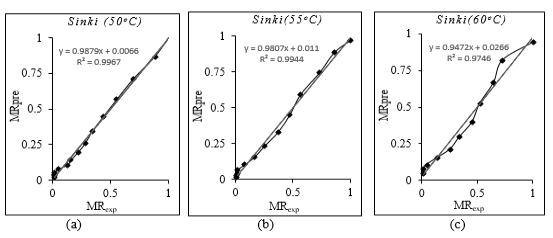
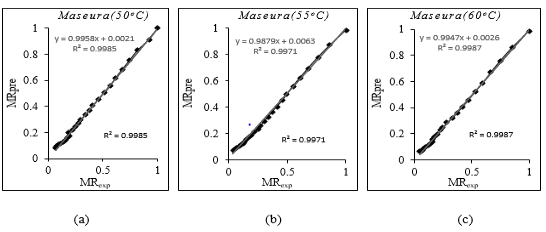
The Midilli et al. model gave the best fit of all models for Gundruk, Sinki, and Maseura based on non-linear regression analysis. The experimental data and predicted values by the Midilli et al. model are presented in figure 3, 4, and 5, respectively. The Midilli et al. model has been found to be well fitted to the drying of Sardine fish (Darvishi et al., 2012), Indian mackerel (Balu Ramdas, 2009), curry leaves (Magar, 2017), tomato (Taheri-Garavand et al., 2011), and pepper (Onwude et al., 2016).
2.3 Effective Diffusivity (Deff)
The value of effective diffusivity increased with an increase in the drying temperature for all the samples. Equation 8 was used to calculate the effective diffusivity, and the relationship between ln(MR) and time is shown in figure 6, 7, and 8, respectively.
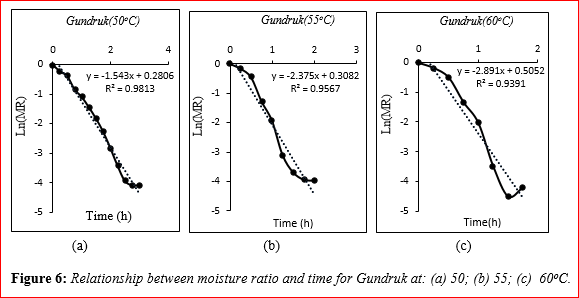
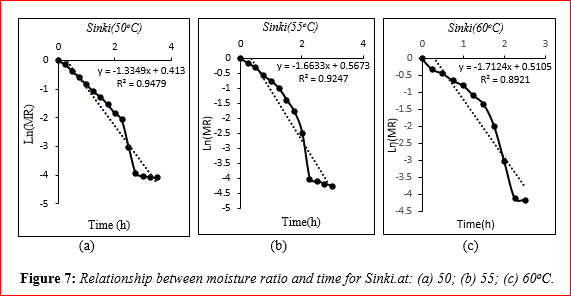
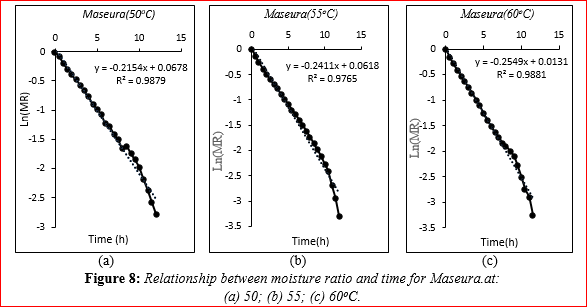
Samples dried at 50ºC presented the lowest Deff, which were 9.78×10⁻⁷ m2/s, 8.73×10⁻⁶ m2/s, and 3.12×10⁻⁵ m2/s; and samples dried at 60ºC had the highest Deff, which were 1.83×10⁻⁶ m2/s, 1.11×10⁻⁵, and 3.69 ×10⁻⁵ m2/s for Gundruk, Sinki, and Maseura, respectively, as shown in table 5.
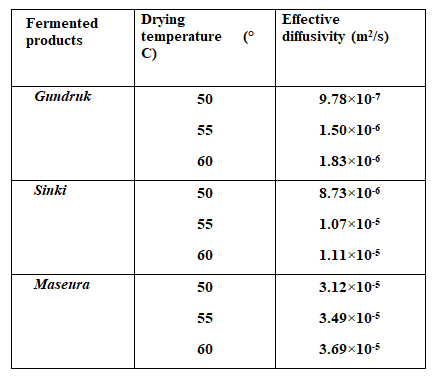
A similar effect was also reported in previous studies (Arslan & Özcan, 2010; Chayjan et al., 2011; Chen et al., 2013; Jena & Das, 2007; Lee & Kim, 2009; Nguyen et al., 2019). This table also shows that Maseura has the highest and Gundruk have the lowest Deff. This result is due to the high thickness of Maseura and the low thickness of Gundruk leaves. Also, the other reason for its highest Deff can be due to the longer drying time needed to dry Maseura.
2.4 Activation energy (Ea)
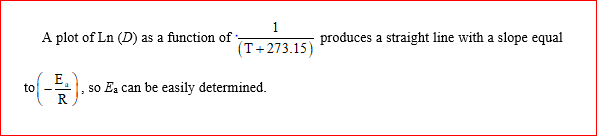
The activation energy and the estimated diffusivity constant were calculated using equation 9 by plotting the relationship, as given in figure 9, which shows the impact of temperature on the effective diffusivity. The natural logarithm of Deff versus the 1/ T value was plotted, and the slope of a straight line was used to calculate the activation energy.
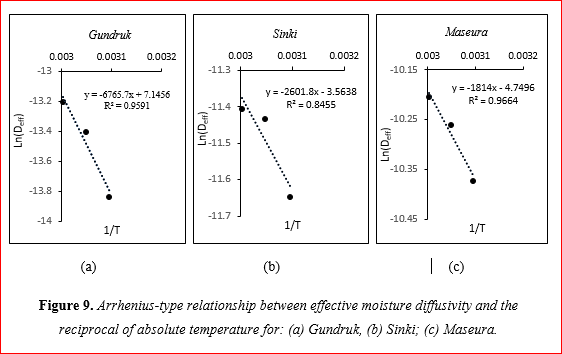
The diffusivity constant and activation energy were found to be 1268.51, 0.02833 and 8.65515× 10⁻³ m2/s and 56.25, 21.63 and 15.08 kJ/mol respectively for Gundruk, Sinki, and Maseura. The low activation energy of Maseura might be due to its high porosity. To comparison, for the activation energy of fruits and vegetables, the values ranged between 14.42 and 43.26 kJ/mol for more than 90% of the activation energy values, and 8% of the values were in the range of 78.93 to 130.61 kJ/mol, in previous studies (Onwude et al., 2016).
The drying of indigenous fermented products of the Nepal Himalaya region; Gundruk, Sinki, and Maseura was carried out at temperatures of 50ºC, 55ºC, and 60ºC in a cabinet dryer. The drying temperature significantly affected the drying rate of all products. The drying process of these three products occurred in the falling rate period with no constant rate period. The drying time fell continuously with an increase in air temperature. Five thin-layer drying models were used to explain the drying kinetics of these products, of which the Midilli et al. model gave a better fit for Gundruk, Sinki, and Maseura based on non-linear regression analysis. The effective diffusivity increased with increasing temperature. Maseura had the highest Deff whereas, Gundruk had the lowest Deff. The Arrhenius equation was used to calculate the diffusivity constant, and activation energy, and the values were found to be 1268.51, 0.02833, and 8.65515× 10⁻³ m2/s; and 56.25, 21.63, and 15.08 kJ/mol, respectively, for Gundruk, Sinki, and Maseura.
The authors declare no conflicts of interest. The authors alone are responsible for the writing and content of the paper.
The authors thank all the faculties and staff of the Central Campus of Technology, Nepal for their support and technical assistance.
Nomenclature
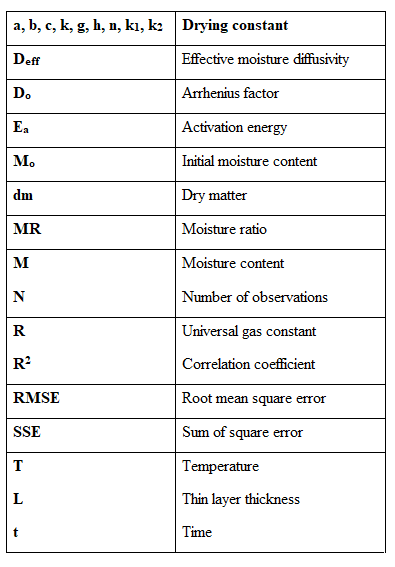
Subscripts
Dear Editorial Team, Clinical Medical Reviews and Reports. My experience with the journal was highly positive. The peer-review process was rigorous, constructive, and completed in a timely manner. The reviewers provided valuable comments that helped improve the quality and clarity of our manuscript. The editorial office was professional, responsive, and supportive throughout all stages of the publication process. Communication was clear and efficient, and any questions were addressed promptly. Overall, I found the journal to maintain high scientific standards and an excellent publication workflow. I would be pleased to consider submitting future work to this journal. Best wishes from, Elena Popa.

It was my pleasure to submit my testimonial concerning the Reviewer Board of our Scientific Journal “Brain and Neurological Disorders”. The Reviewers focused on some modifications and their contribution was helpful. The ladies of our Editorial Office were also supported my efforts. It was my honor to have such a co-operation and I am looking forward for more collaboration.

Dear Grace Pierce, Editorial Coordinator of Journal of Clinical Research and Reports, Thank you for the speedy and efficient peer review process. I appreciate the fact that your peer reviewers do not take months to respond like with some other journals. I would also like to thank the editorial office for responding quickly to my questions. It is an excellent journal. I plan to submit more manuscripts in the future. Best wishes from, Robert W. McGee

Dear Grace Pierce, Editorial Coordinator of Journal of Clinical Research and Reports, Working with you and your team on our recent publication in JCRR has been a truly wonderful and enjoyable experience. The responses were prompt, and the reviewers were patient, constructive, and highly professional. One reviewer in particular gave me the feeling that a professor was carefully reading and commenting on my coursework, which was deeply touching. The entire process was straightforward and hassle‑free, with no tedious online forms to complete. I highly recommend this journal. Best wishes from, DR Aibing Rao, Head of R&D

I Appreciate the Opportunity to Share my Experience with the Journal of Clinical Research and Reports. The peer review process was timely and constructive, and the feedback provided helped improve the quality of our manuscript. The editorial office was professional, responsive, and supportive throughout the process, ensuring smooth communication and efficient handling of the submission. Overall, it was a positive experience collaborating with your team.

Dear Mercy Grace, Editorial Coordinator of Obstetrics Gynecology and Reproductive Sciences, We would like to express our gratitude for your help at all stages of publishing and editing the article. The editors of the magazine answer all the necessary questions and help at every stage. We will definitely continue to cooperate and publish other works in the Obstetrics Gynecology and Reproductive Sciences! Best wishes from, Alla Konstantinovna Politova,
