
Research Article | DOI: https://doi.org/10.31579/2637-8914/025
*Corresponding Author: Arne Torbjørn Høstmark, Faculty of Medicine, Institute of Health and Society, University of Oslo, Norway.
Citation: Arne T. Høstmark., Hau A, (2020) Distribution Dependent and Cluster Regulation of Associations between Body Fatty Acid Percentages, as observed in Chickens. J. Nutrition and Food Processing, 3(2); DOI:10.31579/2637-8914/025
Copyright: © 2020 Arne Torbjørn Høstmark, This is an open-access article distributed under the terms of the Creative Commons Attribution License, which permits unrestricted use, distribution, and reproduction in any medium, provided the original author and source are credited.
Received: 22 March 2020 | Accepted: 01 April 2020 | Published: 09 April 2020
Keywords: arachidonic acid; eicosapentaenoic acid; docosahexaenoic acid; dihomo-gammalinolenic acid; fatty acid percentages; random numbers; variability; muscle fat; chickens
Body fatty acids are important in health and disease. We previously observed two groups of fatty acids in breast muscle of chickens: Group 1) with relative amounts correlating negatively with %AA (20:4 n6), and Group 2) with relative amounts correlating positively with %AA. Within each of the two groups, we here found positive correlations between fatty acid percentages. Accordingly, Group 1 percentages correlated negatively with those of Group 2. With random numbers in lieu of the true values of Group 2 fatty acids, we were able to reproduce the positive correlations found with true values, if the random numbers were generated with the true ranges. In contrast, with random numbers we did not succeed in reproducing all of the negative correlations between Group 1 and Group 2 fatty acid percentages. We then observed that absolute amounts (g/kg) of fatty acids in Group 1 correlated positively and strongly (r > 0.9), suggesting a coordinated regulation of these fatty acids. Thus, Group 1 fatty acids seemed to be a cluster of fatty acids. Random number cluster percentage showed nice inverse associations with random number Group 2 fatty acid percentages, like the outcome observed with the true values. We suggest that associations between fatty acid percentages are caused by their concentration distributions, and by cluster regulation. Distribution Dependent and Cluster Regulation could be an evolutionary adaptation, where a mathematical rule is utilized to e.g. balance effects of eicosanoids/docosanoids, and possibly other metabolites.
We previously reported that %AA (20:4 n6) was negatively associated with %OA (18:1 c9) in chicken breast muscle lipids [1- 2]. Furthermore, %AA was positively associated with relative amounts of fatty acids serving as precursors of eicosanoids and docosanoids [3]. These latter compounds are important regulatory molecules in cell physiology. They are derived from poly-unsaturated fatty acids with 20 or 22 carbon atoms, being formed in most organs and cell types, in reactions catalyzed by cyclooxygenases, lipoxygenases, and epoxygenases [4]. It is well known that EPA (20:5 n3) and AA (20:4 n6) are metabolic antagonists [5 - 7]. Eicosanoids derived from EPA may decrease inflammatory diseases [8-10], improve coronary heart diseases [11, 12], and cancer [13], although a systematic Cochrane Review of selected studies questioned the beneficial effects of long-chain n3 fatty acids on all-cause and cardiovascular mortality [14 ].
Furthermore, we classified the fatty acids found in chicken breast muscle lipids into two groups: Group 1) where fatty acid percentages correlated negatively with %AA, and Group 2) where percentages correlated positively with %AA [15]. Additionally, with random numbers in lieu of the true values of the fatty acids in Group 2, we were able to reproduce the positive correlations found with true values, provided that the random numbers were generated with true ranges. In contrast, we did not succeed well in reproducing the negative correlations between Group 1 and Group 2 fatty acid percentages [15]. The previous results suggest that the particular concentration ranges of the fatty acids might explain all of the positive correlations between %AA and percentages of other fatty acids [3, 15-17]. The aim of the present work was to further clarify how associations between fatty acid percentages might be explained, using a random number approach.
Chickens, diet, and determination of fatty acids
We refer to our previous article [18] for details concerning the diet trial. In brief, from day 1 to 29 one-day-old Ross 308 broiler chickens from Samvirkekylling (Norway) were fed wheat-based diet containing 10 g fat per 100 g diet. ALA (18:3 n3), a precursor of EPA, provided 15% of the fatty acids, and LA (18:2 n6), a precursor of AA, provided 21%. The n6/n3 ratio was 1.4. Energy content of the feed was about 19 MJ/ kg. ALA provided 2.5% of the energy, and LA 4%. Other components in the feed were: Histidine 0.1%, choline chloride 0.13%, mono-calcium phosphate 1.4%, ground limestone 1.3%, sodium chloride 0.25%, sodium bicarbonate 0.2%, vitamin A, E, D, K, B 0.18%, L-lysine 0.4%, DL-methionine 0.2%, and L-threonine 0.2%. Fatty acids of breast muscle and feed were determined by gas chromatography in accordance with O’Fallon et al. [19].
Calculations and statistical analysis
The following 22 fatty acids were determined in breast muscle lipids of the 163 chickens: 14:0; 14:1 c9; 15:0; 16:0; 16:1 c9; 17:0; 18:0; 18:1 t6,11; 18:1 c9; 18:2 c11; 18:2 n6; 20:0; 18:3 n6; 18:3 n3; 20:1 n9; 20:2 n6; 20:3 n6; 20:3 n3; 20:4 n6; 20:5 n3; 22:6 n3; and 22:5 n3. The sum (S) of all these fatty acids (SD), i.e. 8.85 (2.62) g/kg wet weight (n = 163) was used in the denominator when calculating relative amounts of the fatty acids. For example, percentage arachidonic acid was computed as: %AA = (AA/S)*100, and % EPA = (EPA/S)*100. We computed correlation coefficients (Pearson’s r and/or Spearman’s rho) to assess associations between the fatty acid percentages. We additionally made scatterplots to illustrate associations between relative amounts, but only some examples are included in this work. Thus, SUM of all 22 fatty acids were used in the denominator when computing percentages. However, we also present some results with only the sum of Group 1 and Group 2 fatty acids as the denominator. We computed ranges, mean values, and variabilities (coefficient of variation, SD) of the fatty acids under investigation. For example, the range was 0.13 - 0.24 g/kg for EPA, and 0.25 - 0.42 g/kg for AA. To further examine concentration (g/kg) distributions of the various fatty acids, we made histograms; only some examples are shown.
The diet trial in chickens was performed in accordance with National and international guidelines concerning the use of animals in research (Norwegian Animal and Welfare Act, European Convention for the protection of Vertebrate Animals used for Experimental and other Scientific Purposes, CETS No.: 123 1986). The Regional Norwegian Ethics Committee approved the trial, and the experimental research followed internationally recognized guidelines.There are no competing interests.
Are the correlation outcomes related to distributions of the fatty acids? A random number approach.
We accordingly generated uniformly distributed RANDOM numbers with the physiological distributions of the couple of fatty acids under investigation, and of R. Since the diet trial had 163 birds, for each of the analyses below we generated 163 random numbers with the particular fatty acid distributions shown in Table 1. To clarify, we use upper case letters (RANDOM) or quotation marks in Figures or figure texts when working with random numbers. Thus, R = S – A – B, if S is the total sum of fatty acids, A (B) are the fatty acids under investigation, and R is sum of the remaining fatty acids. This means that %A + %B + %R =100, or %B = -%A + (100 -%R). Conceivably, R should be different for each of the calculations, since different pairs of fatty acids were used. For each analysis, we made several repeats with new sets of random numbers; the general outcome of the repeats was always the same, but the correlation coefficients (Spearman’s rho and/or Pearson’s r), and scatterplots, varied slightly. We present the results as correlation coefficients and scatterplots. SPSS 26.0 was used for the analyses, and for making figures. The significance level was set at p<0.05. The experimental conditions are presented in more detail under “Results and Discussion”.
Are correlations between fatty acid percentages related to total SUM of the fatty acids?
Below we reason how SUM should, theoretically, relate to absolute and relative amounts of the fatty acids. In particular, we reason about the correlation outcome as obtained with surrogate, random numbers in lieu of the true values of the fatty acids. Conceivably, we might expect positive correlations between fatty acid percentages if all of them are positively (negatively) related to SUM. In contrast, a negative correlation should be anticipated if one of the percentages relates positively to SUM, whereas another is negatively related to SUM.
This work is a spin-off study of a previously published diet trial, conceived and carried out by AH. ATH conceived the present study, did the calculations, statistical analyses, and wrote the article. Both authors participated sufficiently - intellectually or practically - in the work, to take public responsibility for the content of the article. Both authors read and approved the final manuscript.
The diet trial in chickens was performed in accordance with National and international guidelines concerning the use of animals in research (Norwegian Animal and Welfare Act, European Convention for the protection of Vertebrate Animals used for Experimental and other Scientific Purposes, CETS No.: 123 1986). The Regional Norwegian Ethics Committee approved the trial, and the experimental research followed internationally recognized guidelines. There are no competing interests.
The study of which the present one is a spin-off, was funded by grant no 190399 from the Norwegian Research Council, and Animalia; the Norwegian Meat and Poultry Research Centre.
Descriptive Data
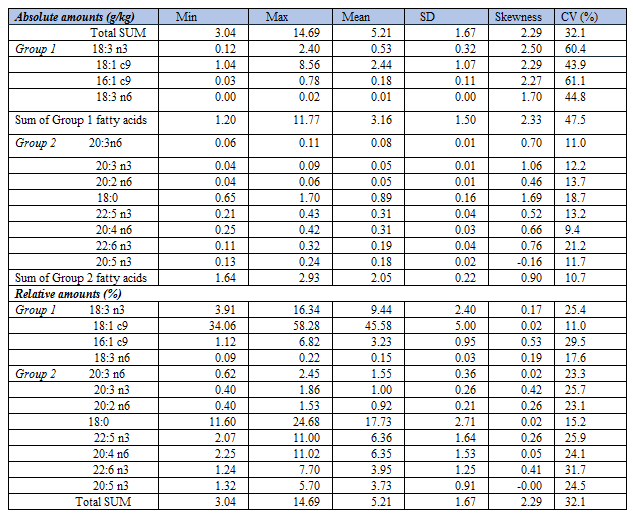
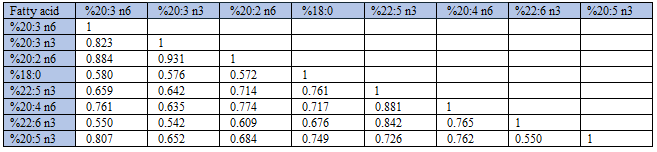
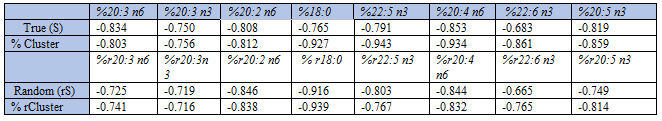
As shown in Table 1, Group 1) fatty acids had high variability, high positive skewness, and were generally high-number variables relative to Group 2 fatty acids. Group 2) fatty acids had low variability, no or low skewness, and were generally low-number variables. Among the 22 fatty acids, oleic acid (18:1 c9) was the dominating one providing 25 % of total weight, with palmitic acid (16:0; 19.0 % of all), linoleic acid (18:2 n6; 14.9%) and stearic acid (18:0; 9.6%) on the next places
Negative and positive correlations between %AA and percentages of other fatty acids
As previously reported [3], %AA correlated negatively with Group 1 fatty acid percentages (Spearman’s rho in parentheses): 18:3 n3 (-0.902); 18:1 c9 (-0.928); and 16:1 c9 (-0.577). In contrast, %AA correlated positively with Group 2 fatty acid percentages: 20:3 n6 (0.741); 20:3 n3 (0.627); 20:2 n6 (0.768); 18:0 (0.683); 22:5 n3 (0.869); 226: n3 (0.770); and 20:5 n3 (0.750), n = 163.
Will we manage to mimic the true correlations when using surrogate, RANDOM numbers in lieu of true values of the fatty acids?
We previously [3] presented scatterplots showing positive associations between %AA and relative amounts of 20:5 n3; 20:2 n6; 22:5 n3; 20:3 n6; 18:0; 22:6 n3; and 20:3 n3. Furthermore, we were able to largely reproduce all of them, when using surrogate random numbers. However, most of the negative correlations changed to become positive with random numbers, even though they were sampled with the true ranges of the fatty acids in question. The only exception was a poor negative association between %“random number %AA” and %“random number 18:1 c9”, in line with the outcome reported earlier [2]. Below we provide an explanation of this intriguing correlation outcome.
How will Fatty Acid Percentages Relate to the SUM of Fatty Acids?
In the calculations below, two denominators were used when computing fatty acid percentages; first we used sum (SUM) of all 22 fatty acids, and next, sum (S) of Group 1 and Group 2 fatty acids only. Since the sum is made of variables having specific ranges, the sum-value in each case will be determined by a particular set of values within the ranges of each of the fatty acids. This reasoning raises the question of how SUM will relate to the absolute and relative amounts (fractions, percentages) of the fatty acids. Conceivably, if relative amounts of two particular fatty acids have similar (opposite) relationship to SUM, then we should expect positive (negative) associations between these percentages.
Using SUM of all 22 fatty acids as the denominator: how will True SUM relate to true absolute and relative amounts of the fatty acids?
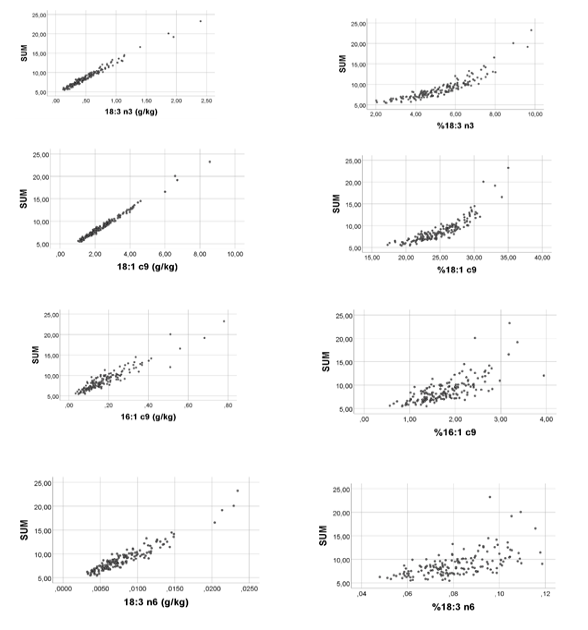
When carefully studying ranges of the two groups of fatty acids (Table 1), we see that the fatty acids with relative amounts correlating negatively with %AA (Group 1 fatty acids) have high variabilities and generally high numbers relative to Group 2 fatty acids. Thus, in Group 1 the mean SUM (SD) values (g/kg) was 3.16 (1.50), against 2.05 (0.22) in Group 2. Mean variability, expressed as the coefficient of variation (CV) in Group 1 was 4.4 times higher than in Group 2; i.e. CV = (1.50/3.16)*100 = 47.5% in Group 1, against (0.22/2.05)*100 = 10.7% in Group 2. We would, accordingly, expect that Group 1 fatty acids - in general - contribute more to SUM than those of Group 2, implying that relative amount of each of the fatty acids in the two groups should be differently related to SUM. To test this hypothesis, we made scatterplots of SUM vs. absolute and relative amounts of the fatty acids. In line with the above reasoning, we found a striking group difference. In Group 1, we observed positive associations between SUM and absolute amounts of the fatty acids (Figure 1, left column), and also between SUM and their relative amounts (Figure 1, right column).
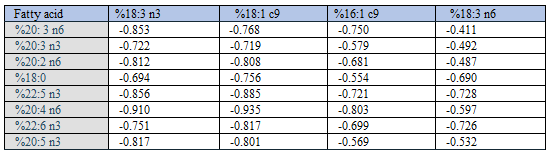
In contrast to this, with Group 2 fatty acids, we observed that their relative amounts were negatively related to SUM (Figure 2). Correlation coefficients (Spearman’s rho) between SUM and relative amounts of Group 2 fatty acids were: -0.878 (20:3 n6); -0.770 (20:3 n3); -0.854 (20:2 n6); -0.745 (18:0); -0.828 (22:5 n3);-0.909 (20:4 n6); -0.723 (22:6 n3); and -0.862 (20:5 n3), all with p < 0.001, n = 163.

Additionally, unlike the strong positive correlations found between SUM and absolute amounts of Group 1 fatty acids, with Group 2 fatty acids we observed much poorer rho-values, being: 0.391 (20:3 n6); 0.322 (20:3 n3); 0.481 (20:2 n6); 0.244 (22:5 n3); 0.325 (20:4 n6); 0.045 (22:6 n3); and 0.251 (20:5 n3), all with p < 0.01, except 22:6 n3 (p = 0.571), n = 163. In other words, each of the fatty acids in Group 1 seemed to contribute consistently and positively to SUM throughout their concentration ranges, whereas concentrations of Group 2 fatty acids had poor associations with SUM. The positive (negative) associations between SUM and Group 1 (Group 2) percentages probably relate to the fact that Group 2 fatty acids are in general low-number/low range variables as compared with Group 1 fatty acids. The finding that SUM related positively to %OA (18:1 c9), but negatively to %AA (Figure 1-2) might explain the negative %OA vs. %AA association, previously reported [2]. Since relative amounts of all Group 1 (Group 2) fatty acids turned out to be positively (negatively) related to SUM, we should expect that all within-group percentages were positively correlated. Furthermore, we should expect that each of the Group 1 percentages were negatively related to each of the Group 2 percentages. The correlation analyses shown in Tables 2-4 are in accordance with this reasoning.
Using RANDOM numbers to further explain the correlation outcomes
Thus, in the current diet trial in chickens, we observed a striking difference between fatty acids with percentages correlating positively with %AA and those with relative amounts correlating negatively with %AA: the former ones had low variability, and generally low numbers, as compared with those correlating negatively. We previously suggested that the concentration range was the crucial point when explaining the observed positive correlations between fatty acid percentages [2-3, 15- 17]. If this hypothesis were correct, then we should be able to reproduce the results with random numbers generated with true ranges. Below we try to further explain such correlations, using random numbers, and the above “relation to SUM” approach.
Applying the above “relation to SUM approach” - as well as RANDOM numbers - to further explain correlations between fatty acid percentages
Our previous algebraic approach [2, 3, 20], involving the general equation %A + %B + %R = 100, seems to explain all of the positive correlations between %AA and relative amounts of other fatty acids. However, with our random number approach [3] we did not succeed in reproducing negative correlations, observed between true %AA and true relative amounts of Group 1 fatty acids. We accordingly investigated whether the above relationships to SUM might be a useful, alternative approach to solving this intriguing correlation outcome. First, we replaced all true values of the 22 fatty acids with uniformly distributed random numbers, generated with their true ranges. The resulting random number sum (rSUM) of these “RANDOM number fatty acids” was used as the denominator when computing fatty acid percentages. Mean (SD) value of rSUM was 14.5 (2.6), and the range was 7.9 - 20.2.
SUM vs. Group 2 fatty acid percentages
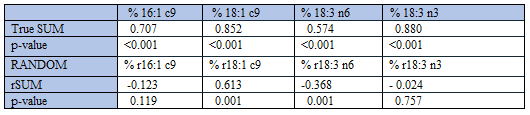
In line with the above reasoning, we found negative correlations between SUM and relative amounts of each of the Group 2 fatty acids, irrespective of using true values or random numbers (Table 5). Thus, with Group 2 fatty acids, the correlation outcome seemed to be well reproduced when using random numbers in lieu of the true values, but the correlation coefficients obtained with random numbers were generally slightly poorer than corresponding ones with true values.

In accordance with this “relation to SUM outcome”, in Group 2 we solely obtained positive correlations between the fatty acid percentages, also when using random numbers, and all correlations were with p <0.001 (results not shown).
SUM vs. Group 1 fatty acid percentages
True SUM correlated well and positively with all true Group 1 fatty acid percentages (Table 6). However, with RANDOM numbers representing Group 1 fatty acids we did not find any consistent association between their “RANDOM number percentages” and rSUM: one of the correlations was positive, one was negative, and two were non-significant (Table 6).
Thus, with Group 2 fatty acids we obtained negative correlations between SUM and the fatty acid percentages, irrespective of using true values or random numbers, thereby explaining the positive within-group associations between fatty acid percentages. However, in Group 1 the correlation outcome was inconsistent when using random numbers to study SUM vs. fatty acid percentages, a finding in line with the inconsistent within-group correlations between percentages (Table 7).
Some of the negative associations between Group 1 and Group 2 fatty acid percentages may turn to become positive when using random numbers in lieu of true values
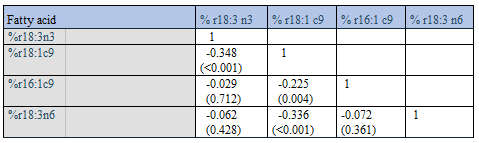
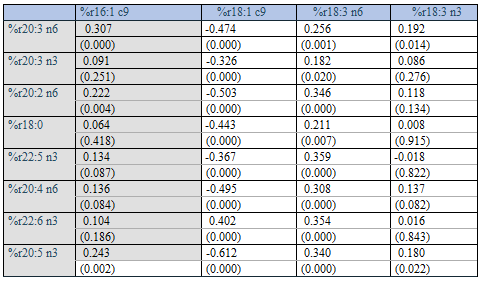
Above we showed negative associations between true relative amounts of Group 1 and Group 2 fatty acid percentages (Table 2). In keeping with this observation, we did find negative correlations between % r18:1 c9 (Group 1 fatty acid) and all “random number Group 2 fatty acid percentages” (Table 8, p < 0.001 for all). Thus, the general correlation outcome with % r18:1 c9 is in accordance with the above reasoning, but correlations were poor. With relative amounts of random numbers representing the remaining 3 fatty acids in Group 1 (i.e. 18:3 n3, 16:1 c9, and 18:3 n6), we did not manage to consistently reproduce the negative correlations with “random number Group 2 fatty acid percentages” (Table 8). These “random number Group 1 results” therefore seem to be in contrast to the consistent negative correlations observed with the true values (Table 2). Rather, instead of the expected negative associations, we found many weak positive correlations between Group 1 and Group 2 fatty acid percentages, when using random numbers (Table 8).
Approaching an Explanation
When further reasoning about the above, apparently unexpected positive association between relative amounts of random numbers of some Group 1 and Group 2 fatty acid percentages, e.g. of %20:4 n6 vs. %18:3n6 (and some other pairs), it seems that the outcome is –in fact - as should be anticipated, since these fatty acids are low-number ones (e.g. 18:3 n6 with range 0.0032 - 0.0235, and 20:4 n6 with range 0.25 – 0.42) relative to sum of the remaining fatty acids. As suggested by the results shown in Figure 2, these percentages should both be negatively related to rSum, and this couple of fatty acid percentages should accordingly be positively associated, as was verified by a correlation analysis of the random numbers (r = 0.308, p < 0.001). This outcome may be explained by the fact that Sum of random numbers representing the 22 fatty acids (rSum) did correlate negatively with % r18:3 n6 (r = -0.404, p < 0.001), and also with r %20:4 n6 (r = -0.777, p< 0.001), n = 163. But how should we explain that relative amounts of the true values of all Group 1 fatty acids correlate negatively with Group 2 fatty acid percentages (Table 2)? Indeed, we solely observed strong negative correlations between Group 1 and Group 2 fatty acid percentages, when using their true values.
Associations between SUM and absolute amounts of Group 1 fatty acids. Is there a CLUSTER regulation of Group 1 fatty acids?
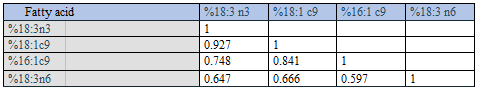
It then occurred to us that Group 1 fatty acids might be regulated in a coordinated way, i.e. that all of them might increase/decrease simultaneously. If this hypothesis were true, then we should expect a positive association between absolute amounts of all Group 1 fatty acids, provided that these fatty acids appear as members of a family cluster. A correlation analysis (Table 9) showed that absolute amounts of Group 1 fatty acids were indeed positively and strongly associated.

Since all Group 1 fatty acids might be considered as a cluster, each of them – as well as the whole cluster - should correlate positively and similarly with SUM. Indeed, as suggested by the correlation coefficients and scatterplots (Figure 1), we did observe that absolute amounts of all Group 1 fatty acids correlated nicely with SUM, especially SUM vs. 18:3 n3 and SUM vs. 18:1 c9 (Figure 1, left panels). Interestingly, also the low-number Group 1 fatty acid GLA (18:3 n6) correlated well with SUM. Thus, in the bivariate graph we observed that even this minor-amount fatty acid seemed to increase SUM considerably. In fact, with all of the four Group 1 fatty acids, we observed that their apparent impact to increase SUM was much larger than their real contributions. Discrepancies between the apparent and real contributions to the SUM may be quantified by the slopes of the regression lines; i.e. by Δ (SUM)/Δ (fatty acid). The slope values (SD) for 18:1 c9; 18:3 n3; 16:1 c9; and 18:3 n6 varied greatly, being 2.42 (0.02); 8.06 (0.10); 22.00 (0.66); and 702.98 (18.30), respectively. For example, the real contribution by 18:3 n6 to increase SUM was negligible, in spite of a steep positive association with SUM. Therefore, the apparent effect of 18:3 n6 upon SUM seems to be mainly attributed to covariation with other fatty acids, as should be expected by the suggested family cluster effect.
How does SUM of all 22 fatty acids (and % Cluster) relate to Group 2 fatty acid percentages?
With the above suggestion of a cluster family of Group 1 fatty acids at hand, we next investigated: 1) how does true SUM relate to true Group 2 fatty acid percentages (Table 10, upper part), and 2) how does true %Cluster relate to these percentages. We also investigated 3) how the sum of RANDOM numbers of all fatty acids (rSUM) relates to random number Group 2 fatty acid percentages, and 4) how RANDOM number % Cluster (% rCluster) relates to these latter, surrogate numbers (Table 10, lower part). In keeping with the reasoning above, we should anticipate negative associations. As shown in Table 10 (upper part), the true SUM (and true %Cluster) correlated negatively with relative amounts of true values of all Group 2 fatty acids.

Negative correlations were also obtained when using RANDOM numbers (Table 10, lower part); however, with % rCluster vs. random number values for Group 2 fatty acid percentages, we found poorer correlation coefficients than with true values. Nevertheless, the qualitatively similar relationships to SUM may explain the positive within Group 2 correlations between fatty acid percentages, as well as the negative correlations between Cluster fatty acid percentage and Group 2 fatty acid percentages.
Using only the SUM of Group 1 and Group 2 fatty acids in the denominator Comparing SUM vs. fatty acid percentages, using true values and RANDOM numbers
With all of the 22 fatty acids in the denominator we probably include a lot of noise, since many of the fatty acids might not be involved in the current context. Furthermore, we might wrongly have omitted one or more fatty acids from the suggested “Cluster family”. To possibly purify the next analyses, we included only fatty acids shown in Table 1 in the denominator when computing percentages. With the above new information at hand, suggesting cluster regulation of the association between Group 1 and Group 2 fatty acid percentages, we carried out some additional analyses to possibly further clarifying the previously observed negative correlations between fatty acid percentages.
Thus, if all Group 1 fatty acids do represent a family cluster, it would probably be inappropriate to use random numbers just for one of them each time to clarify whether the concentration distribution governs associations between Group 1 and Group 2 fatty acid percentages. Rather, the random numbers should reflect the complete family cluster. We accordingly made sum of Cluster random numbers in two ways; R1: uniformly distributed random numbers were sampled within the total range of the sum of all Group 1 fatty acids; and R2: we used the sum of random numbers made for each of the four Group 1 fatty acids. These Cluster sum values (R1 and R2) were added to the sum of random numbers made for each of the Group 2 fatty acids, thereby obtaining the total random number sum of Group 1 plus Group 2 random numbers (rSUM). The rSUM was used in the denominator when computing relative amounts of Cluster (% rCluster), and of each of the random numbers representing the Group 2 fatty acids. We then related relative amounts of (true or RANDOM number) Cluster to each of Group 2 fatty acid percentages. The correlation outcome was the same with R1 and R2 (not shown). To make the presentation in Table 11 more readable, we only present results obtained with the R2 approach.
SUM and %Cluster vs. Group 2 fatty acid percentages, using true values or random numbers
As expected from the above reasoning, true values of SUM and %Cluster correlated negatively with all Group 2 fatty acid percentages (Table 11, upper part). However, we obtained negative correlations also with random numbers (Table 11, lower part). Furthermore, there was a remarkable similarity between corresponding correlation coefficients obtained with true values and random numbers.
The positive associations found between individual Group 2 fatty acid percentages (not shown) are as expected from the correlation outcome shown in Table 11; correlations were qualitatively like corresponding ones found when using sum of all of the 22 fatty acids as denominator when computing percentages.
Furthermore, also with the current denominator we found inconsistent results for rS vs. individual “RANDOM number Group 1 fatty acid percentages”, and accordingly also between Group 1 and Group 2 fatty acid percentages, when using random numbers (results not shown). The finding that we - in the present and previous [3] studies - did not manage to consistently reproduce - with random numbers - negative correlations between Group 1 and Group 2 fatty acid percentages is, however, as expected if Group 1 fatty acids do represent a cluster. We might, accordingly, assume that when correlating each of the true Group 1 and Group 2 fatty acid percentages, then we probably study the relationship between relative amounts of a Group 1 fatty acid family cluster and individual Group 2 fatty acid percentages.
Thus, the negative correlations between Group 1 and Group 2 fatty acid percentages are indeed distribution dependent ones, since the correlations can be reproduced with random numbers, sampled with the true distributions of the fatty acids. In other words, when relating the true SUM to e.g. true 18:3 n6, then we actually relate SUM to a cluster of Group 1 fatty acids. We may accordingly write the equation: A + B + C + D + E + F + G + H + Cluster = SUM, where A to H represent the 8 Group 2 fatty acids, and Cluster is the sum of Group 1 fatty acids.
The fraction of e.g. A is: A/(A+B+C+D+ E + F + G + H + Cluster). This expression may be approximated to: A/(z +Cluster), where z is a small number compared to Cluster. Thus, the A fraction should decrease as Cluster increases (i.e. when Cluster goes from lowest to highest value). In contrast, the Cluster fraction, i.e. Cluster/ (z + Cluster), or 1/ (1 + z/Cluster) should increase with increasing Cluster values. Thus, %A (and also %B to % H) should decrease, whereas %Cluster increases with increasing Cluster values. Hence, we should expect inverse associations between %Cluster and each of the A to G percentages. Indeed, if we correlate %Cluster with relative amounts of individual Group 2 fatty acids, then we do obtain negative correlations, irrespective of using true or random numbers, as shown in Table 11. As expected, we did not find any significant correlations between absolute values of the random numbers generated to represent each of the Group 1 (Group 2) fatty acids (not shown).
Our present and previous analyses [2, 3, 15 - 17] seem to suggest that the particular distributions (including place on the scale/ranges/variabilities/shape of histograms) of variables like fatty acids will determine whether their relative amounts are positively or negatively associated, or not correlated at all. Thereby, such associations are truly Distribution Dependent Correlations. In our analyses we have suggested 3 ways to understand and predict direction and strength of such correlations: 1) an algebraic approach [2, 3, 15, 16, 20, 21], using the equation %B = -%A + (100 - %C) where A, B, and C represent variables (e.g. fatty acids) under investigation; 2) skewness of distributions [22], and 3) assessing the association between percentages and SUM of fatty acids (the present work). This latter approach was initiated to possibly explain negative correlations between % AA and percentages of other fatty acids, since these correlations were not easily explained by the previous approaches.
Suggested applicability of the 3 approaches, made to explain correlations between fatty acid percentages
1. The algebraic approach [2, 3, 20] seems to work well with 3 variables, two of which being low-number/low-range variables (A, B) relative to the third variable (C). In this case the equation %B = -%A + (100-%C) seems to explain the positive association between %A and %B, and the inverse %A(%B) vs %C association. Furthermore, this equation also seems suitable to explain the negative correlation between relative amounts of two high-number/high-range variables (A, B) relative to C.
2. Approach 1) does however not seem to work when trying to explain the association between relative amounts of A, B, and C, if the range of the high-number/wide-range variable (C) is narrowed towards the upper limit [22]. In this particular case, skewness seemed a relevant factor to consider. High skewness of the distribution of percentages is encountered if A, B, and C differ greatly in where on the scale they are found, and when their ranges/variabilities differ appreciably [22]. However, with the current fatty acids in breast muscle lipids of chickens, we observed skewness of the distribution of absolute amounts (g/kg) of the fatty acids. Indeed, skewness of absolute amounts of the various fatty acids were such that distributions of relative amounts (percentages) seemed to attain a close-to symmetrical (normal) distribution (see Table 1).
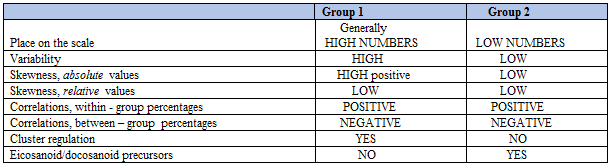
3. Relation to the SUM of fatty acids. The present analyses suggest that broad distribution, and generally high numbers of the variables, as well as high positive skewness of Group 1 fatty acids relative to the Group 2 ones might govern the observed relationships between fatty acid percentages and SUM. Also the suggested cluster effect seems to be involved. Some characteristics of Group 1 and Group 2 fatty acids are summarized in Table 12.
However, a relationship between percentages and SUM may not work when trying to explain the association between A, B, and C if A is a low-number/low-range variable (e.g. with range 0.1 – 0.15), whereas B and C are high-number/high-range variables (e.g. both with range 1 - 10). In this case there is a strong inverse association between %B and %C (rho = -0.999, p<0.001, n =163), and no correlation between A and B(C) percentages, not shown. However, in this example there is no correlation between the sum (S) of absolute amounts (S = A + B + C) and B percentage (rho = 0.022, p = 0.776) or C percentage (rho = 0.004, p = 0.957), n = 163. Thus, covariation between S and relative amounts of B and C does not explain the strong inverse %B vs. %C relationship in this case. However, the negative correlation is well explained by the eq. %B= - %C + (100 -%A) which may be approximated to %B = - %C + 100 (since %A is small), showing an inverse %B vs. %C relationship.
It seems, accordingly, that we might utilize all of the above approaches to understand associations between relative amounts of positive scale variables in general. Whatever approach used, all of them - including the suggested cluster effect - point to distribution (place on the scale, range, variability, skewness) as the real target for biological regulation, i.e. these correlations are truly distribution dependent ones. With regards to fatty acids in breast muscle of chickens, the third approach seems to be the preferred one to explain correlations between fatty acid percentages.
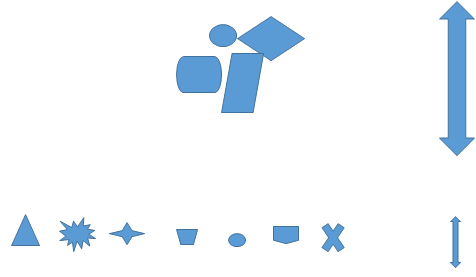
A schematic illustration of Distribution dependent correlations, as observed in chicken breast muscle, is shown in Figure 3. Group 1 fatty acids make a cluster (top group) in which the members (mostly) have high numbers and high variability, as compared with Group 2 fatty acids (bottom row). Hypothetically, Cluster fatty acid percentages are suggested to oscillate with large amplitudes; those of the other group, with small ones. The particular distributions of the fatty acids make within-group (between-group) percentages to correlate positively (negatively), as explained above.
Suggested physiological interpretation
Our results show positive associations between percentages of eicosanoid (docosanoid) precursors,
thereby possibly ensuring a balance between molecules with opposing actions. For example, AA (20:4 n6) is synthesized in the body from linoleic acid (LA, 18:2 n6), a major constituent in many plant oils. By cyclooxygenase and lipoxygenase, AA is converted into various eicosanoids, i.e. prostacyclin, thromboxane, and leukotrienes [5-7]. AA derived thromboxane A2 (TXA2) and leukotriene B4 (LTB4) have strong proinflammatory and prothrombotic properties [5, 6, 10]. Furthermore, endocannabinoids, which are derived from arachidonic acid, may have a role in adiposity and inflammation [23]. The beneficial health effects of foods rich in EPA might be related to the antagonistic effects of EPA and AA. For example, a decreased level of the serum EPA/AA ratio was reported to be a risk factor for cancer death in the general Japanese population [13]. Accordingly, a coordinated regulation of the relative abundances of EPA and AA, and possibly also of other precursor fatty acids for the synthesis of eicosanoids and docosanoids, could be of physiological interest, so that an increase (decrease) in the percentage of one of these fatty acids would be accompanied by a concomitant increase (decrease) in percentage of others. Indeed, we recently reported that that relative amounts of altogether 7 potential eicosanoid (docosanoid) precursor fatty acids were positively associated in breast muscle lipids of chickens [15]. At present we do not have an obvious physiological explanation of the negative associations between eicosanoid precursor (Group 2 fatty acid) percentages and relative amounts of “cluster fatty acids”, but Group 1 fatty acids could possibly serve as a precursor store of some of the Group 2 fatty acids.
This work was confined to studying the association between relative amounts of some fatty acids, and we do not know to what extent the suggested phenomenon of Distribution dependent correlations is valid for other fatty acids as well. Furthermore, the analyses were based upon fatty acids found in breast muscle lipids of chickens, and we do not know the generalizability of our results, as related to different organs, tissues or compartments, and to various species, including man.
The results suggest that fatty acids in breast muscle lipids of chickens are regulated by their concentration distributions (amounts/place on the scale/range/variability/skewness). Additionally, one group seems to consist of a cluster of fatty acids with coordinated regulation, but we do not know to what extent synthesis, degradation, and diet is involved. The results support our previous suggestion that associations between relative amounts of fatty acids are governed by Distribution Dependent Regulation, which - according to the present results - also involve Cluster Regulation. We hypothesize this regulation to be an evolutionary adaptation, which utilizes a mathematical rule to e.g. balance effects of eicosanoids/docosanoids, and possibly other metabolites.
We thank the collaborators at the Norwegian University of Life Sciences, and at the Animal Production Experimental Center, Ås, Norway, especially Nicole F. Nyquist.
The study of which the present one is a spin-off, was funded by grant no 190399 from the Norwegian Research Council, and Animalia; the Norwegian Meat and Poultry Research Centre.
Dear Editorial Team, Clinical Medical Reviews and Reports. My experience with the journal was highly positive. The peer-review process was rigorous, constructive, and completed in a timely manner. The reviewers provided valuable comments that helped improve the quality and clarity of our manuscript. The editorial office was professional, responsive, and supportive throughout all stages of the publication process. Communication was clear and efficient, and any questions were addressed promptly. Overall, I found the journal to maintain high scientific standards and an excellent publication workflow. I would be pleased to consider submitting future work to this journal. Best wishes from, Elena Popa.

It was my pleasure to submit my testimonial concerning the Reviewer Board of our Scientific Journal “Brain and Neurological Disorders”. The Reviewers focused on some modifications and their contribution was helpful. The ladies of our Editorial Office were also supported my efforts. It was my honor to have such a co-operation and I am looking forward for more collaboration.

Dear Grace Pierce, Editorial Coordinator of Journal of Clinical Research and Reports, Thank you for the speedy and efficient peer review process. I appreciate the fact that your peer reviewers do not take months to respond like with some other journals. I would also like to thank the editorial office for responding quickly to my questions. It is an excellent journal. I plan to submit more manuscripts in the future. Best wishes from, Robert W. McGee

Dear Grace Pierce, Editorial Coordinator of Journal of Clinical Research and Reports, Working with you and your team on our recent publication in JCRR has been a truly wonderful and enjoyable experience. The responses were prompt, and the reviewers were patient, constructive, and highly professional. One reviewer in particular gave me the feeling that a professor was carefully reading and commenting on my coursework, which was deeply touching. The entire process was straightforward and hassle‑free, with no tedious online forms to complete. I highly recommend this journal. Best wishes from, DR Aibing Rao, Head of R&D

I Appreciate the Opportunity to Share my Experience with the Journal of Clinical Research and Reports. The peer review process was timely and constructive, and the feedback provided helped improve the quality of our manuscript. The editorial office was professional, responsive, and supportive throughout the process, ensuring smooth communication and efficient handling of the submission. Overall, it was a positive experience collaborating with your team.

Dear Mercy Grace, Editorial Coordinator of Obstetrics Gynecology and Reproductive Sciences, We would like to express our gratitude for your help at all stages of publishing and editing the article. The editors of the magazine answer all the necessary questions and help at every stage. We will definitely continue to cooperate and publish other works in the Obstetrics Gynecology and Reproductive Sciences! Best wishes from, Alla Konstantinovna Politova,
