
Research Article | DOI: https://doi.org/10.31579/2637-8914/271
1Final Year Student of M.Sc Food Technology and Management, Loyola Academy, Hyderabad, Telangana State, India
2Final Year Student of M.Sc Food Technology and Management. Loyola Academy, Hyderabad, Telangana State, India
3Assistant Professor, School of Food Technology and Nutrition Loyola Academy, Hyderabad, Telangana State, India
*Corresponding Author: A. Ravinder, Final Year Student of M.Sc Food Technology and Management, Loyola Academy, Hyderabad, Telangana State, India.
Citation: Dodde Ganeshkumar, Uppuluri Naga Krishna Sai, Dr. A. Ravinder, (2024), Development and quality evaluation of Ready to Eat value added products (Cake and Wafer) from composite flour (Moringa leaves powder and Great millet & Finger millet flour), J. Nutrition and Food Processing, 7(14); DOI:10.31579/2637-8914/271
Copyright: © 2024, A. Ravinder. This is an open access article distributed under the Creative Commons Attribution License, which permits unrestricted use, distribution, and reproduction in any medium, provided the original work is properly cited.
Received: 03 October 2024 | Accepted: 18 October 2024 | Published: 04 November 2024
Keywords: finger millet; great millet; moringa leaves powder; macro; and micronutrients
The current study was conducted for the development and evaluation of millet-based food products from finger millet and great millet incorporated with moringa leaves powder. Various millet products like Cakes and Wafers were developed using finger millet and little millet along with varying combinations of other flours and raw materials. Various formulations were developed, sensory studies were conducted to the superior product based on overall acceptance using 9-point hedonic scale by the semi-trained panel members. The formulation which was rated superior was further analyzed for physico-chemical parameters like proximate analysis, microbial analysis, statistical analysis, and shelf-life studies. The proximate composition of Cakes & Wafers showed moisture (22.81, 18.32%), ash (2.80, 2.80%), fat (3.85, 1.72gm), protein (10.26,4.87gm), carbohydrate (69.53, 34.66gm) fiber (10.92, 5.88%) Thiamine (B1) (0.53,5.88mg) Riboflavin(B2) (0.15, 0.05mg) Niacin(B3) (1.16,0.84mg) Calcium (167.60, 87.28mg) Iron (3.98, 2.09mg) respectively.
Millets are group of small grained cereal food crops which are highly tolerant to drought and other extreme weather conditions and are grown with low chemical inputs such as fertilizers and pesticides. Finger millet (Eleusine coracana L.) is a prevalent grain crop in the dry parts of Asia and Africa. It prolongs to be a staple food and is known locally as “Ragi” in southern states like Karnataka, Andhra Pradesh, and Telangana, especially in Karnataka. It serves as fodder as well as grain. Its grain is the richest source of calcium and it is utilized in a wide range of food products, including cakes, puddings, sweets, and other baked products. Little Millet (Panicum Sumatrense) is a quick growing, short duration cereal which can withstand both drought and water logging. Little millet is a nutrient-dense grain that includes minerals like magnesium, phosphorus, and iron, as well as dietary fiber, protein, and B vitamins (particularly niacin and thiamine). Moringa oleifera is a kind of perennial tropical deciduous arbor belonging to the family Moringaceae, which originated in India and has been widely planted in Asia, Africa, and tropical and subtropical regions of Central America. At least 110 different compounds have been isolated from Moringa oleifera. These include vitamins A, B1, B2, B3, C and vitamin E, minerals like calcium and iron, and many flavonoids, glucosinolates, terpenes, alkaloids, saponins, sterols, fatty acids, and phenolic compounds (Abd Rani et al., 2018).
Nutritional importance of millets
Millets are high in nutrition and dietary fibre. They serve as good source of protein, micronutrients and phytochemicals. The millets contain 7-12% protein, 2-5
Raw materials were procured from local market for the preparation of cake and wafer. Refined Wheat Flour (Maida), refined sugar, edible common salt, skim milk powder, margarine, artificial flavouring agents. As per the following formulation prepare cake and wafer.
Product formulation of cake
| Ingredients (gm) | Control | C1 | C2 | C3 | C4 |
| Maida | 97 | 77 | 57 | 37 | 17 |
| Millet flour (Ragi +Jowar) | 0 | 20 (10+10) | 40(20+20) | 60(30+30) | 80(40+40) |
| Moringa leave powder | 3 | 3 | 3 | 3 | 3 |
| butter | 25 | 25 | 25 | 25 | 25 |
| sugar | 90 | 90 | 90 | 90 | 90 |
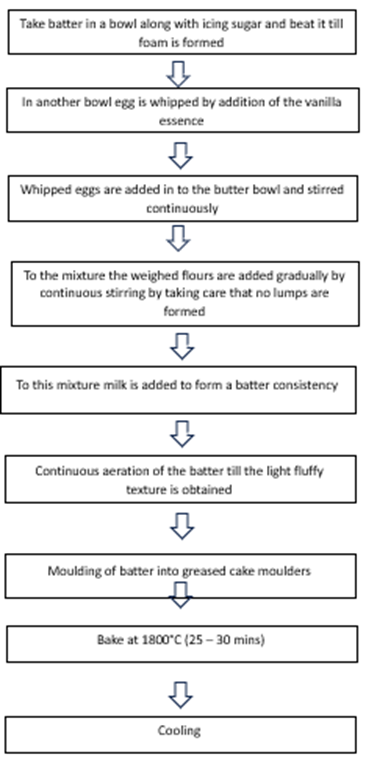
Figure: process flow diagram of preparation of cake
Product formulation of wafer
| Ingredients(gm) | Control | W1 | W2 | W3 | W4 |
| Maida | 100 | 80 | 60 | 40 | 20 |
| Millet flour (Ragi + Jowar) | 00 | 20 (10+10) | 40(20+20) | 60(30+30) | 80(40+40) |
| Moringa leaves powder | 1.5 | 1.5 | 1.5 | 1.5 | 1.5 |
| Butter | 12.5 | 12.5 | 12.5 | 12.5 | 12.5 |
| Sugar | 45 | 45 | 45 | 45 | 45 |
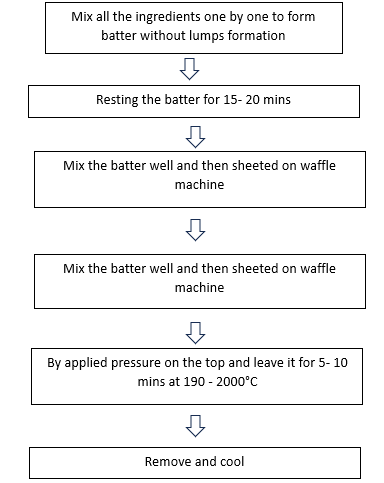
Figure: process flow diagram of preparation of wafer
The value-added products were prepared from moringa leave powder incorporated with millets. Those products were subjected to proximate analysis, vitamin and mineral were estimated. The quality evaluation of value-added products was done. It includes Proximate analysis, Microbial analysis, Shelf life studies, and statical analysis.
| Parameters | Cake | Wafers | ||
| control | sample | control | sample | |
| Moisture content (%) | 23.99 | 22.81 | 18.32 | 17.76 |
| Protein (g) | 11.67 | 10.26 | 6.49 | 4.87 |
| Carbohydrate (g) | 75.10 | 69.53 | 37.97 | 34.66 |
| Fat (g) | 2.99 | 3.85 | 1.30 | 1.72 |
| Crude fiber (g) | 4.34 | 10.92 | 2.96 | 5.88 |
| Ash (g) | 1.84 | 2.80 | 1.58 | 2.80 |
Table: Proximate analysis of cake and wafer

Figure: Graph of proximate analysis of cake and wafer
The Moisture and Crude fiber contents of control and sample were observed 23.99%,4.34,22.81% and 10.92gm/100gm respectively. The Moisture and Crude fiber contents of control and sample were observed 18.32%,2.96,17.76% and 5.88gm/100gm respectively.
Vitamin content of cake and wafer
| Vitamins(mg) | Cake | Wafers | ||
| control | sample | control | sample | |
| Thiamine (B1) | 0.37 | 0.53 | 0.294 | 0.37 |
| Riboflavin(B2) | 0.079 | 0.15 | 0.049 | 0.05 |
| Niacin (B3) | 0.85 | 1.16 | 0.469 | 0.84 |
The Thiamine and Niacin contents of control and sample were observed 0.37,0.85,0.53and 1.16mg/100gms respectively. The Thiamine and Niacin contents of control and sample were observed 0.294,0.469,0.37 and 0.84mg/100gms respectively.

Graph of Vitamin analysis of cake and wafer Mineral contents of cake and wafer
| MINERALS (mg) | cake | wafer | ||
| control | sample | control | sample | |
| Calcium | 27.36 | 167.60 | 19.71 | 87.28 |
| Iron | 1.97 | 3.98 | 1.091 | 2.09 |
The Calcium and Iron contents of control and sample were observed 27.36,1.97,167.60 and 3.98mg/100gms respectively. The Calcium and Iron contents of control and sample were observed 19.71,1.091,87.28 and 2.09mg/100gms respectively
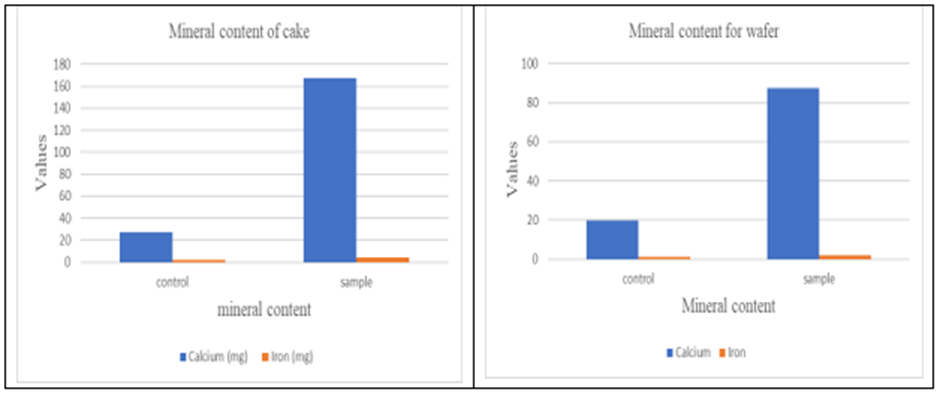
Graph of Mineral analysis of Cake and Wafer
Microbial analysis for cake and wafer
| Days | Cake | Wafer | ||
| Control | Sample | Control | Sample | |
| Colony forming unit (CFU/ gm) X 10-2 | ||||
| 0 | 0 | 0 | 0 | 0 |
| 15 | 0 | 0 | 0 | 0 |
| 30 | 2 | 1 | 2 | 0 |
| 45 | 10 | 3 | 3 | 1 |
As per microbial analysis for cake, control and sample C4 for 0th and 15th day is ‘0’ (CFU/gm) X 10-2, 30th day control has formed 2 and sample C4 formed 1 (CFU/gm) X 10-2 and 45th day control sample has formed 10 and sample C4 has formed 3 (CFU/gm) X 10-2 . As per microbial analysis for Wafer, control and sample C4 for 0th and 15th day is ‘0’ (CFU/gm) X 10-2, 30th day control has formed 2 and sample C4 formed 0 (CFU/gm) X 10-2 and 45th day control sample has formed 3 and sample C4 has formed 1 (CFU/gm) X 10-2 .
Shelf-life studies of cake
| Product | Duration | Appearance | colour | texture | Taste | Overall acceptability |
Control (Sample (C4) | 0th day | 7.5 ± 0.01 (8.2±0.05) | 7.4 ±0.03 (8.2±0.02) | 7.5 ± 0.01 (8.3±0.03) | 7.7±0.02 (8.3±0.01) | 7.8±0.03 (8.5±0.02) |
| 15th day | 6.9±0.03 (7.8 ±0.02) | 6.5±0.01 (7.7±0.02) | 7.0±0.01 (7.6±0.03) | 7.3±0.02 (7.5±0.02) | 7.0 ±0.02 (7.4 ±0.06) | |
| 30th day | 6.1 ±0.04 (7.0 ±0.03) | 5.9 ±0.03 (6.9±0.02) | 6.6 ±0.03 (6.9±0.01) | 6.6±0.06 (6.9±0.06) | 6.2 ±0.03 (6.7 ±0.07) | |
| 45th day | 4.6 ±0.04 (5.2 ±0.04) | 4.4±0.02 (5.3±0.01) | 4.4±0.02 (5.2±0.01) | 4.9±0.05 (5.2±0.06) | 4.5 ±0.01 (5.0 ±0.07) |
shelf-life studies of wafers
| Product | Duration | Appearance | colour | texture | Taste | Overall acceptability |
Control (Sample (W4)) | 0th day | 7.8 ±0.03 (8.6 ± 0.02) | 7.6 ±0.02 (8.5±0.03 | 7.6 ±0.01 (8.4± 0.05 | 7.6 ± 0.02 (8.6±0.06) | 7.6 ±0.02 (8.8 ±0.03) |
| 15th day | 7.0 ±0.03 (7.9) ±0.02) | 6.8 ±0.03 (7.0±0.04) | 6.7±0.02 (7.1±0.01) | 6.8 ±0.05 (7.3±0.07) | 6.7 ±0.06 (7.9 ±0.07) | |
| 30th day | 5.2 ±0.01 (6.5) ±0.02) | 5.0 ±0.06 (6.2±0.05) | 5.9 ±0.01 (6.8±0.03) | 5.4 ±0.03 (6.6±0.04) | 5.6 ±0.04 (6.9 ±0.05) | |
| 45th day | 4.5 ±0.05 (5.5±0.07) | 4.6 ±0.04 (5.3±0.02 | 5.1 ±0.01 (5.6±0.02) | 4.7 ±0.05 (5.4±0.02) | 4.6 ±0.02 (5.3 ±0.01) |
Statistical analysis:
statistical analysis of cake
SAMPLE
| SENSORY ATTRIBUTES | ||||
| Appearance | Colour | Taste | Texture | Overall Acceptability | |
| CONTROL | 7.5± 0.01 | 7.4± 0.03 | 7.5± 0.01 | 7.7± 0.02 | 7.8± 0.03 |
| C1 | 7.4± 0.03 | 7.2± 0.04 | 7.4± 0.02 | 7.3± 0.04 | 7.5± 0.02 |
| C2 | 7.3± 0.06 | 7.1± 0.08 | 7.5± 0.04 | 7.5± 0.05 | 7.2± 0.06 |
| C3 | 7.2± 0.04 | 7.3± 0.01 | 7.2± 0.06 | 7.4± 0.02 | 7.3± 0.04 |
| C4 | 8.2± 0.05 | 8.2± 0.02 | 8.3± 0.03 | 8.3± 0.01 | 8.5± 0.02 |

Graph of mean values for cake
As per statistical analysis the highest mean score of sample 4 is superior, so we consider sample C4 was made from., Maida -17gm, millet powder (ragi, jowar) – 40 + 40 gm, moringa leaves powder – 3gm, butter – 25gm, sugar 90 gm
statistical analysis of wafers
| Sample | Sensory attributes | ||||
| Appearance | Colour | Taste | Texture | Overall Acceptability | |
| CONTROL | 7.8 ± 0.03 | 7.6± 0.02 | 7.6±0.01 | 7.6± 0.02 | 7.6± 0.02 |
| W1 | 7.7 ± 0.02 | 7.7± 0.03 | 7.7±0.06 | 7.7± 0.04 | 7.8± 0.01 |
| W2 | 7.7± 0.05 | 7.9± 0.02 | 7.7±0.02 | 8.1± 0.08 | 7.7± 0.05 |
| W3 | 7.7± 0.07 | 7.9± 0.05 | 7.8±0.04 | 7.8± 0.06 | 7.8± 0.02 |
| W4 | 8.6 ± 0.02 | 8.5± 0.03 | 8.4±0.06 | 8.6± 0.05 | 8.8± 0.03 |
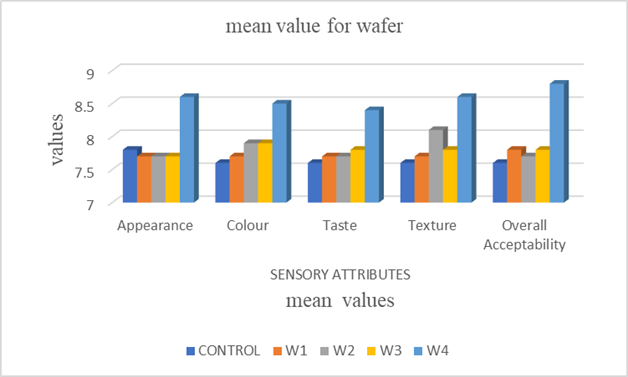
Graph of mean value for wafer
As per statistical analysis the highest mean score of sample 4 is superior, so we consider sample C4 was made from., Maida -10gm, millet powder (ragi, jowar) – 20 + 20gm, moringa leaves powder – 3gm, butter – 12.5gm, sugar 45gm.
The main aim of the project work presented was related to development and evaluation of millet-based products from finger millet and great millet incorporated with moringa leaves powder. Millet flour products prepared and evaluated were cakes and wafers. Millet flour products are developed by incorporating major millet i.e., finger millet and great millet. Various formulations of these products are standardised through various proportions of ingredients and compared with control products through sensory evaluation. The sensory qualities of developed products are judged by semi-trained panel members on 9-point hedonic scale rating test. The best acceptable products obtained through sensory evaluation are analysed for physico-chemical parameters like proximate analysis, shelf life of developed products was studied for a period of 45 days The physico-chemical parameters revealed that the developed millet products are excellent source of macro and micronutrients especially in terms of protein, calcium and dietary fibre when compared against control products.
Nutritionists are encouraging incorporation and utilization of non-glutinous ingredients in different recipes with least effort and low cost for combating malnutrition. The novelty of this project work is utilisation of millets for development of various traditional and value-added products. Due to urbanisation and increase in consumption of processed foods, people in the society are facing the issues of non-communicable diseases like obesity, diabetes, and hypertension. The major issues related to occurrence of lifestyle disease are high consumption of wheat and rice based processed products which are devoid of fibre. Lifestyle diseases can be minimised to large extent by creating awareness among consumers to consume millet and millet products which are good source of dietary fibre, complex carbohydrates and minerals like calcium and iron. By consumption of millets and millet products, nutritional security can be provided to the citizens in the country. Millets can contribute to healthier society. Millets can prevent diseases related to malnutrition. The developed products can be consumed by all age groups and are highly recommended for people suffering from diabetes, hypertension etc.
Dear Editorial Team, Clinical Medical Reviews and Reports. My experience with the journal was highly positive. The peer-review process was rigorous, constructive, and completed in a timely manner. The reviewers provided valuable comments that helped improve the quality and clarity of our manuscript. The editorial office was professional, responsive, and supportive throughout all stages of the publication process. Communication was clear and efficient, and any questions were addressed promptly. Overall, I found the journal to maintain high scientific standards and an excellent publication workflow. I would be pleased to consider submitting future work to this journal. Best wishes from, Elena Popa.

It was my pleasure to submit my testimonial concerning the Reviewer Board of our Scientific Journal “Brain and Neurological Disorders”. The Reviewers focused on some modifications and their contribution was helpful. The ladies of our Editorial Office were also supported my efforts. It was my honor to have such a co-operation and I am looking forward for more collaboration.

Dear Grace Pierce, Editorial Coordinator of Journal of Clinical Research and Reports, Thank you for the speedy and efficient peer review process. I appreciate the fact that your peer reviewers do not take months to respond like with some other journals. I would also like to thank the editorial office for responding quickly to my questions. It is an excellent journal. I plan to submit more manuscripts in the future. Best wishes from, Robert W. McGee

Dear Grace Pierce, Editorial Coordinator of Journal of Clinical Research and Reports, Working with you and your team on our recent publication in JCRR has been a truly wonderful and enjoyable experience. The responses were prompt, and the reviewers were patient, constructive, and highly professional. One reviewer in particular gave me the feeling that a professor was carefully reading and commenting on my coursework, which was deeply touching. The entire process was straightforward and hassle‑free, with no tedious online forms to complete. I highly recommend this journal. Best wishes from, DR Aibing Rao, Head of R&D

I Appreciate the Opportunity to Share my Experience with the Journal of Clinical Research and Reports. The peer review process was timely and constructive, and the feedback provided helped improve the quality of our manuscript. The editorial office was professional, responsive, and supportive throughout the process, ensuring smooth communication and efficient handling of the submission. Overall, it was a positive experience collaborating with your team.

Dear Mercy Grace, Editorial Coordinator of Obstetrics Gynecology and Reproductive Sciences, We would like to express our gratitude for your help at all stages of publishing and editing the article. The editors of the magazine answer all the necessary questions and help at every stage. We will definitely continue to cooperate and publish other works in the Obstetrics Gynecology and Reproductive Sciences! Best wishes from, Alla Konstantinovna Politova,
