
Research Article | DOI: https://doi.org/10.31579/2690-4861/311
1 Department of Information Science, Faculty of Computing and Informatics, Jimma Institute of Technology, Jimma University, Oromia, Ethiopia.
2 Department of Epidemiology, Jimma Institute of Health, Jimma University, Oromia, Ethiopia.
*Corresponding Author: Chala Diriba, Gülhane Department of Information Science, Faculty of Computing and Informatics, Jimma Institute of Technology, Jimma University, Oromia, Ethiopia.
Citation: Diriba C., Jimma W., Merga H., (2023), Developing Risk Level Prediction Model and Clinical Decision Support System for Cardiovascular Diseases in Ethiopia, International Journal of Clinical Case Reports and Reviews, 13(5); DOI: 10.31579/2690-4861/311
Copyright: © 2023, Chala Diriba. This is an open-access article distributed under the terms of the Creative Commons Attribution License, which permits unrestricted use, distribution, and reproduction in any medium, provided the original author and source are credited.
Received: 02 May 2023 | Accepted: 15 May 2023 | Published: 23 May 2023
Keywords: cardiovascular diseases; fuzzy logic; data mining; decision support system
Cardiovascular diseases have become one of the severe health problems in both developing and developed countries. This research aimed to develop a risk level prediction model and clinical decision support system for CVD in Ethiopia using data mining techniques. A total of 4004 datasets were used to develop the model. Moreover, primary data was collected from the domain experts via interviews and questionnaires. The domain experts identified thirty-one risk factors, of which only eleven attributes were selected after experimentation to develop the model. Based on the result of experimentation, the model was developed by an unpruned J48 classifier algorithm which produced F-Measure 0.877, which is comparatively the best algorithm. The prototype system was developed by Visual C# studio tool. The developed prototype system helps health care providers to identify risk level CVD diseases. It was developed using a data mining technique, which can efficiently predict cardiovascular disease risk levels. However, developing the model by using more datasets and changing the default setting of WEKA, a data mining tool, will be the future work of this study.
Healthy populations contribute significantly to a country's economic success because they can live longer, be more productive, and save more. Unfortunately, Ethiopia has a poor health status and weak health care systems and infrastructure, compared to other low-income countries, even within Sub-Saharan Africa [1]. The low life expectancy in Ethiopia, only 58.37 years, results from poor health facilities [2]. Modern diagnostic equipment typically needs sophisticated infrastructure, consistent electrical power, expensive reagents, lengthy examination duration, and skilled professionals, none of which are available in environments with minimal resources [3]. The failure to correctly diagnose many communicable and non-communicable illnesses also plays a crucial role in mortality. This is far higher in developing countries than in developed countries.
Non-communicable diseases (NCDs), such as cancer, chronic respiratory conditions, cardiovascular, and diabetes, cause the death of over 40 million people each year, accounting for 70% of all deaths worldwide [4]. Over 80% of these deaths affect 15 million people between the ages of 30 and 69 every year in low and middle-income countries.
In the world, cancers account for 8.8 million deaths from NCDs each year, followed by respiratory (3.9 million), diabetes (1.6 million), and cardiovascular diseases (17.7 million) [4]. A few decades ago, it was considered to be a developed-nation issue. However, reports indicate that it is becoming a significant health issue for middle- and low-income countries. It estimated the total economic losses in low- and middle-income countries between 2011 and 2025 at USD 7 trillion [5]. In addition, it is the second largest cause of death overall, and the primary cause of death for people over 30 is CVD [6].
According to the Global Burden of Disease research, CVD caused roughly 32% of all deaths globally in 2013, with around 80% of these deaths happening in low- and middle-income countries [7]. Heart failure, rheumatic heart disease, congenital heart disease, ischemic heart disease, cerebrovascular disease, and peripheral vascular disease are the six different types of cardiovascular diseases. In most Sub-Saharan African countries, rheumatic heart disease was the most frequent cardiovascular disease, followed by hypertensive heart disease, but little was known about the pattern of congestive heart failure in Ethiopia. However, in a study done by [8] at Black Lion Specialized Hospital medical ward to evaluate the severity of rheumatic heart disease, it was found that this heart disease was a common cause of mortality (26.5%). Additionally, the most prevalent primary diagnosis in Ethiopia was rheumatic heart disease (62%), with a substantially more significant proportion in the third decade of life [9]. According to another study, this condition is the main contributor to cardiovascular disease and mainly affects young people [10].
A large fraction of the cases was also caused by hypertensive and ischemic cardiac conditions [11]. Cardiovascular diseases (CVDs) generally place a significant financial and health burden on developing nations. Risk variables include age, echocardiogram, heart rate, diabetes, slope, hypertension, high cholesterol, and physical inactivity are the critical factors used to predict heart disease. Many of these obvious risk factors are present in heart disease patients, making it possible to identify them promptly. The major CVD risk factors are elevated blood pressure, obesity, and physical inactivity were more prevalent in urban populations, while binge drinking and cigarette smoking were more prevalent in rural areas [12].
Most CVD cases depend on a complicated combination of clinical and pathological evidence for risk level prediction. Therefore, it is essential to have the correct diagnosis as soon as possible. The risk level categories for a 10-year total risk of a fatal or non-fatal CVD event include 10% classed as "low risk," 10- 20% as "moderate risk," 20- 30% as high risk, and 30% as "very high risk," according to (WHO, 2017) [13].
Cardiologists are highly scarce in developing nations, as is the situation with Ethiopia's primary-level hospitals (sometimes referred to as district hospitals). It is challenging to make accurate diagnoses and administer the proper treatments in Ethiopia and other developing nations when there is a lack of facilities, such as lab equipment and professionals. Furthermore, because primary-level hospitals lack advanced medical technology and lack the competence needed to perform high-quality medical procedures, forecasting the risk level of CVD is hardly ever attainable.
The decision support system (DSS) can be beneficial in predicting heart disease risk [14]. It can lessen medical errors that result in fatalities, improve patient safety, and save lives [15]. Additionally, it can deliver knowledge and person-specific information intelligently filtered and given at the right time to physicians, staff, patients, and others to improve healthcare [16]. Implementing DSS serves to support rather than replace [17]. The cost-effectiveness of DSS implementation should also be taken into consideration by low- to medium-income countries [18]. DSS to be utilized at point-of-care (POC) can save hundreds of thousands of lives per year in environments with low resources or where it is exceedingly difficult to physically access critical facilities.
Healthcare organizations that use data mining technologies have the power to predict future patient needs, wants, and conditions in order to make appropriate and effective treatment decisions. Data mining techniques are particularly effective and efficient for building DSS [19]. Healthcare professionals receive incredible knowledge, support and experience through predictive data mining. A prediction algorithm's goal is to predict future values based on historical data. To provide precise and trustworthy aid in developing prognosis, diagnosis, and treatment planning processes. Neural networks, regression, support vector machines (SVM), and discriminant analysis are a few examples of standard prediction algorithms.
Recently, control and failure detection tasks have been predicted using data mining approaches such as neural networks, fuzzy logic systems, evolutionary algorithms, and rough set theory [21]. Based on these clinical parameters, the DSS algorithm created for the prediction of heart disease produces prediction accuracy that is close to 80%. (Chen, 2011). Additionally, the proposed method created by [22] employing neural networks predicted the CVD risk with a 98.57
Study Sites
The data were collected from different public specialized hospitals in Ethiopia. It includes Jimma University, Black Lion Specialized Hospital and Alert Specialized Hospitals. These hospitals were selected purposely due to their provision of advanced treatment for the diseases.
Study population
The populations of the study were domain experts. Domains experts were to identify risk factors, validate extracted rules and perform user acceptance testing.
Data type and sources
For this research, both primary and secondary data were used. Secondary data were collected from books, journal articles and websites, while primary data were collected from domain experts and patient records.
Sampling
A purposive sampling technique was used to select the hospitals, and patients' records were systematically selected. For the selection of the domain experts, a purposive sampling technique was employed by considering their specialization and experience in the area.
Data collection method
Necessary data were collected by interviewing the professionals in the area to get detailed information about risk factors of CVDs, validate extracted rules and questionnaire for user acceptance testing. In addition, patients' cases of cardiovascular disease were collected from hardcopies of patients' history from the hospitals mentioned above.
Accordingly, the following cardiovascular disease risk factors were identified as depicted in table 1.
| No. | Risk factors | Description |
| Gender | male/female | |
| Age | Years | |
| Total Cholesterol | mmol/L | |
| HDL Cholesterol | mmol/L | |
| Systolic blood pressure | mm HG | |
Blood pressure treatment (anti-hypertensives prescribed) | yes/no | |
| Smoking | yes/no | |
| Diabetes | yes/no | |
| Body Mass Index | kg/m2 | |
| LDL cholesterol | mmol/L | |
| Triglycerides | mmol/L | |
| C-reactive protein (CRP) | mg/L | |
| Serum fibrinogen | g/l | |
| Gamma glutamyl transferase (gamma GT) | IU/L | |
| Serum creatinine | g/L | |
| Glycated haemoglobin (HbA1c) | % | |
| Forced Expiratory Volume (FEV1) | % | |
| AST/ALT ratio | - | |
| Family history of CHD < 60> | yes/no | |
| Townsend deprivation index | 1st quintile (most af¯uent)± 5th quintile (most deprived); unknown | |
| Hypertension | yes/no | |
| Rheumatoid arthritis | yes/no | |
| Atrial fibrillation yes/no | yes/no | |
| Chronic obstructive pulmonary disease (COPD) | yes/no | |
| Severe mental illness | yes/no | |
| Prescribed anti-psychotic drug | yes/no | |
| Prescribed oral corticosteroids | yes/no | |
| Prescribed immunosuppressant | yes/no |
Table 1: Cardiovascular risk factors
Source (Weng et al., 2017)
The study has several components, including building the model and developing a decision support system. The dataset was processed using the WEKA tool, and different data mining classifiers were applied to build the model. In addition, the cross-Industry Standard Process for Data Mining (CRISP-DM) method was employed. This method includes business understanding, data understanding, data preparation, modelling, evaluation and deployment. The data were acquired from different hospitals in Ethiopia to provide evidence for generating the rule sets used during the decision support process. Today's healthcare industry creates massive amounts of complex data on patients, hospitals, disease diagnoses, electronic patient records, and medical gadgets. Data mining is a technique for uncovering previously unknown patterns and trends in databases to develop predictive models. A large amount of data is a crucial resource to be processed and analyzed for knowledge extraction and support cost savings and decision-making.
The extracted rules, which were done by using a data mining technique, were validated by experts. Then DSS for risk level prediction of cardiovascular diseases was developed by extracted rules. WEKA software and Visual C# studio programming were used for risk level model and system development, respectively. Model performance testing was done by experimenting using different data mining classifiers and calculated by using recall, precision and F-Measure. Finally, the user acceptance testing was conducted by participating professionals. Accordingly, user acceptance testing data were collected using a questionnaire, which was analysed using the ResQue (Recommender Systems' Quality of user experience) model.
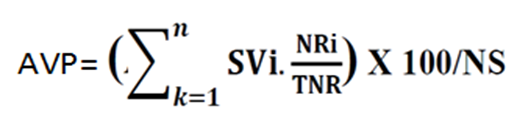
Where, AVP is average performance scale value (SV) and, TNR is total number of respondents, NS is number of scale and NR is number of respondents.
Then the result of user acceptance average performance is calculated out 100%.
This study's objective was to develop a risk level prediction system for cardiovascular diseases using data mining techniques. For this study, data were collected from a total of 4004 patients' records from Jimma University, Black Lion and Alert Specialized Hospitals. Then, it was coded in excel and changed into a file in the format Weka software understands: Comma delimited (.CSV) data file. Then, the data were inserted into Weka to preprocess and remove redundancies, fill missed values, correct related values to the attributes, and type missed values. Then, the first scenario experiments were done with all data and all attributes by using classifier algorithms. After this scenario attributes, a section was done on the preprocessed data. In the end, 11 attributes were selected from 31 attributes. Then, using the selected 11 attributes, the second scenario was performed using different classification algorisms like Naïve Bayes, PART and J48. Finally, unpruned J48 decision tree algorism was used to construct the model.
Many experiments were done on this data for preprocesses, attribute selection and model development. While information gain, CFS subset evaluator and information gain ratio were done for attributes selection, Naïve Bayes, PART and J48 were performed for classifications. For this study, as different scholars used it, 10-fold cross-validation was employed. For instance, it is recommended that 10-fold-validation is the correct number of folds to get the best estimate of error, and there is also some theoretical evidence that backs this up, like 10-fold cross-validation has become the standard method in practical terms. In addition, to select the best algorithms, the researchers selected a confusion matrix to calculate precision, recall and F-Measure. Since F-measure (also known as F1 or F-score) is a measure of a test's accuracy, it considers both the test's precision and recalls to compute the score. It can be interpreted as a weighted average of the precision and the recall, where 1 is its best value and 0 is its worst. The F-Measure only produces a high result when precision and recall are balanced; thus, using this technique is very significant. Moreover, the researchers used a 70% split test. The details of the experiments were discussed as follows.
Experiment
This sub-section is the backbone of the study; the results are presented and discussed. To achieve this study's objective, different experiments were done using data mining algorithms. However, PART induction decisions, J48, and Naïve Bayes classifiers algorithms showed good performance compared to the rest of the data mining classifiers. Therefore, the experiments of those algorithms were presented and discussed as follows by categorizing them into two big scenarios/experiments with all trained data and with the selected attributes.
Model Building Using Naïve Bayes classifier with all the training data
Naïve Bayes classifier use estimator classes. The precision levels of numeric estimators are determined by analyzing the training data. Based on this concept, correctly classified instances were 2831(70.7043%), and incorrectly classified instances were 1173(29.2957%). This was confirmed by confusion matrix results generated, which are presented by shaded cell values 2831, equal with correctly classified instances, and unshaded cell values 1179, equal with incorrectly classified instances, as presented in table 2. In addition, Naïve Bayes produced 0.706 F-Measure. This was relatively poor compared to the two algorithms.
| Low | High | Medium | |
| 2099 | 55 | 315 | Low |
| 75 | 239 | 371 | High |
| 287 | 70 | 493 | Medium |
Table 2: Naïve Bayes Confusion Matrix
Model Building Using PART classifier
The experiment was conducted by using a PART classifier. By this classifier, two scenarios were applied: pruned PART rule induction and unpruned PART rule induction classifier.
In the first scenario, the algorithm pruned PART rule induction containing 4004 instances with 31 attributes was performed. It took 2.48 seconds to build the model and generated 154 numbers of rules. It is presented in table 3 below. In addition, the model built with pruned PART rule induction with all attributes correctly classified (predicted the correct outcome) 3441(85.9391%) instances while 563(14.0609%) of the instances were classified incorrectly. In addition, the accuracy of the algorithms by F-Measure produced 0.857 performances. Therefore, it can be said that pruned PART rule induction showed good performance.
In the second scenario, unpruned PART rule induction with all data and attributes was performed. It took 17.11 seconds to build the model and generated 763 rules. In addition, correctly classified instances 3577(89.3357%) and incorrectly classified instances 4279 (10.6643 %). In addition, it showed a 0.893 F-Measure. As a result, unpruned PART rule induction showed the best performance compared to Naïve Bayes and pruned PART rule induction.
Model Building Using J48 classifier
This classifier also has two experiments J48 pruned decision tree with all attributes and a J48 unpruned decision tree with all attributes. J48 is another popular data mining algorithm. J48 pruned decision tree was used in this first experiment. This algorithm showed 251 numbers of leaves, 394 sizes of the tree and 0.41 seconds to build the model. In addition, correctly classified instances 3432 (85.7143 %), incorrectly classified instances 572 (14.2857 %). Moreover, the F-Measure generated by algorism was 0.856.
In the second experiment, J48 unpruned decision tree which generates 952 numbers of leaves, 1416 sizes of the tree and 0.35 seconds to build the model. Adding, correctly classified instances were about 3580 (89.4106 %) incorrectly classified instances were 424 (10.5894 %). Moreover, this algorithm produced 0.893 F-Measure. In conclusion, based on the experiment done for all data and attributes, the J48 unpruned decision tree showed the best performance. The summary is depicted in below table 3.
| Type of classifier | TP | FP | Precision | Recall | F-Measure |
| Naïve Bayes with all attributes | 0.707 | 0.198 | 0.727 | 0.706 | 0.706 |
| Pruned PART rule induction with all attributes | 0.859 | 0.125 | 0.857 | 0.859 | 0.857 |
| Unpruned PART rule induction with all attributes | 0.887 | 0.098 | 0.887 | 0.887 | 0.886 |
| J48 pruned decision tree with all attributes | 0.857 | 0.117 | 0.857 | 0.857 | 0.856 |
| J48 unpruned decision tree with all attributes | 0.894 | 0.096 | 0.893 | 0.894 | 0.893 |
Table 3: Summary of the performance of all algorithms used to build models
Attributes selection
Attributes selection is essential to select necessary attributes and remove insignificant attributes to develop a clear and good model. Therefore, to select significant attributes WEKA, the data mining tool has different techniques such as correlation-based feature selection (CFS) subset evaluator, classifier attribute eval, classifier subset evaluator, correlation attribute eval, gain ratio attribute eval and information gain attribute eval. All the experiments were done by algorithms which the WEKA tool support but correlation-based feature selection (CFS) subset evaluator, gain ratio attribute eval, and information gain attribute eval produced excellent performance compared to the rest of the algorithms. The experiment of these algorithms is briefly described below.
CfsSubsetEval: Correlation-based Feature Selection (CFS) Subset Evaluator
CFS Subset Evaluator evaluates the worth of a subset of attributes by considering each feature's individual predictive ability and the degree of redundancy between them. As a result of this technique, only seven attributes were selected from 31 attributes, i.e., age, smoking, family history of coronary heart disease < 60>
Figure 1: Attribute selection by Cf s Subset Eval
Information gain
Information gain evaluates the worth of an attribute by measuring the information gained with respect to the class. It gives the rank for all attributes based on their information gain. The highest information gain is at the top of the list, while the lowest information gain is at the bottom. The best attribute is the one which has an information gain of one (1), and the worst is zero (0). In addition, the attributes were selected by average information gain; only those with greater than average information gain were identified as good attributes for model development. Accordingly, age, hypertension, systolic blood pressure, blood pressure treatment, diastolic blood pressure, smoking and gender were the attributes selected, which produced information again greater than average, i.e. 0.04426, as depicted in figure 2 below.
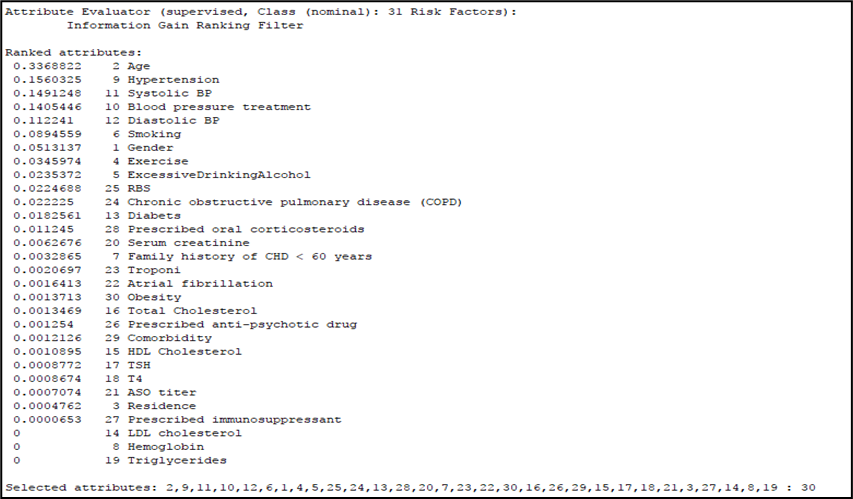
Figure 2: Attributes selection by Information gain
Information gain ratio
Information gain ratio evaluates the worth of an attribute by measuring the gain ratio with respect to the class. Using an information gain ratio algorithm for attributes selection of smoking, hypertension, blood pressure, treatment, excessive drinking of alcohol, age, diabetes, systolic blood pressure, diastolic blood pressure, exercise, chronic obstructive pulmonary disease and gender. This indicates that from 31 risk factors of cardiovascular diseases, only 11 attributes were selected by the information gain ratio technique (Figure 3).
In conclusion, after the three experiments, some of the attributes were identified by the three algorithms, information gain ratio almost covered attributes selected by both information again and (CFS) Subset Evaluator and included more attributes than the two algorithms. Based on these results, the information gain ratio was selected as the best algorithm for attribute selection. Finally, the model was developed using smoking, hypertension, blood pressure treatment, excessive drinking of alcohol, age, diabetes, systolic blood pressure, diastolic blood pressure, exercise, chronic obstructive pulmonary disease and gender.

Figure 3: Attributes selection by Information gain ratio
Experiments with selected attributes
The algorithm was run on a complete training set containing 4004 instances with the selected 11 attributes by Naïve Bayes, pruned PART rule induction, unpruned PART rule induction, pruned J48 decision tree and unpruned J48 decision tree Classifier.
Model Building Using Naïve Bayes Classifier selected attributes
In the second scenario, the algorithm was run on a complete training set containing 4004 instances with selected 11 attributes. It took 0.02 seconds to build the model, and the model generated correctly classified instances 2897 (72.3526 %), incorrectly classified instances 1107 (27.6474 %.) and 0.708 F-Measure.
Model Building Using PART rule induction
Using pruned PART rule induction, 182 rules were generated, and it took 0.63 seconds to build the model, correctly classified instances 3478 (86.8631 %) and incorrectly classified instances 526 (13.1369 %), and 0.867 F-Measure.
In addition, the data were tested by unpruned PART rule induction, which generated 349 rules in 1.2 seconds to build the model, correctly classified instances 3457 (86.3387%) and incorrectly classified instances 547 (13.6613 %), and 0.861 F-Measure.
Therefore, it is possible to conclude that from the two-part rule induction, pruned PART rule induction yielded better performance. Moreover, not only with unpruned PART rule induction, it also provided better performance than naïve Bayes.
Model Building Using J48 decision tree Classifier
J48 decision tree classifier is another algorithm for data mining to develop a model. Since then, the J48 decision tree classifier has been used to determine the most appropriate model for the data. It has two techniques pruned J48 decision tree classifier and an unpruned J48 decision tree classifier. By the first technique, pruned J48 decision tree classifier, the experiment showed 131 number leaves, 261 sizes of the tree, in 0.11 seconds to build the model, correctly classified instances 3385 (84.5405 %), incorrectly classified instances 619 (15.4595 %) and 0.843 F-Measure. By the second unpruned J48 decision tree classifier, 344 number of leaves, 687 sizes of the tree, 0.1 seconds to build model, correctly classified instances 3517 (87.8372 %), incorrectly classified instances 487 (12.1628 %) and 0.877 F-Measure were generated. In conclusion, the unpruned J48 decision tree classifier was the best algorithm to develop the expected model. The summary of the algorithm is presented in table 4 below, and a comparison of Naïve Bayes, PART rule induction and J48 decision tree models with selected attributes is shown in table 5.
| Low | High | Medium | |
| 2348 | 32 | 89 | Low |
| 59 | 540 | 86 | High |
| 174 | 47 | 629 | Medium |
Table 4: Confusion Matrix
| Type of classifier | TP | FP | Precision | Recall | F-Measure |
| Naïve Bayes with selected attributes | 0.724 | 0.228 | 0.701 | 0.724 | 0.708 |
| Pruned PART rule induction with selected attributes | 0.869 | 0.121 | 0.866 | 0.869 | 0.867 |
| Un pruned PART rule induction with selected attributes | 0.863 | 0.119 | 0.860 | 0.863 | 0.861 |
| J48 pruned decision tree with selected attributes | 0.845 | 0.130 | 0.842 | 0.845 | 0.843 |
| J48 unpruned decision tree with selected attributes | 0.878 | 0.109 | 0.876 | 0.878 | 0.877 |
Table 5: Comparison of Naïve Bayes, PART rule induction and J48 decision tree models with selected attributes
Sample rules generated by J48 unpruned decision tree
The following rules were retrieved for prototype system development from a total of 344 rules generated by the J48 unpruned decision tree method.
Age <= 47
| Hypertension = N
| | Smoking = N
| | | Chronic obstructive pulmonary disease = N
| | | | Diabetes = N
| | | | | Systolic Blood Pressure <= 130
| | | | | | Age <= 25: Low (1055.48/42.56)
| | | | | | Age > 25
| | | | | | | Age <= 26
| | | | | | | | Diastolic Blood Pressure <= 75: Low (14.99)
| | | | | | | Age > 20
| | | | | | | | Systolic Blood Pressure <= 165
| | | | | | | | | Systolic Blood Pressure <= 135: Medium (2.01/0.01)
| | | Age > 31
| | | | Exercise = N
| | | | | Chronic obstructive pulmonary disease (COPD) = N
| | | | | | Gender = F: Low (2.02)
| Hypertension = Y
| | Systolic Blood Pressure <= 135
| | | Diastolic Blood Pressure <= 85
| | | | Smoking = N
| | | | | Exercise = N
| | | | | | Age <= 33: Low (22.23/0.06)
| | | | | | Blood pressure treatment = Y
| | | | | | | Gender = F
| | | | | | | | Systolic Blood Pressure <= 175
| | | | | | | | | Systolic Blood Pressure <= 150
| | | | | | | | | | Systolic Blood Pressure <= 140.11
| | | | | | | | | | | Diastolic Blood Pressure <= 90
| | | | | | | | | | | | Age <= 31: Medium (2.0)
| | | | | | | | | Age > 29
| | | | | | | | | | Systolic Blood Pressure <= 165
| | | | | | | | | | | Systolic Blood Pressure <= 140.11: High (4.0/2.0)
| | | Smoking = Y
| | | | Age <= 34
| | | | | Diastolic Blood Pressure > 90: High (2.0/1.0)
Age > 47
| Systolic Blood Pressure <= 140.11
| | Smoking = N
| | | Age <= 58
| | | | Diabetes = N
| | | | | Diastolic Blood Pressure <= 90
| | | | | | Chronic obstructive pulmonary disease (COPD) = N
| | | | | | | Systolic Blood Pressure <= 135
| | | | | | | | Age <= 50: Low (157.4/17.0)
| | | | Diabetes = Y
| | | | | Gender = F
| | | | | | Diastolic Blood Pressure <= 75: High (3.0/1.0)
| | | Age > 58
| | | | Gender = F
| | | | | Diastolic Blood Pressure <= 50: Low (10.03)
| | | | | Diastolic Blood Pressure > 50
| | | | | | Hypertension = N
| | | | | | | Diabetes = N
| | | | | | | | Systolic Blood Pressure <= 115
| | | | | | | | | Exercise = N
| | | | | | | | | | Diastolic Blood Pressure <= 85
| | | | | | | | | | | Diastolic Blood Pressure <= 65: Low (38.05/12.0)
Decision support system for risk level prediction for cardiovascular diseases
Using extracted rules/patterns obtained by data mining classifiers algorithm that produced the best results, namely unpruned J48 decision tree, a user interface is developed, and the screenshot is depicted in figure 4 below, which can be used as a decision support system for risk level prediction for cardiovascular diseases.
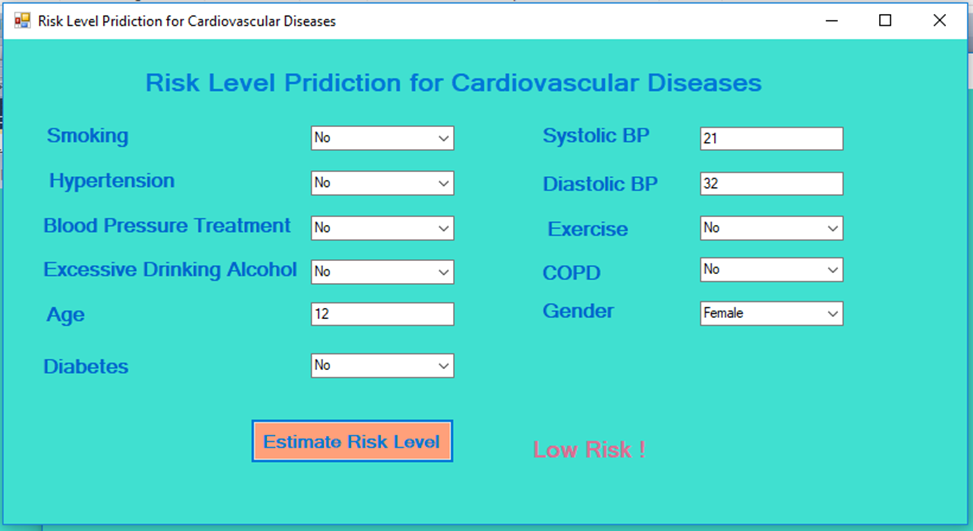
Figure 4: Decision support system for risk level prediction for cardiovascular diseases.
Conclusion
This work aimed to create a model and system by employing data mining techniques which can predict the risk of cardiovascular diseases. Precision, recall, and the F-measure were used to assess the model performances. The training and test data samples were randomly selected using the 10-fold cross-validation method. The J48 unpruned classifier based on specified variables was found to be the most successful model to assess the risk level of patients with cardiovascular diseases since it accurately categorized 3580 (89.4106%) instances with an F-Measure value of 0.877.
Recommendations
The model was developed using the attributes which the model selected as well as confirmed by the domain experts and finally used to develop the decision support system to predict the risk level of cardiovascular diseases can be used as decision support where there is a lack of specialists of cardiovascular diseases esp., in the primary hospitals in Ethiopia. However, the total number of instances used for this study was four thousand four (4004). It is obvious that as the number of datasets increases, the performance of the model increase. Therefore, in future works adding the number of datasets and trying to increase the accuracy of the developed model is recommended. In addition, for the usability of the model, developing a knowledge-based system for risk level prediction by using extract rules is another exciting work.
The authors would like to acknowledge Jimma University for providing the fund to carry out this research and Jimma Medical Center for giving us the data. The authors are also grateful for the data collectors.
Dear Editorial Team, Clinical Medical Reviews and Reports. My experience with the journal was highly positive. The peer-review process was rigorous, constructive, and completed in a timely manner. The reviewers provided valuable comments that helped improve the quality and clarity of our manuscript. The editorial office was professional, responsive, and supportive throughout all stages of the publication process. Communication was clear and efficient, and any questions were addressed promptly. Overall, I found the journal to maintain high scientific standards and an excellent publication workflow. I would be pleased to consider submitting future work to this journal. Best wishes from, Elena Popa.

It was my pleasure to submit my testimonial concerning the Reviewer Board of our Scientific Journal “Brain and Neurological Disorders”. The Reviewers focused on some modifications and their contribution was helpful. The ladies of our Editorial Office were also supported my efforts. It was my honor to have such a co-operation and I am looking forward for more collaboration.

Dear Grace Pierce, Editorial Coordinator of Journal of Clinical Research and Reports, Thank you for the speedy and efficient peer review process. I appreciate the fact that your peer reviewers do not take months to respond like with some other journals. I would also like to thank the editorial office for responding quickly to my questions. It is an excellent journal. I plan to submit more manuscripts in the future. Best wishes from, Robert W. McGee

Dear Grace Pierce, Editorial Coordinator of Journal of Clinical Research and Reports, Working with you and your team on our recent publication in JCRR has been a truly wonderful and enjoyable experience. The responses were prompt, and the reviewers were patient, constructive, and highly professional. One reviewer in particular gave me the feeling that a professor was carefully reading and commenting on my coursework, which was deeply touching. The entire process was straightforward and hassle‑free, with no tedious online forms to complete. I highly recommend this journal. Best wishes from, DR Aibing Rao, Head of R&D

I Appreciate the Opportunity to Share my Experience with the Journal of Clinical Research and Reports. The peer review process was timely and constructive, and the feedback provided helped improve the quality of our manuscript. The editorial office was professional, responsive, and supportive throughout the process, ensuring smooth communication and efficient handling of the submission. Overall, it was a positive experience collaborating with your team.

Dear Mercy Grace, Editorial Coordinator of Obstetrics Gynecology and Reproductive Sciences, We would like to express our gratitude for your help at all stages of publishing and editing the article. The editors of the magazine answer all the necessary questions and help at every stage. We will definitely continue to cooperate and publish other works in the Obstetrics Gynecology and Reproductive Sciences! Best wishes from, Alla Konstantinovna Politova,
