
Research Article | DOI: https://doi.org/10.31579/2637-8914/028
1University of Oslo, Institute of Health and Society, Box 1130 Blindern, 0318 Oslo, Norway.
*Corresponding Author: Arne T. Høstmark, MD, PhD, University of Oslo, Institute of Health and Society, Box 1130 Blindern, 0318 Oslo, Norway.
Citation: Arne Torbjørn Høstmark, (2020) Association between Relative Amounts of White Blood Cell Counts: a Case of Distribution Dependent Correlations. J. Nutrition and Food Processing, 3(2); DOI:10.31579/2637-8914/028
Copyright: © 2020 Arne Torbjørn Høstmark, This is an open-access article distributed under the terms of the Creative Commons Attribution License, which permits unrestricted use, distribution, and reproduction in any medium, provided the original author and source are credited.
Received: 27 July 2020 | Accepted: 10 August 2020 | Published: 17 August 2020
Keywords: white blood cells; segmented neutrophil leukocytes (N); lymphocytes (L); random numbers; man
We previously observed a positive association between relative amounts of particular body fatty acids, provided they had low-numbers relative to sum of the remaining ones. Additionally, theoretical considerations and computer experiments suggested that, with two high-number variables relative to one with much lower numbers, we should expect a negative relationship between relative amounts of the high-number variables. Moreover, the correlation outcomes with true values could be well reproduced using random numbers, provided that the numbers had the true ranges (distributions). This finding led to the concept of Distribution Dependent Correlations. Since counts of segmented neutrophil leukocytes (N) and lymphocytes (L) are normally much higher than sum of the remaining (R) white blood cells (WBC), it was suggested that %N might possibly be negatively associated with %L. In the present work, random numbers were sampled in lieu of reported WBC subgroup values, but using the measured mean ± SD values. The results demonstrate that relative amounts of random number “N” and “L” were indeed inversely related in both sexes: Spearman’s rho = -0.9, p <0.001, n = 200, as observed using within-person data, and between-person data as well. Furthermore, an alteration in distributions (variability) of the WBC subgroup changed the correlation outcome, as evaluated by scatterplots and correlation coefficients. Decreasing (increasing) values of %R improved (made poorer) the negative association between %N and %L. Thus, the observed negative association between %N and %L seems to be a case of Distribution Dependent Correlations. Hypothetically, by directing WBC subgroup counts to particular places on the scale, a powerful tool is available to govern the associations between relative amounts of WBC subgroups.
In diet trials we may raise the question of whether relative amounts of particular blood or tissue variables are positively or negatively associated. In this regard, we previously reported that relative amounts of e.g. particular body fatty acids can be positively associated as a consequence of their particular distributions (range), and named such associationsDistribution Dependent Correlations, DDC [1-9]. Thus, if variables Aand B have very low numbers and low ranges relative to C, then we might expect a positive %A vs. %B association [4]. It is not surprising that percentages may be correlated, if they are computed from the same sum. Indeed, in 1897, Pearson reported that there could be a spurious correlation between two indexes having the same denominator [10]. However, our previous analyses with random numbers show that significant correlations between percentages of the same sum are not always obtained. Additionally, and such correlations may be positive or negative depending on the distribution (range)of the variables. Furthermore, a particular feature of DDC seemed to be that an alteration in distributions of the variables would change the relationship between their relative amounts. Previously, we raised the question of whether evolution might possibly utilize DDC as a regulatory mechanism in physiology [1, 9]. Additionally, theoretical considerations suggested that, if S is the sum of 3 positive scale variables (S = A + B + C) and A (and B) have high-numbers relative to C, then we should expect a negative %A vs. %B association [3, 4]. Searching for such a condition in physiology, it occurred to us that counts of segmented neutrophil leukocytes (N) - and of lymphocytes (L) - are normally much higher than sum of the remaining (R) white blood cells (WBC). Therefore, in the present work we raise the question of whether %N and %L might be negatively associated, thereby representing a case of DDC. If so, the negative association should be influenced by an alteration in the ranges of WBC subgroups. The aim of the present work was accordingly to investigate this possibility, using published data [11] of WBC counts. It is, however, beyond the scope of this work to discuss the role of WBC in health and disease. We only mention that N are phagocytic cells that may destroy bacteria, whereas L may produce antibodies, kill malignant cells, and destroy virus - infected cells [12, 13].
Calculations and statistical analysis
In this work, we use previously published data [11] on white blood cell counts, i.e. of lymphocytes (L), segmented neutrophil leukocytes (N), monocytes (M), basophil leukocytes (B), and eosinophil leukocytes (E). Of the reported [11] total WBC count, N provided about 63%, L 30%, and M 7%. For each sex, the article presented between-person and within-person data. For example, in men (n = 409), the within-person counts ± SD (*103/µl) of N were (4.02 ± 0.92), of L 2.05 ± 0.32, and of M 0.57 ± 0.10. The article provided amount basophils and eosinophils as percent of the total WBC count, i.e. of 6.89 ± 1.05 (103 /µl). On the basis of these data, we calculated B and E counts (*103/µl) in men to be: 0.04 ± 0.02 and 0.20 ± 0.05, respectively.
Thus, with WBC there seems to be a situation with two high-number variables (L and N) and 3 (M, B, E) with much lower numbers. Thus, %N + %L + %M + %B + %E = 100, or %N = - %L + (100 -%R), where R = M + B + E. Since R is small compared with N and L, a crude simplification of the above equation could be: %N = -%L +100. This is the equation if N and L were the only WBC to consider. It follows that, if this equation were valid, we should expect a perfect inverse relationship between %N and %L. However, since R is far from zero we should not expect close to a straight-line scatterplot for the %N vs. %L association. Based upon the reported [11] mean (SD) values of N, L, M, B, and E, we computed the following distributions (ranges): N 1.37 – 6.75; L 1.02 – 2.75; R 0.48 – 1.18 (*103/µl). Using these ranges, we generated random numbers (n = 200) with uniform distribution. Additionally, random numbers with normal distribution were sampled (n =200), using the reported mean (SD) values. Next, we did computer experiments in which we applied the above equation %N = - %L + (100 -%R) to study how alterations in ranges might influence the association between the relative amounts of N and L. In the article referred to, between-person mean ± SD values in each sex included about 1200 subjects, and the within-person data more than 400 subjects. In the present computer experiments, however, a lower number (n = 200) was used to represent the “subjects”, in order not to over-estimate the correlation outcomes.
Based upon the random numbers that were generated, we computed sum (S) of the numbers representing the reported WBC subgroups (S = N + L + M + E + B). This S was used in the denominator when calculating relative amounts of “WBC subgroups”. For simplicity, below we omit question marks when using random numbers in lieu of the true (measured) values. Unfortunately, the measured values were not available. However, our previous works [1, 8] indicate that correlations between percentages of the same sum are caused by the particular distribution of the variables. Thus, the previous correlation outcomes obtained with true values were well reproduced using random numbers, provided that they were sampled with the true ranges. In the current context, percentage N was computed as: %N = (N/S)*100, and % L = (L/S)*100. We computed correlation coefficients (Spearman’s rho) to assess associations between the N and L percentages. Additionally scatterplots were made to illustrate associations between relative amounts of N and L. Finally, we did some computer analyses to investigate whether random number %E and %B might be positively associated, since E and B represent two low-number variables relative to N and L, and our previous studies indicated that this condition should give a positive correlation between relative amounts of the low-number variables [4].
Alteration of distributions (ranges).
As reported previously [1-5], with fatty acids the distribution per se seemed to be crucial for the positive correlation outcome between particular fatty acid percentages. If this conclusion is valid for the current analyses related to %N and %L, then we should expect to influence the negative correlation between %N and %L by changing the ranges of N, L, and R. We accordingly first generated normally distributed RANDOM numbers, based upon the reported WBC subgroup mean counts (± SD), and next, after experimentally altering SD values to achieve varying ranges of N, L, and R. We additionally utilized the reported mean ± SD values to find the physiological ranges, which were subsequently used to generate random numbers with uniform distribution. In separate experiments, these ranges were altered, to obtain uniformly distributed random numbers having ranges deviating from the reported ones.
Thus, by experimentally replacing true ranges with hypothetical ones in computer experiments, we aimed at further clarifying whether ranges of N, L, and R do govern the association between N and L percentages of S. For each analysis, we made several repeats with new sets of random numbers; the general outcome of the repeats was always the same, but the correlation coefficient (Spearman’s rho), and scatterplot, varied slightly. We accordingly present the results as correlation coefficients, scatterplots, and regression analyses. SPSS 25.0 was used for the analyses, and for making figures. The significance level was set at p<0.05. The experimental conditions are presented in more detail under “Results and Discussion”.
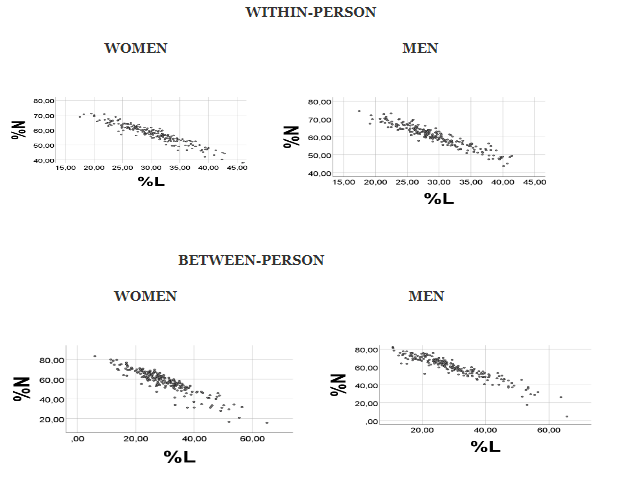
Will we obtain a negative %N vs. %L association, using random numbers in lieu of the measured values, provided that the numbers are generated with the true variability?
Above we reasoned that, since N and L are high-number variables relative to sum of the remaining white blood cells (R= M + E + B), then the equation %N = -%L + (100 -%R) should apply. With very low %R values, this equation would approach%N = -%L + 100, showing an inverse relationship between %N and %L. Our previous random number analyses [2-4] suggest that the negative association might prevail also with higher values of %R. The results shown in Figure 1 seem to support this suggestion: Relative amounts of random numbers (with normal distribution), however keeping the true ranges, gave a strong negative %N vs. %L correlation in each gender, irrespective of whether the random numbers were generated on the basis of the reported [11] within-person or the between-person measurements (Spearman’s rho being at least -0.9 in each of the conditions, p < 0.001, n = 200). This finding seems to be in line with the reasoning that relative amounts of N and L in human blood do represent a case of Distribution Dependent Correlations. However, to substantiate this suggestion, we need to show that alterations in distributions (ranges) of WBC subgroup counts will change the %N vs. %L correlation coefficient, as well as the scatterplot. But first we investigate the correlation outcome when using random numbers with uniform distribution and with the true ranges, to control for a factor which might possibly influence the results.
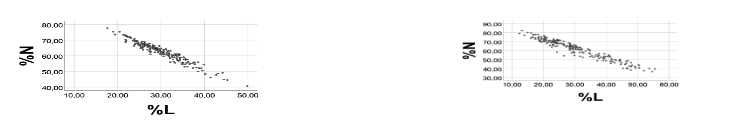
Will we obtain a negative %N vs. %L association when using random numbers with uniform distribution?
The results shown in Figure 1 refer to random numbers with normal distribution. As a control experiment, we additionally investigated the %N vs. %L correlation outcome using random numbers with uniform (“rectangular”) distribution, however generated with true ranges, i.e. based upon the reported within-person values in men. The ranges were; for N: 1.37 – 6.29; for L: 1.26 -2.74; for M: 0.24- 0.88; for E: 0.06 – 0.35; and for B: 0.00 - 0.09 (*103/µL). It turned out that the %N vs. %L scatterplots (Figure 2) were very similar, irrespective of whether the random numbers had normal or uniform distribution. It would appear, accordingly, that the shape of the random number histograms (not shown) did not have a major influence on the correlation results. With normal distribution of the random numbers (Figure 2, left), we found Spearman’s rho for %N vs. %L to be: -0.955, p <0.001, n = 200. Corresponding value when using uniformly distributed random numbers was: rho = -0.934, p <0.001, n =200.
Will we obtain a change in the %N vs. %L association when altering ranges of the variables?
An improved approximation of the above equation between relative amounts of the WBC subgroup counts would be: %N(p – q) = -[(%Nmax - %Nmin)/(%Lmax - %Lmin)] * %L(r – s) + (100 -%R(t – u)), where R = M + E + B, and subscript parentheses indicate ranges of the percentages. Thus, distribution per se (place on the scale/range/variability) of all types of WBC should influence the negative correlation between N and L percentages. Since M consists of about 0.5; E about 0.2; and B about 0.04 (*103/µl) of R [11], the order of potency for influencing the %N vs. %L correlation, among the “R-cells”, should be: M > E > B. The current %R values were far from zero, as indicated by quartiles of the computed (random number) %R distribution, being about 10, 12, and 15%, respectively (histogram not shown). Still, the strong negative %N vs. %L association prevailed, as shown in Figure 1.
From the above equation, we should expect an improved (poorer) %N vs. %L association (scatterplots) with decreasing (increasing) values of %R. To test this hypothesis, a computer experiment was carried out to examine how a hypothetical increase and decrease in %”R” would influence the %”N” vs. %”L” correlation, using random numbers. To better illustrate the point, in order to achieve decreased (increased) %R values, uniformly distributed random numbers with greatly varying hypothetical ranges were generated, i.e. variability of R was changed appreciably. The (random number) range of R, obtained from the reported [11] mean and SD values was 0.28 – 1.36 (*103/µL), giving Spearman’s rho = -0.898 for the %N vs. %L association. Quartiles of the %R histogram were 9.6, 11.9, and 15.7%, respectively.
First, the hypothetical R-range was narrowed to 0.1 – 0.2 (*103/µL), and next broadened to 0.2 – 3.0 (*103/µL, emphasizing that these ranges probably are far from what might be encountered in health and disease.
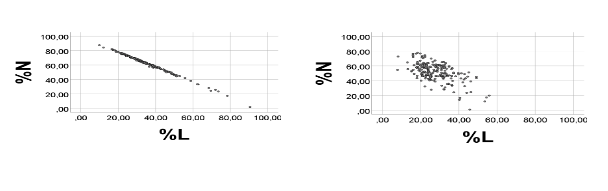
As shown in Figure 3, the negative correlation between %N and %L improved greatly in response to narrowing the random number R range appreciably, i.e. to 0.1 - 0.2 (*103/µL); rho for %N vs. %L: = -0.996, p<0.001, n = 200. In this example, quartiles of the %R distribution were low, i.e. 1.9, 2.3, and 2.9%, respectively, showing that the %R distribution had moved towards lower values. Equation of the regression line was %N = -1.05 (0.01)*%L + 99.2 (0.2), i.e. the slope was close to -1, as expected. Furthermore, the extrapolated regression line seemed to cross axes at about 100% (Figure 3, left panel).
As predicted, the scatterplot of the %N vs. %L association, and correlation coefficient, became appreciably poorer in response to broadening the R range, Figure 3, right panel); rho = -0.504 (p<0.001), n = 200. Quartiles of the %R distribution after broadening the R range had changed to 10.6, 20.5, and 27.4%, respectively, showing that the %R distribution had moved towards higher values. Equation of the regression line had changed to: %N = -0.8 (0.1)*%L + 74.8 (2.4).
In additional computer experiments where ranges of R were altered in many ways, the outcomes were as predicted above: narrowing (broadening) of the R range (either directly by altering the R range, or indirectly by changing the N and/or L ranges) improved (made poorer) the negative %N vs. %L association (not shown). The experiments seem to support the idea that the negative association between N and L percentages of total WBC is a case of Distribution Dependent Correlations.
Obviously, it is not justified to relate the present findings to health and disease in man, since random numbers were used to replace the true values, and effects of large alterations in the ranges were studied. Nevertheless, the results demonstrate the powerful influence of changing ranges (variability) upon the negative association between percentages of the same sum, raising the question of whether evolution might possibly utilize this mathematical principle to obtain an inverse %N vs. %L relationship. In other words, a regulation of where WBC subgroups are placed on the scale will determine whether their relative amounts must be positively or negatively associated, or not associated at all. Interestingly, the N/L ratio has been used as a risk factor [14-15]. It is, however, beyond the scope of this work to discuss physiological implications of the DDC hypothesis, and mechanisms involved to determine ranges of WBC subgroups. In general, regulation of enzymes catalyzing synthesis or degradation of particular (blood) cells, e.g. allosteric regulation of enzyme activities, and/or interconversion between phosphorylated and dephosphorylated forms of key enzymes, could be involved.
The N/L ratio.
The N/L ratio, which has been used as a risk factor [14 -15], is equal to the ratio between N and L percentages of WBC, since %N and %L in each subject are computed from the total WBC count. Thus, the N and L percentages of total WBC count allow calculation of the N/L ratio, as well as evaluating whether the relative amounts of N and L correlate. However, the N/L ratio per se does not provide sufficient information to evaluate how N and L percentages of total white blood cell count are correlated. However, from the above equations of the regression lines for %N vs. %L (based upon random numbers), it is seen that the slopes are not far from -1, which would be the slope when computing %N and %L from the sum of N and L counts only, i.e. %N = -%L +100. In this case, rho for %N vs. %L should be equal to -1.000, irrespective of the N and L ranges, and the extrapolated regression line should theoretically cross axes at exactly 100%. Conceivably, there was no significant correlation between absolute counts of N and L (rho = -0.059, p=0.407, n = 200), Figure 4.

Is there a positive correlation between relative amounts of low-number WBC subgroups?
As discussed above, with two variables having low-numbers and low variability relative to a third variable, we might expect percentages of the two former ones to be positively associated [4]. This situation seems to be encountered with basophils (B) and eosinophils (E) relative to the remaining white blood cells (R = N + L + M). Thus, the equation %B = -%E + (100 - %R) would seem to apply. If having very high values of %R, the equation should approach %B = [(%Bmax - %Bmin)/(%Emax - %Emin)]* %E, showing a positive association; the slope being determined by ranges of the B and E percentages. It is emphasized that the idea of doing the below computer experiments was solely based upon a mathematical consideration, since values of B and E are low (0.6% of WBC for B; 2-3% for E), relative to N (60%) and L (30%). Using random numbers, generated on the basis of the reported mean (SD) values [11], there was no significant correlation between %B and %E (results not shown). However, using random numbers in lieu of the true values, and SD = 10 % of the mean value for B and E, then there was a significant positive %B vs. %E association (rho = 0.785, p <0.001, n = 200). As expected, the positive correlation improved (became poorer) when further lowering (increasing) variabilities of B and E, as observed by scatterplots and correlation coefficients (results not shown). The results suggest that the association between relative amounts of E and B may be sensitive to alterations in their distributions (including place on the scale/range/variability). It is accordingly tempting to speculate that, provided that SD had been about 10% of then mean value, then we might possibly wonder whether a decrease or an increase in %E was accompanied by a corresponding increase in %B. From the present results one might also wonder to what extent –in general - the measured range does reflect the true physiological, within-subject variability, and to what extent the true biological variability might be masked by external errors, for example related to sampling, storage, and measurement. Additionally, since the N/L ratio has been implicated in the Covid-19 infection [15], it might be of interest to investigate whether relative amounts of lymphocyte subgroups might be positively correlated, e.g. NK cells, and the cells making antibodies. It is, however, emphasized that the present work is solely based upon mathematical considerations. Further studies are needed to evaluate possible implications of the results in health and disease.
Since this work was confined to studying the association between relative amounts of N and L, based upon reported data from human blood, control studied should be performed. Furthermore, more studies are required to evaluate to what extent the suggested phenomenon of Distribution dependent correlations/-regulation is valid for WBC subgroups in general. Additionally, studies should be performed in other species to assess generalizability of the results. Since the current data suggest that Distribution Dependent Correlations (DDC) seem to apply with human WBC, future studies should be done to investigate the possible modifying influence of environment and lifestyle, including diet and physical activity. Additionally, studies should be carried out to explore how DDC of WBC subgroups might be influenced in various disease conditions.
The results of this work suggest that relative amounts of segmented neutrophil leukocytes and lymphocytes in human blood are negatively associated. This inverse relationship seems to be a case of Distribution Dependent Correlations, which might be a novel regulatory principle in physiology.
Variability: the width or spread of a distribution, measured e.g. by the range and standard deviation.
Range: showing the highest and lowest values.
Distribution: graph showing the frequency distribution of a scale variable within a particular range. In this article, we also use distribution when referring to a particular range, a – b, on the scale.
Uniform distribution: every value within the range is equally likely. In this article, we may write “Distribution was from a to b”, or “Distributions of A, B, and C were a – b, c – d, and e - f, respectively”.
“Low–number variables” have very low numbers relative to “high-number variables”.
WBC = White Blood Cells; N = segmented neutrophil leukocytes; L = Lymphocytes; M = Monocytes; E = Eosinophil leukocytes; B = Basophil leukocytes
Dear Editorial Team, Clinical Medical Reviews and Reports. My experience with the journal was highly positive. The peer-review process was rigorous, constructive, and completed in a timely manner. The reviewers provided valuable comments that helped improve the quality and clarity of our manuscript. The editorial office was professional, responsive, and supportive throughout all stages of the publication process. Communication was clear and efficient, and any questions were addressed promptly. Overall, I found the journal to maintain high scientific standards and an excellent publication workflow. I would be pleased to consider submitting future work to this journal. Best wishes from, Elena Popa.

It was my pleasure to submit my testimonial concerning the Reviewer Board of our Scientific Journal “Brain and Neurological Disorders”. The Reviewers focused on some modifications and their contribution was helpful. The ladies of our Editorial Office were also supported my efforts. It was my honor to have such a co-operation and I am looking forward for more collaboration.

Dear Grace Pierce, Editorial Coordinator of Journal of Clinical Research and Reports, Thank you for the speedy and efficient peer review process. I appreciate the fact that your peer reviewers do not take months to respond like with some other journals. I would also like to thank the editorial office for responding quickly to my questions. It is an excellent journal. I plan to submit more manuscripts in the future. Best wishes from, Robert W. McGee

Dear Grace Pierce, Editorial Coordinator of Journal of Clinical Research and Reports, Working with you and your team on our recent publication in JCRR has been a truly wonderful and enjoyable experience. The responses were prompt, and the reviewers were patient, constructive, and highly professional. One reviewer in particular gave me the feeling that a professor was carefully reading and commenting on my coursework, which was deeply touching. The entire process was straightforward and hassle‑free, with no tedious online forms to complete. I highly recommend this journal. Best wishes from, DR Aibing Rao, Head of R&D

I Appreciate the Opportunity to Share my Experience with the Journal of Clinical Research and Reports. The peer review process was timely and constructive, and the feedback provided helped improve the quality of our manuscript. The editorial office was professional, responsive, and supportive throughout the process, ensuring smooth communication and efficient handling of the submission. Overall, it was a positive experience collaborating with your team.

Dear Mercy Grace, Editorial Coordinator of Obstetrics Gynecology and Reproductive Sciences, We would like to express our gratitude for your help at all stages of publishing and editing the article. The editors of the magazine answer all the necessary questions and help at every stage. We will definitely continue to cooperate and publish other works in the Obstetrics Gynecology and Reproductive Sciences! Best wishes from, Alla Konstantinovna Politova,
