
Review Article | DOI: https://doi.org/10.31579/2637-8914/001
Department of Nutrition, Linkoping University, Sweden.
*Corresponding Author: Jan-Olof Drangert, Department of Nutrition, Linkoping University, Sweden.
Citation: Jan-Olof Drangert, 2018. A Systems Approach to Secure Food, Good Health and a Healthy Environment. J Nutrition and food Processing. 1(1); DOI: 10.31579/2637-8914/001
Copyright: © 2018 Jan-Olof Drangert. This is an open-access article distributed under the terms of the Creative Commons Attribution License, which permits unrestricted use, distribution, and reproduction in any medium, provided the original author and source are credited.
Received: 22 December 2017 | Accepted: 06 January 2018 | Published: 05 February 2018
Keywords: pathogenic organisms; food security; environmental pollution; vulnerability; biodegradable body care products; biogas production
Human societies have always been concerned about feeding its population. Recently, the issue has been raised whether there is enough phosphate resources to feed the growing world population (Cordell et al., 2009; Malingreu et al., 2012). The plant-nutrient phosphorus (P) has no substitute and mined P is available in only a handful of countries. Also, manufactured nitrogen (N) in fertilisers requires a large input of fossil energy i.e. natural gas. Reduced wastage of plant nutrients and recovery and recycling could substantially improve the availability of P and N.
Human societies have always been concerned about feeding its population. Recently, the issue has been raised whether there is enough phosphate resources to feed the growing world population (Cordell et al., 2009; Malingreu et al., 2012). The plant-nutrient phosphorus (P) has no substitute and mined P is available in only a handful of countries. Also, manufactured nitrogen (N) in fertilisers requires a large input of fossil energy i.e. natural gas. Reduced wastage of plant nutrients and recovery and recycling could substantially improve the availability of P and N.
Today, food security and healthy food is gaining importance to maintain public health. A gradual shift of focus is taking place: from a focus on pathogens and malnutrition to environmental pollution and improved nourishment (Lopez et al., 2006).
This article applies a systems approach to promote reduced evironmental pollution and enhanced access to plant nutrients to produce enough food. The understanding is that this will improve public health by making people less vulnerable to e.g. the effects of diarrhoeal incidences and of environmental degradation.
Two challenges for any emerging recycling society:
The global population will grow to more than 10 billion at the end of this century, of which 85% are expected to live in urban areas (OECD, 2013). Urban areas become hot spots of consumption of products and disposal of waste. This geographical concentration facilitates recovery and recycling of waste, not least the plant nutrients in waste to be used in agriculture.
Two major challenges face a recycling society: how to ascertain that urban waste is of good enough quality for use in agriculture, and that urban populations are not unduly exposed to harmful chemical substances and pathogens. In order to transform present-day chemical society to recycling society, it will be necessary to complement conventional measures to avoid pathogens with a reduction of harmful chemical substances in order to secure public and environmental health and food security.
Pathogenic organisms (viruses, bacteria, helminths and protozoa) and chemical substances (heavy metals, persistent organic compounds, nutrients, etc.) affect humans and the environment differently. (Figure 1) summarizes and compares the effects that pathogens and chemical substances pose to human health and the environment. It follows WHO’s risk assessment of pathogens which is based on numbers or concentration of each harmful item, exposure, dose-response, vulnerability, and barriers (WHO, 2006).
Chemical substances are present in nature, but most harmful substances that humans are exposed to are man-made. Altogether there are over 140,000 substances in our chemical society (Hahnkamper-Vandenbulcke, 2016), out of which some 30,000 are used in an ordinary household. Industries introduce hundreds of new substances in products every year. The content and potential health effects of new (and old) compounds are likely to be known by industry and protected by a patent, while the users rarely know the harmful effects (EU, 2011; ECHA, 2007).
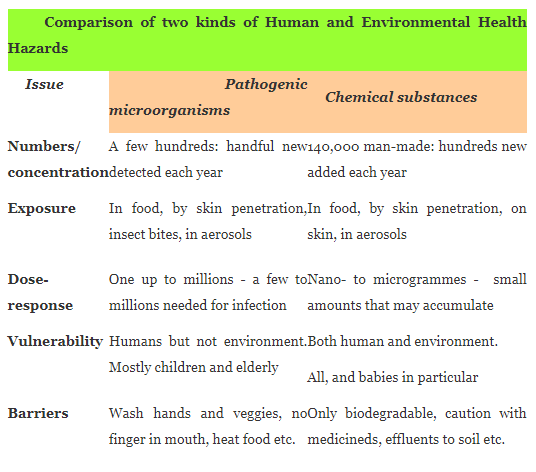
Microorganisms are present in nature and a handful of new strains or species are detected every year. Not all pathogenic organisms can multiply, and they may be preyed on or die off. Human exposure to pathogens is mainly through ingested food and water, skin penetration (snails), bites (mosquitoes), and inhalation of aerosols (viruses). Exposure therefore varies due to living conditions. The infectious dose varies from a few Ascari eggs to millions of enteric coliform bacteria. Also, vulnerability varies greatly between individuals and the effect is often seen within a short period of time (Bartram and Cairncross, 2010).
Chemical substances are usually present in small amounts. Some are degradable while others may accumulate in the human body and eventually reach harmful concentrations. Humans are exposed to chemical substances in much the same way as pathogens. A growing concern is about the effects of breathing particulate matter and exhaust fumes (OECD, 2012). Some heavy metals (cadmium, lead etc.), persistent organic matter such as PCBs, and pesticides affect the human body functions. Symptoms are often diffuse and difficult to diagnose since the effects are only felt after extended exposure. Therefore, knowledge about dose-response and vulnerability is less for chemical substances compared to pathogens.
Protection against health hazards can be described as barriers. Barriers against pathogens include simple measures such as washing hands and vegetables before eating, boiling water and heating food, sleep under mosquito nets, and containing excreta. Barriers against chemical hazards include promoting toxin-free products, being restrictive with medicines, avoiding breathing polluted air, washing new clothes before wearing them, etc (EC, 2013). However, most barriers against chemicals are long-term remedies which involve protecting both humans and the environment, such as only using biodegradable body care products and detergents, collecting and destroying expired medicine and left-over hazardous chemicals, and disposing of wastewater on soil rather than in water bodies.
The barriers for pathogens are largely controlled by the individual while barriers against chemical compounds, on the other hand, require collective action such as banning certain substances and introducing safe products to protect both our health and the environment. No one is against getting rid of pathogens, while restricting chemical substances may arouse strong resistance from some stakeholders. Therefore, it may be more difficult to put up barriers for chemical substances.
Potential to recover P in urban waste flows and safely use it in food production:
All urban communities try to organise the resource flows in a way that is economical and safe. In the last decade, a rethink has emerged where the two challenges to secure safe use of urban waste in agriculture and not exposing people to harmful chemical substances and pathogens, are addressed simultanteously. The novel strategy to manage resources flows - named the solid waste hierarchy - comprises actions beginning where waste originates, rather than where it ends up. Previous main focus on “end-of-pipe” treatment is thus avoided, and initial attention goes to controlling the content of consumer products. A systems-based and life-cycle thinking approach is applied here to safely manage nutrient-rich urban waste flows.
In the following, an extended waste hierarchy is introduced and applied to the handling of both solid and liquid nutrient-rich wastes including human excreta (EC, 2012; Dragnet et al., 2018). Step 1 is crucial to safe recovery and recycling of nutrients. Perhaps the most important measures are to not mixing various flows and to treat each flow separately. This idea is akin to the present methods not mixing hospital waste with household waste, and not mixing communal sewage with industrial wastewater or runoff water.
The five steps of the “extended waste hierarchy” applies to both solid and liquid waste:
Step 1. Reduce (a) waste generation, and (b) harmful contents in products and flows;
Step 2. Reuse the waste more or less as it is;
Step 3. Recycle the waste as input to new products (including biogas production);
Step 4. Incinerate to extract the energy content in the remaining waste;
Step 5. Safely landfill residues remaining after exhausting the previous steps.
The main sources of nutrients in urban waste are found in excreta, wastewater and solid organic waste (Johnson et al., 2012). Human excreta contains some 80 % and 60 % of the total amounts of nitrogen (N) and phosphorus (P) respectively leaving a European household (Hailstorm et al., 2007) – making excreta a critical issue item for overall urban nutrient recovery. For instance, the annual total content of N, P, and potassium (K) in all toilet water in Sweden amounts to 20, 50 and 55 % of the annually sold mineral fertiliser of N, P and K respectively in the country (Johnson et al., 2012) . Such high figures are expected, since the human body essentially uses the energy in eaten food while the nutrients are excreted (Dragert, 1998).
EU data regarding flows of P-rich wastes is steadily improving (van Dijk et al., 2016) and the end-use of mined P is changing substantially over time (Senthilkumar et al., 2012; Schmid-Neset et al., 2010). van Dijk et al. provide P flow and sink data for the EU:s 27 Member States. Their primary data from 2005 shows that mined P ends up in: fertilisers (78%), feed additives (14%), food additives (2%), and detergents (6%). Figure 2 shows the potential to save and recover P from these sources by applying Steps 1 – 3. The calculated values rely on various data, assumptions and estimates given in the following (Drangert et al., 2018).
Step 1: Recently, the EU banned the use of P in detergents, and therefore the 6% of the mined P can be saved and left in the ground. Drangert et al. (2018) suggest that the use of food and feed additives is reduced from a combined 16% to 2%, assuming there remains a valid need for some additives (Step 1a). Hence the other 14 percent can be left in the ground. According to Gustavsson et al. (2011) one-third of food is not eaten, and the assumption here is that it is possible to reduce food waste in the EU from a current 33% to 20% e.g. by buying less and eating more of the food that is bought and prepared. In this way, approximately 10 % ((0.33- 0.2) of 78%) of the initial input of mined P for making fertilisers is saved and can be left in the ground.
The lowered wastage of food, in turn, reduces the need for P in food production from 78% to 68%.In summary, the measures above could reduce mining of P by 30% (6 +14 +10), and the saved P in Step 1 can substitute 44 % (30/(78-10)) of the P needed for today’s level of eaten food (and less food waste). Alternatively, this P could be used for increased food production, or be left in the ground to extend the lifetime of phosphate mines.
In addition, a change towards more vegetarian diets could save substantial amounts of mined P, but is not proposed here because such change is deemed difficult to achieve (Foresight, 2011). However, arresting the ongoing increased consumption of meat and milk products may be within reach.
Step 2: All eaten food is subsequently excreted, and 33% of the excreted P is in the faeces and 67% in the urine (Drangert, 1998). A well-designed city infrastructure can realistically recover 90% of the P in urine for direct reuse. This recovered amount required 31% of currently mined P. In addition, the author suggests that 30% of the food waste remaining after Step 1 (required 5% of the total P) is recovered and reused directly in Step 2 e.g. as feed for animals.
Steps 3: The P in faeces or blackwater can - after treatment - be recycled in Step 3. With a well-designed infrastructure an estimated 90% of the P could be recovered. Furthermore, 70% of the food waste remaining after Step 2 could be recycled in Step 3 (required 8% of the currently mined P).
In this scenario, the same amount of food is eaten, diets remain the same, and are not affected by measures in Steps 1, 2 and 3. However, the amount of mined P that can be replaced by P recovered in Steps 2 and 3 depends on the P-efficiency or rate of losses from mine to plate. Such losses are country specific in a wide sense, and related to the kind of crop, soil, farming method, animal husbandry, transportation, storage, handling, food industry, etc. van Dijk et al. (2016) estimated that for each 1 kg of P output in food required an input of 4 - 6 kg of mined P. In other words, the P-losses from mine to plate are in the range of 75 – 85%. These differences in losses are captured in Figure 2 and in most countries the rate is likely to be in the range indicated by the dashed box.

The measures in Steps 1-3 have a major impact on the need to mine P irrespective of what assumptions are made about recovery rates. The smaller the losses are from mine to plate, the more can be recovered and replace mined P. Figure 2 also shows that measures in Step 1 have the greatest impact and are essentially independent of P-losses from mine to table - while providing the same amount of eaten food. Figure 2 shows that if, for example, the P-loss is 60% from mine to plate, then 68% of the currently mined P can be substituted and only 32 % is needed for the required food production. The rest of the mined P (68%) can be left in the ground for future needs. If the P-loss is 80 % instead, still only about 43 % of present-day mining is required.
This saving occurs each year. Therefore, the food production is secured since easily available P in mines will last two to three times longer and the transgression of the planetary P resource boundary is delayed by several hundreds of years. This is a major reason for the European Union to engage in recovery of nutrient resources and become a recycling society.
Incinerating all organic waste (Step 4) instead of the above measures in Steps 2 and 3 could also save mined P. Zhang et al. (2002) found that only 29 – 46 % of the total P in ashes from combustion was in plant available form. This indicates that incineration will save less P than reuse and recycling, and lead to a permanent loss of organic material together with all macronutrient other than P and K.
Flows of plant nutrients through urban areas
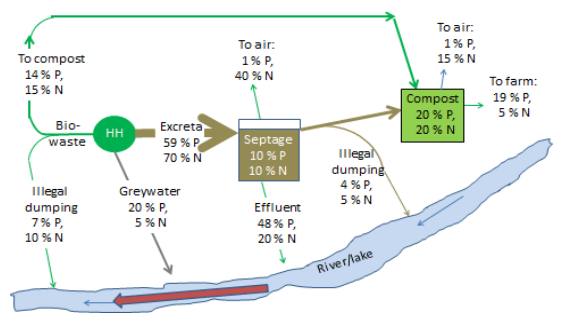
A conventional urban flow of P and N is illustrated in Figure 3, where assumptions for P are similar to the ones in Figure 2. Commonly, the nutrient-rich excreta is flushed to a septic tank for partial treatment. Ideally, settled sludge is cleaned out and brought to a compost facility but, due to infrequent emptying, much of the nutrients remain in the effluent. Illegal dumping is also commonplace in developing cities. In this example, 19 % of P and 5% of N in co-composted sludge and solid organic waste can be made available for use in agriculture, while most of the N and P is lost to rivers, landfills and to the air. The urban loss rate of 81% for P does not include losses from mining and agriculture, and therefore the recovered P can only replace a small part of the total input of P in food production as indicated by van Dijk et al. (2016).
A modified sanitation system in line with Steps 2 and 3 in the extended waste hierarchy can considerably improve the capacity to recover and recycle nutrients. Figure 4 presents a hypothetical scenario for a typical city in the developing world that has taken four measures: installed urine-diverting toilets, treatment of greywater, improved collection of biowaste, and bringing the recovered nutrients to agricultural use.
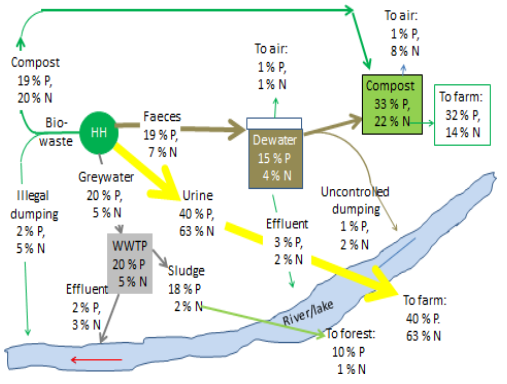
The separated and stored urine is a well-balanced and the least polluted fertiliser available on the market and is safely applied on agricultural soil (WHO, 2006; Jönsson et al., 2004). The nutrient loss from well-managed urine storage is small, even for nitrogen (Senecal and Vinnerås, 2017). Likewise, the composted faecal matter is likely to be of good nutrient quality and, in addition, it provides valuable organic matter to the soil. The P- and N-deficient greywater and sludge contains harmful chemical substances that may accumulate in soil (EC, 2013). Therefore, this sludge is suggested only to be applied to fertilise trees.
Residents segregate their household solid organic waste, and a solid-waste-handling company composts it, and thereby reduces previous illegal dumping. Such measures have the potential to reduce the losses of the P originating from households from 81% to 18%, while N losses are reduced from 95 % to 22 %. Half of the P and twothirds of the N disposed of by households can be gainfully returned to agricultural use. The recovered N and P can substitute mined P and manufatured N in fertilisers to an extent that is steared by the loss rate from mine to plate. As shown in Figure 2, measures in Step 1 may further reduce the need for P substantially. Accompanying the reduction in wastage of nutrients is a secured food production, enhanced sanitary conditions, and cleaner water bodies.
The extended waste hierarchy can guide measures to improve food production, provide almost limitless nutrients and organic soil amendments and reduce import of chemical fertilisers, reduce harmful chemical substances in the food chain, and enhance public and environmental health.
An improved food intake will make people less vulnerable to e.g. diarrhoel diseases. However, the intake of nutritious food is secured, only if the distribution is fair for all inhabitants.
Dear Editorial Team, Clinical Medical Reviews and Reports. My experience with the journal was highly positive. The peer-review process was rigorous, constructive, and completed in a timely manner. The reviewers provided valuable comments that helped improve the quality and clarity of our manuscript. The editorial office was professional, responsive, and supportive throughout all stages of the publication process. Communication was clear and efficient, and any questions were addressed promptly. Overall, I found the journal to maintain high scientific standards and an excellent publication workflow. I would be pleased to consider submitting future work to this journal. Best wishes from, Elena Popa.

It was my pleasure to submit my testimonial concerning the Reviewer Board of our Scientific Journal “Brain and Neurological Disorders”. The Reviewers focused on some modifications and their contribution was helpful. The ladies of our Editorial Office were also supported my efforts. It was my honor to have such a co-operation and I am looking forward for more collaboration.

Dear Grace Pierce, Editorial Coordinator of Journal of Clinical Research and Reports, Thank you for the speedy and efficient peer review process. I appreciate the fact that your peer reviewers do not take months to respond like with some other journals. I would also like to thank the editorial office for responding quickly to my questions. It is an excellent journal. I plan to submit more manuscripts in the future. Best wishes from, Robert W. McGee

Dear Grace Pierce, Editorial Coordinator of Journal of Clinical Research and Reports, Working with you and your team on our recent publication in JCRR has been a truly wonderful and enjoyable experience. The responses were prompt, and the reviewers were patient, constructive, and highly professional. One reviewer in particular gave me the feeling that a professor was carefully reading and commenting on my coursework, which was deeply touching. The entire process was straightforward and hassle‑free, with no tedious online forms to complete. I highly recommend this journal. Best wishes from, DR Aibing Rao, Head of R&D

I Appreciate the Opportunity to Share my Experience with the Journal of Clinical Research and Reports. The peer review process was timely and constructive, and the feedback provided helped improve the quality of our manuscript. The editorial office was professional, responsive, and supportive throughout the process, ensuring smooth communication and efficient handling of the submission. Overall, it was a positive experience collaborating with your team.

Dear Mercy Grace, Editorial Coordinator of Obstetrics Gynecology and Reproductive Sciences, We would like to express our gratitude for your help at all stages of publishing and editing the article. The editors of the magazine answer all the necessary questions and help at every stage. We will definitely continue to cooperate and publish other works in the Obstetrics Gynecology and Reproductive Sciences! Best wishes from, Alla Konstantinovna Politova,
