
research article | DOI: https://doi.org/10.31579/2688-7517/060
1 Master in Management. Professor of Statistics. School of Nutrition and Dietetics. Faculty of Medicine. Central University of Venezuela.
2 Doctora en Nutrición. Profesora Titular. Directora del Postgrado de Planificación Alimentaria y Nutricional. Escuela de Nutrición y Dietética. Facultad de Medicina. Universidad Central de Venezuela.
*Corresponding Author: Mary Zulay Moya-Sifontes, Doctoral in Nutrition. Professor Titular.
Citation: Gerardo J. Bauce, Mary Z. M., Sifontes, (2023), The Weight-Waist Circumference index (WWCI) as an Indicator of Cardiovascular Risk in Adolescents, J. Addiction Research and Adolescent Behaviour, 6(1) DOI:10.31579/2688-7517/060
Copyright: © 2023, Mary Zulay Moya-Sifontes. This is an open-access article distributed under the terms of The Creative Commons Attribution License, which permits unrestricted use, distribution, and reproduction in any medium, provided the original author and source are credited.
Received: 23 January 2023 | Accepted: 10 February 2023 | Published: 20 February 2023
Keywords: adolescents; sensitivity; specificity; youden index
The purpose of the study is to analyze the behavior of the Weight-Waist Circumference Index (IPCC) as an indicator to evaluate overweight and obesity in adolescents.
Materials and Methods: This is a descriptive, cross-sectional, prospective and correlational study, based on a sample of 708 adolescents, aged between 10 and 19 years, 357 (50.4%) male and 351 (49.6%) female. The variables sex, age, weight, height, BMI, WC, ICT and IPCC are included.
Results: the means by sex are similar for the variables age, weight, height BMI, WC, ICT and IPCC; the classification, according to the BMI and IPCC indicators by sex, indicates similar percentages in the Normal category in the male sex, while in the female sex it is higher for the IPCC indicator; in the category Slightly higher overweight for BMI and higher in females; in the category Obesity in the male sex is higher for the IPCC and in the female sex they are similar. The IPCC comes from a Normal distribution, the ROC curve reveals the high sensitivity and specificity of this estimator, and the Youden index reveals that the IPCC can be used as a diagnostic test.
Conclusion: the indicator Weight-Waist Circumference Index (IPCC) is useful to evaluate overweight and obesity in adolescents, given its high sensitivity and high specificity.
The World Health Organization defines adolescence as the period of growth that occurs after childhood and before adulthood, between the ages of 10 and 19. Regardless of the difficulty in establishing an exact age range, the adaptive, functional and decisive value of this stage is important [1].
It should be borne in mind that the adolescent feels child and adult at the same time, although we must bear in mind that it is neither one thing nor the other; Since it is in permanent transition: go from being a child and depending on the adult world for everything, to being young and begin to be done in which many hormonal and physiological changes occur in the adolescent's organism, it is necessary to evaluate their nutritional status. To assess the nutritional status of adolescents, the World Health Organization (WHO) has used the Body Mass Index (BMI), obtained using the Quetelet formula, to assess overweight and obesity [2]; but it should be noted that some authors such as Moreno González (2010) [3], state that BMI does not provide information about the distribution of body fat.
Bauce et al [4,5,6] have published articles in which they have used the indicator Weight-Waist Circumference Index, defined as the relationship between weight and waist circumference; that is, which relates a measure of body mass to a measure of abdominal fat.
On the other hand, Bauce et al 7 have conducted a study in which they have used this indicator and obtained average differentiated by sex, in university students. They have also published an article where they propose the use of this indicator as a complement to BMI to assess overweight and obesity.
In addition, according to UNICEF, in times of pandemic due to covid-19, it is estimated that some 370 million children in the world have lost access to essential meals since the closure of schools; and if no action is taken, the prevalence of child wasting can increase to 14percentage, equivalent to 6 or 7 million children with this condition [8].
In Venezuela, the situation of overweight and obesity in children and adolescents, according to a study conducted by the Comprehensive Treatment Center for Obesity (CitoGroupVe), reveals that the obesity rate fell by a third between 2010 and 2017 motivated by the economic difficulties of recent years; This decrease in the obesity rate from 2011 to the present, went from 24percentage to 11percentage, while that of overweight went from 30percentage to 25percentage, and that of morbid obesity went from 1.74percentage to 0.6percentage, although it does not report on the group that includes children and adolescents [9].
Similarly, a study by Sun Guo et al, found that there is a high possibility that children with a high percentile of BMI for their age, in the CDC tables, have a high risk of overweight or obesity at age 35, and the risk increases with age [10].
In view of the above, it is useful to consider the possibility of incorporating another indicator, as a complement to BMI, to evaluate overweight and obesity in adolescents.
Descriptive, cross-sectional, prospective and correlational study, based on a sample of 708 adolescents, aged between 10 and 19 years, 357 (50.4percentage) male and 351 (49.6percentage) female. The variables sex, age, weight, height, BMI, WC, WSI and WWCI are included, with the purpose of describing the study group and specifically for the WWCI to obtain correlations with the other variables, assume their normal behavior and analyze their behavior to be considered as a complementary indicator of Body Mass Index, when evaluating overweight and obesity. The adolescents or their representatives were informed in a timely manner about the objectives of the research, their informed consent was requested, in accordance with the requirements specified in the rules established in the Declaration of Helsinki [11].
BMI was obtained using the Quetelet formula [12]: BMI=W(kg)/S(m)2
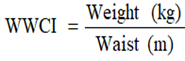
The IPCC is an indicator that has the particularity of taking into consideration, both the body mass expressed in kilograms, and the distribution of abdominal fat, expressed in centimeters and is obtained by the following formula [6]:
For each of the variables, the following references were taken into account:
BMI according to the tables of values proposed by the WHO [13]: BMILessthan-3SD (Extreme thinness): -3SDLessthanBMILessthan-2SD (Thinness); -2SDLessthanBMILessthan+1SD (Normal); +1SD Less than BMI Lessthan+2SD (Overweight); BMI Greater than+2SD (Obesity). And the values suggested by the Center for Disease Control and Prevalence (CDC) [14]: BMI Less than p5 (Low weight); P5LessthanBMILessthanP85 (Healthy Weight); P85LessthanBMILessthanP95 (Overweight) and BMI Greater than or Equal to P85 (Obesity)
For the WWCI according to the values proposed by Bauce [5]: the criterion corresponding to the percentiles suggested by the WHO for BMI was taken into account, considering that it is what fits best when classifying this indicator, and making a much more accurate comparison with relative values of the two indicators.
For waist circumference, the values obtained by Mederico et al [15] were considered as a reference, that is, 66 cm for females and 68 cm for males.
Descriptive measures such as means, standard deviation, percentages were obtained; correlations, measures of association such as Chi-square; Normality contrast for the IPCC, comparison of averages by hypothesis testing for mean and ratio. Logistic Regression was also applied to obtain the ROC Curve, which is built based on the union of different cut-off points, corresponding to the y axis and the sensitivity and the X axis to (1-specificity) of each of them. Both axes include values between 0 and 1 (0percentage to 100percentage) together with the Youden index suggested by William J. Youden in 1950, as a way of summarizing the performance of a diagnostic test; its value can be from -1 to 1, a value of 1 indicates that there are no false positives or false negatives, in order to evaluate the IPCC as a diagnostic test [16-18].
Table 1 presents the descriptive measures of the variables, in order to have a description of the group studied. Thus, the means by sex are similar for the variables age, weight, height BMI, WC, WSI and WWCI.
On the other hand, when the classification is compared, according to the BMI and IPCC indicators by sex, it is observed that the percentages in the Normal category are similar in the male sex, while in the female sex it is higher for the WWCI indicator; in the overweight category it is slightly higher for BMI and higher in females; in the category obesity in the male sex is higher for the IPCC and in the female sex are similar (Figure 1).
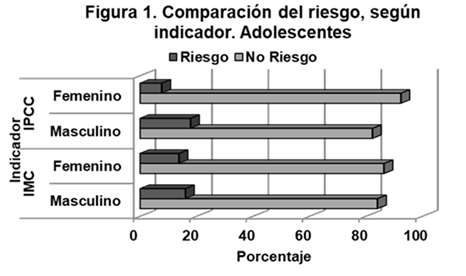
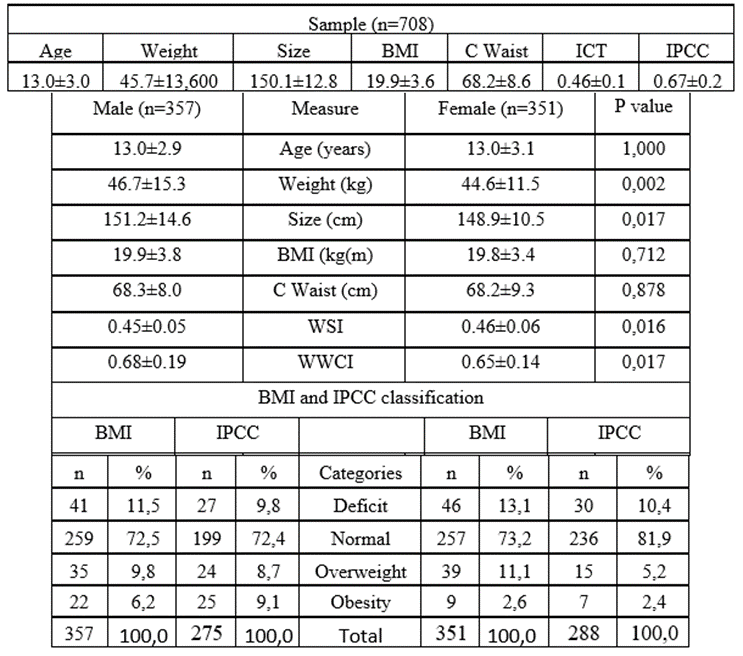
Table1: Profile of the group of adolescents.
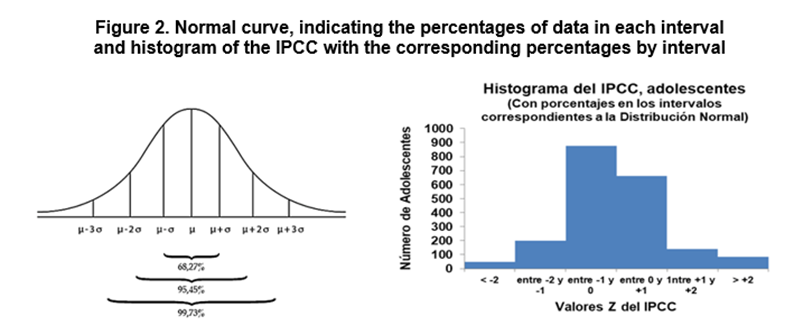
It is also necessary that for the IPCC indicator the values of the mean, median and mode are similar, which shows that the IPCC values behave like a Normal Distribution. It is also complemented by the percentages of data that must be met for the corresponding intervals, when standardizing these values. Thus, when considering the intervals of the Normal Distribution model, it is necessary that between -1 and +1 there are 528 cases representing 74.6percentage, between -2 and +2 there are 678 cases representing 95.8percentage and between -3 and +3 there are 702 cases representing 99.2percentage; as you can see the first percentage differs a little and the other two percentages are very similar (Figure 2).
The Normality Contrast was applied for the IPCC and it has that with the transformation of the variable to the logarithm the Shapiro-France Contrast (Shapiro-Wilk) yields a value of the W statistic equal to 0.993, which is greater than the p-value, so it can be concluded that the distribution of the IPCC variable can be considered normal. Likewise, the contrast Asymmetry and Kurtosis, yields a value of the statistic 2 = 6.019 that allows us to conclude that the distribution of the IPCC variable can be considered normal (Table 2).
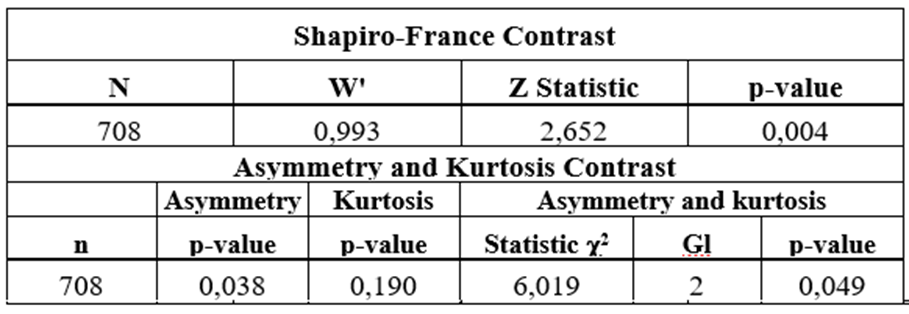
Table 2: Normal contrast results for the IPCC in adolescents.
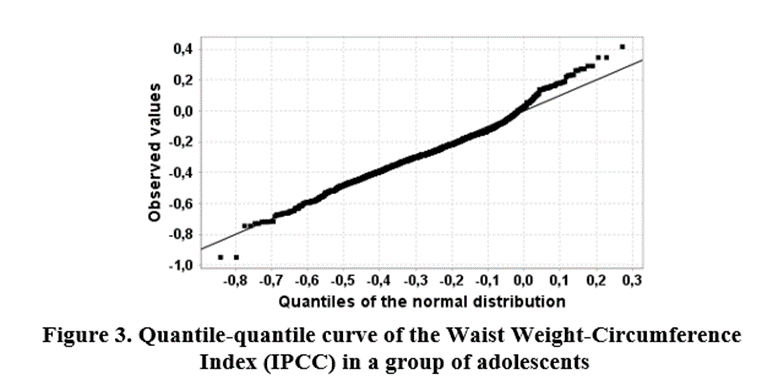
Additionally, the contrast allows to complement the analysis by means of the quantile-quantile curve; and considering that most of the points are located on the diagonal, this allows us to affirm that the distribution of the sample observations of the IPCC variable comes from a normal distribution (Figure 3).
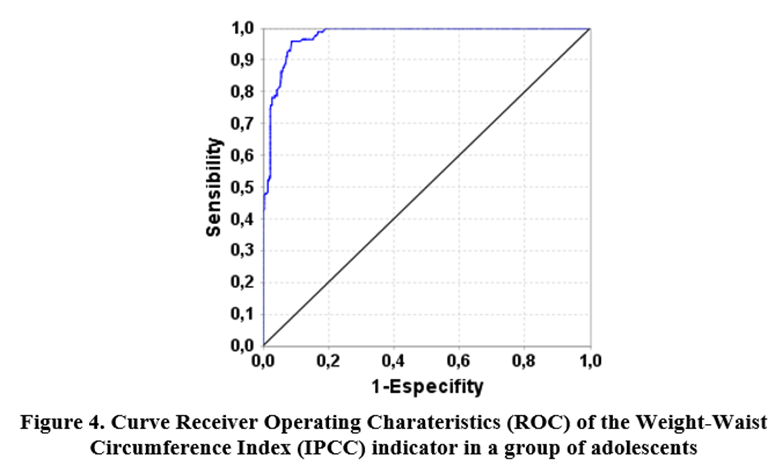
The ROC curve was additionally obtained by Logistic Regression, considering as a golden rule, the BMI and as a diagnostic test the WWCI, it has that this diagnostic test can be highly sensitive or highly specific, for this it is considered the cut-off point that jointly determines the highest sensitivity and specificity, in this case it turns out to be the point (0.80; 0.05) that corresponds to a Sensitivity of 80.0percentage and a specificity of 95.0percentage (Figure 4).
Considering the results obtained for this group of adolescents, it can be said that it is very homogeneous in terms of the anthropometric characteristics of the two sexes, since they are similar; In addition, when classified according to BMI and WWCI indicators, in nutritional status, the percentages of overweight are not significant for the male sex, but they are significant for the female sex; and the percentages of obesity are significant for the male sex, but in obesity.
When comparing the results obtained in this study with those obtained in previously published articles, Bauce in a sample of 571 children and adolescents [18] obtained averages for the WWCI of 0.67±0.13 and 0.66±0.10 for men and women, and in another study in a group of 123 adolescents aged 12 years or older [19] Means by sex of 0.70±0.9 and 0.65±0.14 for males and females, similar to those obtained in this study were 0.68±0.19 and 0.65±0m14, respectively, and statistically not significant.
On the other hand, the percentages of classification in overweight and obesity, according to the BMI and WWXI indicators are similar to those reported by Bauce [20] for the male sex, as well as for the female sex; in relation to the percentages of Obesity, these are similar in the male sex, but for the female sex it is slightly higher with the BMI obtained in this study and similar with the WWCI.
In relation to the ROC curve, it has to reflect that the IPCC turns out to be an indicator with high sensitivity and high specificity, which means that it can differentiate cases with risk. In addition, the Youden index with a value of 0.75 indicates that the WWCIis a reliable indicator that can be used to diagnose risk in adolescents.
According to the results obtained in the analysis and discussion of the data, it can be concluded that the indicator Weight-Waist Circumference Index (WWCI), in the first place it behaves likeis distributed as a normal distribution, which allows us to affirm that the analysis of its behavior through parametric statistical tests is reliable; Therefore, it is considered an indicator that provides sufficient information to be considered in the evaluation of overweight and obesity in adolescents, in addition to having a high sensitivity and specificity, which allows identifying the cases that are really at risk.
Dear Editorial Team, Clinical Medical Reviews and Reports. My experience with the journal was highly positive. The peer-review process was rigorous, constructive, and completed in a timely manner. The reviewers provided valuable comments that helped improve the quality and clarity of our manuscript. The editorial office was professional, responsive, and supportive throughout all stages of the publication process. Communication was clear and efficient, and any questions were addressed promptly. Overall, I found the journal to maintain high scientific standards and an excellent publication workflow. I would be pleased to consider submitting future work to this journal. Best wishes from, Elena Popa.

It was my pleasure to submit my testimonial concerning the Reviewer Board of our Scientific Journal “Brain and Neurological Disorders”. The Reviewers focused on some modifications and their contribution was helpful. The ladies of our Editorial Office were also supported my efforts. It was my honor to have such a co-operation and I am looking forward for more collaboration.

Dear Grace Pierce, Editorial Coordinator of Journal of Clinical Research and Reports, Thank you for the speedy and efficient peer review process. I appreciate the fact that your peer reviewers do not take months to respond like with some other journals. I would also like to thank the editorial office for responding quickly to my questions. It is an excellent journal. I plan to submit more manuscripts in the future. Best wishes from, Robert W. McGee

Dear Grace Pierce, Editorial Coordinator of Journal of Clinical Research and Reports, Working with you and your team on our recent publication in JCRR has been a truly wonderful and enjoyable experience. The responses were prompt, and the reviewers were patient, constructive, and highly professional. One reviewer in particular gave me the feeling that a professor was carefully reading and commenting on my coursework, which was deeply touching. The entire process was straightforward and hassle‑free, with no tedious online forms to complete. I highly recommend this journal. Best wishes from, DR Aibing Rao, Head of R&D

I Appreciate the Opportunity to Share my Experience with the Journal of Clinical Research and Reports. The peer review process was timely and constructive, and the feedback provided helped improve the quality of our manuscript. The editorial office was professional, responsive, and supportive throughout the process, ensuring smooth communication and efficient handling of the submission. Overall, it was a positive experience collaborating with your team.

Dear Mercy Grace, Editorial Coordinator of Obstetrics Gynecology and Reproductive Sciences, We would like to express our gratitude for your help at all stages of publishing and editing the article. The editors of the magazine answer all the necessary questions and help at every stage. We will definitely continue to cooperate and publish other works in the Obstetrics Gynecology and Reproductive Sciences! Best wishes from, Alla Konstantinovna Politova,
