
Research Article | DOI: https://doi.org/10.31579/2641-8975/005
*Corresponding Author: H J Teede, University of Pittsburgh Diabetes Institute, Australia.
Citation: H J Teede, S L Kozica, C B Lombard, D Ilic, S Ng, C L Harrison, The auditory P300 component of ERPs elicited during the oddball paradigm in type 2 diabetic patients, DOI: 10.31579/2641-8975/005
Copyright: © 2018 H J Teede.et.al.This is an open-access article distributed under the terms of the Creative Commons Attribution License, which permits unrestricted use, distribution, and reproduction in any medium, provided the original author and source are credited.
Received: 02 August 2018 | Accepted: 14 August 2018 | Published: 24 August 2018
Keywords: Keywords
Background: There is increasing interest in the impact of diabetes mellitus on cognitive functioning. Several studies found evidence of decreased cognitive performance in type 2 diabetics (T2DM). Since the P300 component of event-related potentials (ERPs) provides valuable information concerning cognition, we studied this component of ERPs in T2DM.
Methods: Auditory P300 event-related potentials (P300) were elicited in 43 T2DM patients and 29 age and sex-matched healthy volunteers by use of the auditory oddball paradigm, taking into account the age of the subjects, disease duration and the metabolic control.
Results: Compared with controls, diabetics had significantly longer P300 latencies (F= 5.05, p= 0.026) and lower P300 amplitudes both in Cz and Pz electrode positions (F= 8.01, p= 0.005 and F= 13.67, p= 0.000 respectively). In addition, a significant inverse correlation between P300 latency and amplitude was observed in diabetics both in Cz and Pz electrode positions (r= -0.43, p= 0.003 and r= -0.39, p= 0.01 respectively), whereas essentially no relationship between amplitude and latency was observed for the control group. N200 and P300 latencies and the reduction in their amplitudes in Cz and Pz leads were not related to either disease duration or metabolic control.
Conclusions: The observed electrophysiological abnormalities may reflect impairment of information processing and working memory, possibly associated with an accelerated ageing process. Our findings suggest that surface-recorded ERPs may be useful for detecting and monitoring the changes in brain function associated with diabetes mellitus.
Diabetes mellitus is the most common metabolic disorder in man and is associated with structural and functional alterations in various organs, including the central nervous system. There is increasing interest in the impact of diabetes mellitus on cognitive functions. Since the prevalence of type 2 diabetes mellitus (T2DM) increases with age and normal aging is associated with mild deterioration in cognition, the interplay between the aging process and the duration and magnitude of hyperglycaemia is expected to result in an accelerated cognitive decline. Indeed, previous studies have indicated that older people with T2DM have a higher risk of cognitive dysfunction or dementia [1]. Moreover, epidemiological studies have shown that T2DM is strongly associated with an increased risk for AD [2].
Event-related potentials (ERPs) provide a non invasive method of studying brain neural activity with a temporal resolution reflecting the speed of cognitive processes. The P300 wave is the most studied ERP component and is considered cognitive because it is generated when subjects attend and discriminate stimuli that differ from one another on some dimension and are presented unequally in a random fashion. It is a broad, positive potential with maximal amplitudes at parietal and central midline recording sites and a peak latency of about 300–600ms. P300 latency is considered an index of the relative timing of the stimulus evaluation process [3], and P300 amplitude is believed to reflect attentional resource allocation [4]. It has been suggested that P300 is produced by interactions between frontal lobe and hippocampal/temporoparietal procedures [5].
P300 has been used extensively in investigations of psychiatric and neurological disorders involving cognitive abilities. Alterations of its latency and amplitude have been described, appearing to reflect deficits in cognitive processing [6-8]. Several studies have revealed an electrophysiological evidence of cognitive dysfunction in diabetes, even in the absence of clinical signs of central nervous system damage [9-15]. Additionally, P300 has been shown to be more sensitive in detecting cognitive deficits than psychometric tests in T2DM [9]. However, conflicting results have been reported regarding the correlation of ERPs abnormalities with clinical parameters in diabetics [9-15].
Thus, the purpose of the present study was to investigate the effect of type 2 diabetes mellitus on cognitive functioning, using auditory P300 ERP as an assessment tool and to examine the relationship of P300 to duration of disease and short-term metabolic control.
Patients
A total of 72 subjects were enrolled in this study conducted by the first department of Neurology of Athens National University. The patient group comprised 43 (M:23, F:20) individuals with type 2 diabetes mellitus (39-72 years old), which were recruited from the department of Clinical Therapeutics of Athens National University. All T2DM patients met the diagnostic criteria proposed by the American Diabetes Association (ADA) [16]. Exclusion criteria were prior history of hypoglycaemic episodes, major head injury, neurosurgical operations, alcohol or drug abuse, signs or symptoms of stroke or any neurological illnesses other than diabetic neuropathy, hearing impairment, use of medication other than hypoglycaemic agents and Mini Mental State Examination score
Electrophysiological tests were performed on all of the diabetic patients in the morning between 9 and 10 a.m., after taking breakfast. Blood glucose levels were determined at the time of electrophysiological testing, to ensure absence of hypoglycaemia. HbA1c levels were measured within 7 days of test performance.
To obtain ERPs, subjects underwent a 2-tone auditory discrimination task (oddball paradigm). Two types of tones, 2000 Hz (target tone) and 1000 Hz (non-target tone), were delivered binaurally through earphones at 60 dB SPL (10 ms rise/fall, 50 ms plateau) with a rate of 1.1/s. Subjects were sitting with their eyes closed while stimuli were given, to minimize eye movements and blinking. They were asked to count silently the infrequent target tones, which presented randomly with a 0.20 probability in a series of the non-target tones, and to report the number of target tones at the end of each run. Before ERPs were recorded, the subjects completed a number of trials until they understood the different tones and the requirements of the test. EEG activity was recorded with 16 Ag-AgCl electrodes filled with paste, according to the International 10-20 system, attached to the scalp with collodion, with the linked cheeks processes and forehead serving as the reference and the ground, respectively. Electrode impedance was kept below 2 KΩ and the filter band was set at 0.1-30 Hz. The electrode positions used were F3, F4, F7, F8, T3, T4, T5, T6, C3, Cz, C4, P3, Pz, P4, O1, O2. The signal was amplified 20,000 times, the measurement epoch was 1024 ms and the sampling rate was 128 Hz per channel. Neural responses to the 2 types of stimuli were averaged separately on line and processed into voltage maps by a commercial 16 channel (Bio-Logic System Corp. Brain Atlas III) apparatus. Trials including artifacts were automatically rejected from the averages. The procedure was terminated after 35 averaged target stimuli. Each test was performed twice in order to demonstrate consistency of the waveforms. Latencies and amplitudes on each ERP component were measured from the waveforms of the first trial.
Peak latencies and baseline to peak amplitudes of N100, P200, N200 and P300 were evaluated. The P300 was identified as the highest positive peak between 250 and 600 ms after the warning stimulus (Figure 1 ).
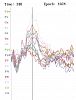
Peak amplitudes were measured, relative to the mean amplitude of the 100 ms pre-stimulus baseline period, and latency measurements were computed relative to stimulus onset. The earliest components N100, P200 and N200 were determined in a similar way, defined as the most negative or positive peak within the latency windows of 75-150, 150-250 and 190-360ms poststimulus, respectively [17]. Latencies of the N100 and P200 components were obtained from the non-target stimulus bank, whereas latencies of the N200 and P300 from the target stimulus bank.
Descriptive statistics are expressed as mean and ± SDs or SEs. Since the P300 latency has been reported to be prolonged in accordance with age [18], regression analysis was used to calculate the regression equation between P300 latency and age both in diabetics and controls. Analysis of covariance (ANCOVA) was used to compare the N100, P200, N200 and P300 latencies and amplitudes between controls and diabetics, using age as covariate. Pearson's correlation coefficient was calculated to assess the relationship between P300 latency and amplitude both in the control group and the patients. Pearson's correlation coefficients (r) were also used to assess the relationship between P300 latency/amplitude and disease duration as well as between P300 latency and HbA1c levels. Results were considered significant at the 0.05 level.
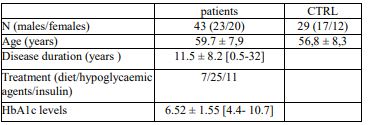
The demographic, clinical characteristics and laboratory findings of patients and controls are summarized in (Table 1).
A statistically significant positive linear correlation between P300 latency and age was observed in the patients but not in the control group. In diabetics, the slope of the latency/age regression line was 2.56 ms/year (t-test value= 3.81, p= 0.0005) whereas in the control group the corresponding slope was 0.64 (t-test value= 1.08, p= 0.29). Compared with controls, diabetics had significantly longer P300 latencies (F= 5.05, p= 0.026) and lower P300 amplitudes both in Cz and Pz electrode positions (F= 8.01, p= 0.005 and F= 13.67, p= 0.000 respectively, (Table 2 )

In the diabetics, no clear correlation was found between P300 latency and duration of the disease (r= -0.082, p=0.601). No significant correlation was observed between disease duration and P300 amplitude both in Cz and Pz electrode positions (r= -0.172, p=0.269 and r= -0.282, p=0.067 respectively). Similarly, no statistically significant correlation was found between the HbA1C level, the index of the diabetic control over the previous 2–3 months and P300 latency (r= 0.159, p= 0.384) as well as P300 amplitude both in Cz and Pz electrode positions (r= -0.170, p=0.388 and r= -0.226, p=0.248 respectively). Likewise, neither clear correlation was found between N200 latency and disease duration (r= -0.058, p=0.770) or HbA1C level (r= -0.186, p=0.433), nor between N200 amplitude in Cz and Pz and disease duration (r= 0.108, p=0.593 and r= -0.108, p=0.599 respectively) or HbA1C level (r= -0.234, p=0.336 and r= -0.194, p=0.440 respectively).
The present study examined the auditory P300 component of ERPs elicited during the oddball paradigm in type 2 diabetic patients. Compared with control subjects, the patient group showed significantly prolonged N200 and P300 latencies and significantly lower P300 amplitudes at the Cz and Pz leads. In previous studies, auditory P300 latencies in diabetics were either significantly prolonged [11-15], or tended to be prolonged [10], compared with controls. Concerning the amplitude of P300 the data are sparse. Most authors did not report measurements of amplitude [10-14], whereas others found no statistically significant difference in patients as compared to controls [15]. Abnormalities of the earlier ERP component N200 were also found in some studies [11,13], whereas in others no statistically significant difference between patients and controls was reported [15]. Additionally, in the present study, an inverse correlation of P300 latency with amplitude was shown in patients, whereas essentially no relationship between amplitude and latency was observed for the control group, a relation that has not been previously reported.
Although event-related potentials are considered an electrophysiological index of cognitive performance, knowledge of the relationship between ERP parameters and specific cognitive function domains is limited. The N100 and P200 components are believed to reflect the activity in neural areas that are activated by sensory modality and are independent of the subject's attention [19] whereas the N200 component is related to the unexpectedness of the stimulus and is regarded as a measure of the time of early stimulus processing, engaging orientation and attention [20]. With regard to P300, it is considered a reflection of memory storage operations that are initiated in the hippocampus, which is claimed to be the P300 generator [5]. The P300 latency is regarded as a measure of stimulus classification speed [21], reflecting the allocation of attentional resources for memory operations [22], whereas the P300 amplitude represents on-line updating of working memory and/or attentional processes involved in working memory [23]. Since the latencies of N100 and P200 did not differ between patients and controls, the prolongation of the N200 and P300 latencies found in the present study could not be attributed to delay in perceptual encoding. Therefore, the prolongation of the N200 latency might be associated with decline in attention and early stimulus processing, whereas the P300 abnormalities with difficulties in stimulus classification speed and working memory [24].
As far as cognitive impairment in diabetics is concerned, recent works report association between type 2 diabetes and greater decline in global cognitive performance as well as in specific cognitive function domains (memory, speed of cognitive processes, and mental flexibility) in middle-aged individuals, indicating that accelerated brain ageing might be present in T2DM patients [25-26]. Specifically, it has been suggested that decline in speed of cognitive processes is greater during the early stages of diabetes, whereas affection of memory is unremitting [25]. Considering that P300 latency reflects the speed of neuronal events underlying information processing and that P300 amplitude is associated with attention and short-term memory, our electrophysiological data appear to be in line with these neuropsychological findings.
Although diabetes mellitus is thought to be an important factor contributing to premature loss of cognitive abilities in older individuals, the putative pathogenetic mechanisms have not been fully elucidated [27]. In the present study no significant correlation between N200 and P300 latency or amplitude in Cz and Pz and either disease duration or short-term metabolic control, as it is reflected in HbA1c level, was revealed, in line with previous studies [11-14]. Given that decline in speed of cognitive processes is greater during the early stages of diabetes [25], the absence of correlation of N200 and P300 latencies and amplitudes with disease duration is not surprising. Despite the lack of any correlation between the clinical parameters of diabetes and the observed event-related potential abnormalities, it is plausible to assume that chronic sustained hyperglycaemia, might have accounted for the occurrence of the electrophysiological deficits. Hyperglycaemia has potentially toxic effects on neurons in the brain through osmotic insults, oxidative stress mediated free radical formation, increased release of inflammatory cytokines and non enzymatic glycosylation which irreversibly modifies tissue proteins and organ functions [28]. Moreover, chronic hyperglycemia is thought to contribute to reduced hippocampal neurogenesis and consequently hippocampal atrophy and cell death [29]. In support to these observations, in a recent resting-state functional magnetic resonance imaging study, it was provided evidence of reduced functional hippocampal connections bilaterally to widespread regions in T2DM patients compared to healthy controls [30]. Additionally, it has been suggested that connections between the P300 generators, i.e. the white matter volume, have a more profound impact on P300 than the size of the generators themselves [31]. Since P300 is thought to be produced by interactions between frontal lobe and hippocampal/temporal–parietal processes [5] it could be hypothesized that the P300 abnormalities in T2DM reported in the present study, might possibly reflect these neuropathological and functional alterations associated with the hippocampal circuitry, which is involved in learning and working memory. Should P300 be proved a reliable index of central nervous system dysfunction in diabetes mellitus and more sensitive than neuropsychologica1 testing, it could be used to prospectively evaluate the effects of therapeutic interventions on cognitive function in type 2 diabetes mellitus.
We showed prolonged latency of N200 and P300 and reduced P300 amplitude inversely correlated with P300 latency, at central midline brain area, in T2DM, without any association with disease duration or short-term metabolic control. The observed electrophysiological abnormalities may reflect impairment of attention, short-term memory and speed of information processing, possibly indicating an accelerated ageing process in diabetics. Our findings suggest that surface-recorded ERPs may be useful for detecting and monitoring the changes in brain function associated with diabetes mellitus.
Dear Editorial Team, Clinical Medical Reviews and Reports. My experience with the journal was highly positive. The peer-review process was rigorous, constructive, and completed in a timely manner. The reviewers provided valuable comments that helped improve the quality and clarity of our manuscript. The editorial office was professional, responsive, and supportive throughout all stages of the publication process. Communication was clear and efficient, and any questions were addressed promptly. Overall, I found the journal to maintain high scientific standards and an excellent publication workflow. I would be pleased to consider submitting future work to this journal. Best wishes from, Elena Popa.

It was my pleasure to submit my testimonial concerning the Reviewer Board of our Scientific Journal “Brain and Neurological Disorders”. The Reviewers focused on some modifications and their contribution was helpful. The ladies of our Editorial Office were also supported my efforts. It was my honor to have such a co-operation and I am looking forward for more collaboration.

Dear Grace Pierce, Editorial Coordinator of Journal of Clinical Research and Reports, Thank you for the speedy and efficient peer review process. I appreciate the fact that your peer reviewers do not take months to respond like with some other journals. I would also like to thank the editorial office for responding quickly to my questions. It is an excellent journal. I plan to submit more manuscripts in the future. Best wishes from, Robert W. McGee

Dear Grace Pierce, Editorial Coordinator of Journal of Clinical Research and Reports, Working with you and your team on our recent publication in JCRR has been a truly wonderful and enjoyable experience. The responses were prompt, and the reviewers were patient, constructive, and highly professional. One reviewer in particular gave me the feeling that a professor was carefully reading and commenting on my coursework, which was deeply touching. The entire process was straightforward and hassle‑free, with no tedious online forms to complete. I highly recommend this journal. Best wishes from, DR Aibing Rao, Head of R&D

I Appreciate the Opportunity to Share my Experience with the Journal of Clinical Research and Reports. The peer review process was timely and constructive, and the feedback provided helped improve the quality of our manuscript. The editorial office was professional, responsive, and supportive throughout the process, ensuring smooth communication and efficient handling of the submission. Overall, it was a positive experience collaborating with your team.

Dear Mercy Grace, Editorial Coordinator of Obstetrics Gynecology and Reproductive Sciences, We would like to express our gratitude for your help at all stages of publishing and editing the article. The editors of the magazine answer all the necessary questions and help at every stage. We will definitely continue to cooperate and publish other works in the Obstetrics Gynecology and Reproductive Sciences! Best wishes from, Alla Konstantinovna Politova,
