
Research Article | DOI: https://doi.org/10.31579/2693-4779/167
1 School of Life Sciences and Biotechnology, Chhatrapati Shahu Ji Maharaj University Kanpur, Uttar Pradesh, India.
2 School of Biotechnology, Gautam Buddha University, Greater Noida, India.
3 Amity Institute of Neuropsychology and Neurosciences, Amity University Uttar Pradesh, India.
4 Madurai Kamaraj University, Tamil Nadu, India.
*Corresponding Author: Pramod Yadav, Department of AFAF, Amity University Uttar Pradesh, Noida Campus, 201313, India.
Citation: Vishal Chandra, Tashfeen Ashraf, Pramod Yadav, Vikas Raghuvanshi, (2024), Synovial Fluid Proteomics and Serum Metabolomics Reveal Molecular and Metabolic Changes in Osteoarthritis, Clinical Research and Clinical Trials, 9(2); DOI:10.31579/2693-4779/167
Copyright: © 2024, Pramod Yadav. This is an open access article distributed under the Creative Commons Attribution License, which permits unrestricted use, distribution, and reproduction in any medium, provided the original work is properly cited.
Received: 29 October 2023 | Accepted: 25 November 2023 | Published: 08 January 2024
Keywords: metabolomics; mass spectrometry of synovial fluid; biomarkers; joint disease; cartilage degeneration
Background: Osteoarthritis (OA) is a common joint disorder with a complex and multifactorial pathogenesis. Proteomics analysis using two-dimensional gel electrophoresis (2DE) and mass spectrometry (MS) enables high-throughput identification of differentially expressed proteins related to OA. However, the etiology, pathophysiology, and early diagnostic markers of OA are still poorly understood. Methods: Synovial fluid protein biomarkers were compared between OA patients and healthy controls. It was fractionated using DEAE cellulose and Sephadex G-200 columns, followed by SDS‒PAGE and 2D-PAGE for visualization and identification. Mass spectrometry and Mascot were used for protein analysis, and serum metabolite profiles were also investigated using 1D 1H CPMG NMR spectra. Multivariate data analysis, including PCA and PLS-DA, was performed to detect metabolic differences between groups.
Results: Proteomics analysis revealed differential expression of synovial fluid proteins, such as serine protease inhibitors, complement components, and apolipoproteins, which may be involved in inflammation and cartilage breakdown. Additionally, serum metabolite profiles differed significantly between OA patients and controls, involving amino acid, lipid, glucose, and energy metabolism. The pathway analysis indicated disruption of the metabolic pathways associated with these metabolites. Conclusions: This study provides insights into the molecular and metabolic changes in OA. Protein biomarkers and serum metabolite alterations enhance the understanding of OA pathogenesis and offer potential opportunities for early diagnosis and disease management. Further validation and translation of these findings into clinical applications are needed for improved OA detection and intervention strategies.
- Serum metabolite profiles reveal metabolic alterations in OA patients.
- Pathway analysis shows disrupted metabolic pathways in OA patients.
- Protein biomarkers and metabolites enhance the understanding of OA pathogenesis.
- Potential diagnostic and prognostic markers for OA detection and management.
Osteoarthritis (OA) is a degenerative joint disease that affects the articular cartilage, and its characteristics are increased friction, wear between bones, pain, swelling, stiffness and reduced mobility [1]. Among these, pain is a common symptom of OA, but its origin is unclear since cartilage lacks nociceptors. Morning stiffness is another symptom, but it lasts less than 30 minutes, and patients may also experience joint instability or locking [2,3]. According to the WHO, OA is expected to be the fourth leading cause of knee disability by 2024 [4]. Globally, more than 100 million people suffer from OA, and it has a higher prevalence in women than men [5]. The prevalence of knee OA increases with age and varies across regions, ranging from 7.5% in China [6] to 25% in northern Pakistan [7]. In India, OA is the second most prevalent rheumatologic problem, with a prevalence of 22% to 39%, and affects 60.6% of the urban population and 5.78% of the rural population [8]. Among people aged 65 years and above, OA accounts for 50% of all disability diseases [9]. The pathogenesis of OA is complex and multifactorial, involving the interaction of cartilage, subchondral bone, periosteum, joint capsule, and synovial fluid [10]. Physical examination is essential for diagnosis, and plain radiography can confirm OA in some cases, but advanced imaging techniques such as magnetic resonance imaging (MRI) are required for accurate diagnosis, especially if meniscal injury is suspected. However, these techniques are not affordable for many patients, resulting in underdiagnosis of OA. Despite considerable progress in OA research, its pathogenesis, etiology and progression remain poorly understood. Studies have reported abnormalities in the immune response and immune cells of OA patients, such as altered T-cell subsets. These abnormalities may play a role in the pathogenesis of OA and modulate the inflammatory response in the synovial membrane (SM), leading to cartilage degradation [11]. Despite extensive research with multiple approaches, our understanding of OA etiology and pathophysiology and our ability to diagnose it at an early stage are limited [12]. The present study was undertaken to investigate the comparative analysis of protein biomarkers occurring in the synovial fluid of patients and healthy controls.
We selected control subjects free of any clinical or radiological signs of joint disease, comorbidities, obesity, hypersensitivity, or cardiovascular disease. We used the Kellgren and Lawrence (K-L) score, the WOMAC score, the VAS score, and the American College of Rheumatology (ACR) classification to screen and evaluate OA patients. Only patients who met six or more criteria were included. Patients had knee pain (asymmetrical) lasting more than six months, stiffness (less than 30 minutes), swelling, cripitus, tenderness on the medical side of the joint, X-ray (Grade II-78 and Grade III-22), normal ligament stability, decreased motion, duration of symptoms (3.3±1.49 years), range of movements (0-140/42± 20.2), VAS pain on movement (4.7±1.4 cm) and WOMAC score of patients (difficulty 31.0±8.1; pain 9.2±2.2; stiffness 4.2±1.3 and total 44.2±9.8). We excluded patients with infectious diseases such as diabetes mellitus, hypertension, thyroid dysfunction, neurological disorders, cancer, or other forms of arthritis. We also excluded patients with early OA (<2>). The current study was approved by the Institutional Ethical Committee (CSJMU/BSBT/BT/EC-20), and all participants provided written informed consent.
Synovial fluid was obtained from patients and healthy controls by an orthopedic doctor and diluted with 50 mM Tris-HCl buffer (pH 8). The diluted samples were stored at 4°C and applied to a DEAE cellulose column with a linear gradient of 0-500 mM NaCl (250 ml) at a flow rate of 84 ml/h. The fractions were collected and reapplied to a Sephadex G-200 column equilibrated with Tris-Cl buffer (50 mM and pH 7.4) and NaCl (100 mM) at a 45 ml/h flow rate. The eluted proteins were precipitated with ammonium sulfate, dissolved in a buffer with protease inhibitors, and used for SDS‒PAGE and 2D-PAGE [13–16]. For the first dimension in 2D-PAGE, the protein concentration was determined by the Bradford method. Then, 200 µg of protein was mixed with 5 µl of 10% SDS and 5.3 µl of 1 M DTT, boiled at 100°C for 5 minutes, and placed on ice. Then, 100-120 µl of rehydration buffer (with 0.5 g of total protein extraction buffer, 0.5 ml of total protein extraction diluent, 50 µl of DTT, 100 µl of protease inhibitors, and 0.2% ampholytes) was added and loaded onto an IPG strip for active rehydration overnight. After 11-16 hours of active rehydration, the strip was removed, wiped off with tissue paper, and placed on the power pack with the correct orientation of electrodes (+/-). The strips were transferred to the top of 12
The protein spots from the OA profile digested with trypsin were expunged from the 2D gel and analysed by MALDI-MS/MS. Many peptides and proteins were identified by searching the MascotTM database (see Figure. 1),
| Accession | Protein | Modifications/function | pI | MW [kDa] | #Alt. Protein | Scores | SC [%] | RMS90 [ppm] |
| AACT_HUMAN | Alpha-l-antichymotrypsin sapiens | Oxidation (inhibitor) | 5.3 | 47.6 | 1 | 339.6 (M:339.6) | 16.5 | 40.27 |
| ANT3_HUMAN | Antithrombin-III | Nonvitamin K-dependent protease | 6.3 | 52.6 | 1 | 56.2 (M:56.2) | 2.6 | 39.85 |
| AIBG_HUMAN | Alpha-lB-glycoprotein | Upregulated in adenocarcinoma-unknown function | 5.6 | 54.2 | 1 | 21.1 (M:21.1) | 1.6 | 41.8 |
| APOA1_HUMAN | Apolipoprotein A-I | Cholesterol metabolism | 5.6 | 30.8 | 1 | 172 (M:172.0) | 22.5 | 23.66 |
| AIBG_HUMAN | Alpha-lB-glycoprotein | Carbamidomethyl/Upregulated in adenocarcinoma-unknown function | 5.6 | 54.2 | 1 | 705.7 (M:705.7) | 38.2 | 9.87 |
| CO9_HUMAN | Complement component C9 C4b-binding protein alpha | Complement cascade | 5.4 | 63.1 | 1 | 50.3 (M:50.3) | 2.1 | 39.23 |
| C4BPA_HUMAN | chain | Complement cascade | 7.2 | 67 | 1 | 15.1 (M:15.1) | 1.8 | 40.78 |
| CO3_HUMAN | Complement C3 | Oxidation/Complement cascade | 6 | 187 | 1 | 313.7 (M:313.7) | 4.1 | 24.23 |
| CSN2_HUMAN | COP9 signalosome complex subunit 2 | Ubiquitin regulator | 5.4 | 51.6 | 1 | 17.0 (M:17.0) | 2.3 | 763.59 |
| EFCB7HUMAN | EF-hand calcium-binding domain-containing protein 7 | Carbamidomethy Ucytoplasmic calcium sensor | 6 | 71.9 | 1 | 31.6 (M:31.6) | 1.6 | 44.1 |
| FIBA_HUMAN | Fibrinogen alpha chain | Act as DAMPs | 5.7 | 94.9 | 1 | 82.0 (M:82.0) | 3.1 | 40.02 |
| HBB_HUMAN | Hemoglobin subunit beta | Oxidation/blood pigment | 6.7 | 16 | 5 | 187.8 (M:187.8) | 28.6 | 14.73 |
| HEMO_HUMAN | Hemopexin | Carbamidomethyl, Oxidation/inflammation induced acute phase protein | 6.5 | 51.6 | 1 | 381.8 (M:381.8) | 32.7 | 39.92 |
| HRG_HUMAN | Histidine-rich glycoprotein | Carbamidomethyl/roles in immunity, coagulation | 7.1 | 59.5 | 1 | 169.3 (M:169.3) | 10.1 | 39.27 |
| IGHA1_HUMAN | Ig alpha-1 chain C region | Carbamidomethyl/immunity | 6.1 | 37.6 | 2 | 235.4 (M:235.4) | 21.8 | 40.36 |
| KV311_HUMAN | Ig kappa chain V-III region IARC/BL41 | immunity | 6.2 | 14.1 | 1 | 80.6 (M:80.6) | 12.5 | 23.77 |
| IGHG1_HUMAN | Ig gamma-1 chain C region | Carbamidomethyl/immunity | 8.5 | 36.1 | 2 | 61.5 (M:61.5) | 7.9 | 23.62 |
| LV_l02_HUMAN | Ig lambda chain V-I region HA | Immunity | 9.1 | 11.9 | 2 | 56.3 (M:56.3) | 18.8 | 24.64 |
| TRFM_HUMAN | Melanotransferrin | Carbamidomethyl/Role in melanoma cell proliferation and tumorigenesis | 5.6 | 80.2 | 1 | 41.6 (M:41.6) | 1.8 | 780.36 |
| OSGI2_HUMAN | Oxidative stress-induced growth inhibitor 2 | Oxidation/apoptotic regulator | 7 | 56.6 | 1 | 16.2 (M:16.2) | 1.6 | 1076.69 |
| THRB_HUMAN | Prothrombin | Blood clotting | 5.6 | 70 | 1 | 31.5 (M:31.5) | 1.6 | 7.97 |
| KS6A3_HUMAN | Ribosomal protein S6 kinase alpha 3 | Oxidation/Mediates cell survival | 6.4 | 83.7 | 1 | 17.4 (M:17.4) | 1.2 | 31.89 |
| RMD2_HUMAN | Regulator of microtubule dynamics protein 2 | Role in signaling | 6.1 | 47.4 | 1 | 16.5 (M:16.5) | 4.6 | 4.1 |
| RABXS_HUMAN | Rab5 GDP/GTP exchange factor | Involved in signaling | 6.4 | 79.3 | 1 | 17.2 (M:17.2) | 1.8 | 632.58 |
| RB27B_HUMAN | Ras-related protein Rab-27B | Involved in vesicular fusion and trafficking | 5.4 | 24.6 | 1 | 15.1 (M:15.1) | 5 | 774.92 |
| ARRS_HUMAN | S-arrestin | Role in retinal photoreceptorcells | 6.1 | 45.1 | 1 | 16.4 (M:16.4) | 3.2 | 48.05 |
| TRFE_HUMAN | Serotransferrin | Oxidation/uptake of transferring bound iron | 6.8 | 77 | 1 | 4161.6 (M:4161.6) | 63.8 | 10.29 |
| TMM78_HUMAN | Transmembrane protein 78 | - | 4.9 | 15.2 | 1 | 18.1 (M:18.1) | 5.9 | 1229.9 |
| VTDB_HUMAN | Vitamin D binding protein | Bone metabolism | 5.4 | 52.9 | 1 | 19.5 (M:19.5) | 2.3 | 10.76 |
[(PE: protein existence, SV: sequence version, MW [kDa], pI: isoelectric point, Score:
Mascot score, SC: sequence coverage, RMS90 [ppm]: root mean square (RMS.)]
| Serine protease inhibitors/signalling proteins | Bone metabolism/ pathway regulators | Inflammation and immunologic cascade | Oxidative stress | Cholesterol metabolism |
| Alpha 1 | Vitamin D binding | Alpha 1B glycoprotein | Hemopexin | Apolipoprotein A |
| antichymotrypsin | protein | Apolipoprotein A1 | Transmembrane | EF hand |
| Antithrombin III | Zinc finger and BTB | Fibrinogen alpha chain | protein78 | calcium binding domain |
| Hemopexin | domain protein 45 | Rab5 GDP/GTP exchange | Oxidative | |
| Prothrombin | factor | stress-induced | ||
| Serotransferrin | S-arrestin | growth | ||
| Melanotransferrin | Complement C3 | inhibitor 2 | ||
| COP9 signalosome | Complement component C9 | |||
| complex subunit 2 | C4 binding protein α chain |
components C3 and C4b and the immunoglobulin constant region. These proteins may play a role in OA pathogenesis; however, no direct disease-specific proteins were detected in this study.

Figure 1. 2D-PAGE analysis of OA patients. A) Control; B) and C) OA patient profiles.
The spectra (Fig. 3) displayed 1H NMR signals mainly from small metabolites with intense signals from lipoproteins, phospholipids,
unsaturated lipids, choline metabolites, N-acetyl glycoproteins, glucose, lactate and amino acids. No major differences between the OA and control groups were observed by visual comparison. Hence, multivariate data analysis was performed on the NMR spectra to reveal the serum metabolic alterations caused by OA. The serum metabolic patterns of 10 grade IIIII OA patients and sex-matched normal controls were analysed. The study subjects were selected to reduce the confounding variables (see Annexure 3). Fig. 3 shows that the OA group was clearly discriminated from the control group along the PC1 direction, indicating distinct characteristics of OA serum. This method also detected outliers outside the 95% confidence region of the PCA model. We then applied the supervised clustering method PLS-DA to examine the subtle metabolic variations among the groups. The quality of
each model was assessed by the parameters R2 and Q2, which are shown in the respective score plots in Figure 3(B). The model quality parameters R2 and Q2 were significantly high (R2, Q2 > 0.7), indicating satisfactory fit and good predictive power of the PLS-DA models (constructed from CPMG spectra). The PLS-DA score plots also showed that the OA and control groups were well clustered and separated, reflecting significant differences in the biochemical composition profiles of serum metabolites in OA patients and normal controls. The metabolites responsible for the discrimination were identified using the VIP and p < 0>
| Serine protease inhibitors/signalling proteins | Bone metabolism/ pathway regulators | Inflammation and immunologic cascade | Oxidative stress | Cholesterol metabolism |
| Alpha 1 | Vitamin D binding | Alpha 1B glycoprotein | Hemopexin | Apolipoprotein A |
| antichymotrypsin | protein | Apolipoprotein A1 | Transmembrane | EF hand |
| Antithrombin III | Zinc finger and BTB | Fibrinogen alpha chain | protein78 | calcium binding domain |
| Hemopexin | domain protein 45 | Rab5 GDP/GTP exchange | Oxidative | |
| Prothrombin | factor | stress-induced | ||
| Serotransferrin | S-arrestin | growth | ||
| Melanotransferrin | Complement C3 | inhibitor 2 | ||
| COP9 signalosome | Complement component C9 | |||
| complex subunit 2 | C4 binding protein α chain |
3. [The terms ‘up’ and ‘down’ denote elevated and reduced metabolite levels in OA patients compared to normal controls. 4.(AUC: Area under curve (receiver operating characteristic curve), VIP: Variable importance in projection (for
5. quantitative estimation of discriminatory power of each individual feature).

Figure 1. 2D-PCA. (A) Partial least square discriminant analysis (PLS-DA) (B) score plots.

Heatmaps Figure. 4 shows the heatmaps for different metabolites that distinguish the OA group from the control group (upregulated and downregulated metabolites are shown in red and cyan, respectively). Consistent with our serological data, we found high serum creatinine and a low HDL/LDL ratio in OA by NMR analysis. OA is typically associated with dyslipidemia and has high serum creatinine and low uric acid, as identified by serological analysis. Using a nonparametric Mann‒Whitney test, we quantified the differential abundance of metabolites and found that most of them were statistically significant (p < 0>

3.2.2: ROC curves
The area under the ROC curve reflects the discriminatory ability (0.5 indicates no discrimination; 1 indicates perfect discrimination). The AUC values ranged from 0.95 to 0.55 (see Figure. 5), indicating that these metabolites could be potential biomarkers for the clinical evaluation and surveillance of such patients. Figure 5 depicts representative ROC curves for some of the serum metabolites that exhibited significant changes in OA patients and their corresponding box plots (from the univariate analysis).
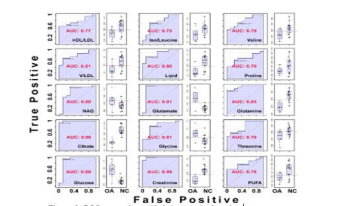
Figure 6. ROC curves along with their respective box plots.
[Respective box plots of the significant metabolites that decreased or increased in the OA patients compared to the control group derived from the CPMG 1H NMR spectra. Boxes denote interquartile ranges, lines denote medians, and whiskers denote 10th and 90th percentiles.]
3.2.3. Metabolic pathway by ORA
Fig. 6 summarizes the pathway analysis and MSEA in MetaboAnalyst results. Five important metabolic pathways (protein biosynthesis, amino acid metabolism, glucose-energy metabolism) were found to be disturbed. The metabolic pathways associated with the identified combinations of metabolites are biased due to limited metabolites detected by NMR in the serum.

Figure 2.A diagram of a pathway impact by ORA.
[The analysis was performed by using a pathway library restricted to Homo sapiens, and p values for ORA represent hypergeometric tests. Test p value (vertical axis, colour intensity) and impact factor (horizontal axis, circle size)].
4.1. Proteomics profile analysis by mass spectrometry
This study proposed that some proteins were overexpressed in OA patients, but none of these proteins were directly implicated in the pathophysiology of the disease (see Annexure 3). We identified several proteins, such as serine protease inhibitors, high levels of ATIII, and proteins related to lipid transport or protein binding, such as apolipoproteins, immunoglobulins, transmembrane proteins and transcriptional proteins. These proteins are involved in cartilage degradation or protein synthesis. Olsen et al. reported that the levels of APO-A1 in the synovial fluid of OA patients are higher due to diffusion and production by chondrocytes and FLSs [26]. Our results confirmed the role of APO-A1 in inflammation with increased expression of fibrinogen protein in OA and confirmed that these proteins can trigger TLR-4-dependent macrophage production of inflammatory cytokines and growth factors. This study reports high expression and activation of complement in OA joints. It also identified the proinflammatory complement components C3, C4b, and C9. C9 components from MAC were aberrantly expressed in OA, and C3 and C4b were higher in the early stage of OA. Hemopexin (HPX) is an acute phase protein that suppresses the adhesion of leukocytes and the release of cytokines from macrophages. Its high level suggests its role in OA. We also identified proteins involved in extracellular matrix, cartilage, and bone metabolism. Rab5 GDP/GTP exchange factor expression supports the role of the Ras superfamily in OA progression.
4.2. Metabolite analysis by NMR
The results of this study indicate that early metabolic changes in OA can be detected in serum by NMR. According to a study, degenerative joint disease can affect the synovium, as it becomes hypoxic [27]. This is also observed due to increased lactate concentration. This study found an increased creatinine concentration that indicates altered metabolism in early OA. Similar results have been reported for the serum metabolite profile in a sheep model of OA [28]. We observed increased glutamine and glutamate concentrations in the serum of OA patients. Glutamine confers chondrocyte resistance to heat stress and NO-mediated apoptosis [29]. Hence, glutamine elevation may reflect chondrocyte adaptation to various stressors during disease progression. Choline augmentation might indicate lipid catabolism from articular cartilage and leakage of its products into the bloodstream due to synovial membrane permeability enhancement. Alternatively, increased choline could result from the breakdown of Hoffa’s pad or phospholipids in the joint [30]. We also found reduced leucine and histidine in the serum of OA patients. Comparison of spectral profiles of controls and patients reveals that cartilage breakdown continues with increased glycerol and hydroxybutyrate. Glycerol synthesis indicates triglyceride degradation in various tissues. Moreover, the decreased HDL/LDL ratio and PUFAs reflect the impact of free radical generation through lipid peroxidation, leading to high oxidative stress and inflammation [31].
Proteomics analysis using 2D-PAGE coupled with mass spectrometry revealed differentially expressed proteins involved in inflammation, oxidative stress, and the immune response, suggesting a complex interplay of factors in OA pathogenesis. NMR-based metabolomics analysis identified altered metabolic patterns in the serum of OA patients, indicating hypoxia, inflammation, and lipid metabolism disruption. Increased lactate and creatinine levels suggest tissue hypoxia and muscle breakdown near the affected joint. Alterations in amino acids, lipoproteins, and glucose-energy metabolism indicate disrupted metabolic pathways in OA patients. The integration of proteomics and metabolomics data provided a comprehensive view of the disease, highlighting potential targets for further investigation. The identified proteins and metabolites could serve as candidates for future diagnostic or prognostic biomarkers for OA. Further studies are needed to validate these findings and improve our understanding of OA pathophysiology and early detection.
| OA | - | Osteoarthritis |
| MS | - | Mass Spectrometry |
| 2DE | - | Two-Dimensional Gel Electrophoresis |
| SDS‒PAGE | - | Sodium Dodecyl Sulfate‒Polyacrylamide Gel Electrophoresis |
| NMR | - | Nuclear Magnetic Resonance |
| PCA | - | Principal Component Analysis |
| PLS-DA | - | Partial Least Squares-Discriminant Analysis |
| WHO | - | World Health Organization |
| K-L | - | Kellgren and Lawrence |
| WOMAC | - | Western Ontario and McMaster Universities Arthritis Index |
| VAS | - | Visual Analog Scale |
| ACR | - | American College of Rheumatology |
| DEAE | - | Diethylaminomethyl |
| SM | - | Synovial Membrane |
| MRI | - | Magnetic Resonance Imaging |
| RA | - | Rheumatoid Arthritis |
| VIP | - | Variable Importance in Projection |
| AUC | - | Area Under Curve |
| FDR | - | False Discovery Rate |
| HDL | - | High-Density Lipoproteins |
| LDL | - | Low-Density Lipoproteins |
| PUFA | - | Polyunsaturated Fatty Acids |
| ORA | - | Over-Representation Analysis |
| DAMPs | - | Damage-Associated Molecular Patterns |
| TLR-4 | - | Toll-like Receptor 4 |
Author 1 declared no conflict of interest.
Author 2 declared no conflict of interest.
Author 3 declared no conflict of interest.
Author 4 declared no conflict of interest.
This research was unfunded by any public, commercial, or not-for-profit agencies
The study adhered to the ethical standards of India and internationally, with approval from the Institutional Ethical Committee (CSJMU/BSBT/BT/EC-20) and written informed consent from all patients, including controls and OA subjects.
The article’s full responsibility lies with PY, who is the corresponding author and the third author in the list.
Dr. VC was responsible for manuscript conceptualization, writing - original draft, ethical approvals, consent, and sample collection. VR participated in writing - review & editing. PY contributed to manuscript writing, formatting, revision and communication with all authors. Dr. TA supervised all authors and wrote, reviewed and edited the final manuscript.
The authors thank the Institute of Biosciences and Biotechnology, Chhatrapati Shahu Ji Maharaj University, Kanpur - 208024, India, for providing the laboratory facilities and the Department of the Community Health Centre, Ganesh Shankar Vidyarthi Memorial Medical College (GSVM) Medical College, Kanpur – 208002, India, for recruiting the controls and subjects.
Data and materials are available upon request.
All authors consented to manuscript publication.
Dear Editorial Team, Clinical Medical Reviews and Reports. My experience with the journal was highly positive. The peer-review process was rigorous, constructive, and completed in a timely manner. The reviewers provided valuable comments that helped improve the quality and clarity of our manuscript. The editorial office was professional, responsive, and supportive throughout all stages of the publication process. Communication was clear and efficient, and any questions were addressed promptly. Overall, I found the journal to maintain high scientific standards and an excellent publication workflow. I would be pleased to consider submitting future work to this journal. Best wishes from, Elena Popa.

It was my pleasure to submit my testimonial concerning the Reviewer Board of our Scientific Journal “Brain and Neurological Disorders”. The Reviewers focused on some modifications and their contribution was helpful. The ladies of our Editorial Office were also supported my efforts. It was my honor to have such a co-operation and I am looking forward for more collaboration.

Dear Grace Pierce, Editorial Coordinator of Journal of Clinical Research and Reports, Thank you for the speedy and efficient peer review process. I appreciate the fact that your peer reviewers do not take months to respond like with some other journals. I would also like to thank the editorial office for responding quickly to my questions. It is an excellent journal. I plan to submit more manuscripts in the future. Best wishes from, Robert W. McGee

Dear Grace Pierce, Editorial Coordinator of Journal of Clinical Research and Reports, Working with you and your team on our recent publication in JCRR has been a truly wonderful and enjoyable experience. The responses were prompt, and the reviewers were patient, constructive, and highly professional. One reviewer in particular gave me the feeling that a professor was carefully reading and commenting on my coursework, which was deeply touching. The entire process was straightforward and hassle‑free, with no tedious online forms to complete. I highly recommend this journal. Best wishes from, DR Aibing Rao, Head of R&D

I Appreciate the Opportunity to Share my Experience with the Journal of Clinical Research and Reports. The peer review process was timely and constructive, and the feedback provided helped improve the quality of our manuscript. The editorial office was professional, responsive, and supportive throughout the process, ensuring smooth communication and efficient handling of the submission. Overall, it was a positive experience collaborating with your team.

Dear Mercy Grace, Editorial Coordinator of Obstetrics Gynecology and Reproductive Sciences, We would like to express our gratitude for your help at all stages of publishing and editing the article. The editors of the magazine answer all the necessary questions and help at every stage. We will definitely continue to cooperate and publish other works in the Obstetrics Gynecology and Reproductive Sciences! Best wishes from, Alla Konstantinovna Politova,
