
Research Article | DOI: https://doi.org/10.31579/2692-9406/005
*Corresponding Author: Mohamed Hisham Aref, Military Technical College, Biomedical Engineering Department, El-Fangary Street, Cairo, EGYPT.
Citation: Mohamed Hisham. Aref., Ibrahim H. Aboughaleb., Yasser H. El-Sharkawy. (2020) Spatiotemporal Thermal Contours mapping of ex- vivo Bovine Liver Radiofrequency Thermal Ablation utilizing Hyperspectral Image and its Associated K-Mean Clustering Algorithm. Biomedical Research and Clinical Reviews, 1(1): Doi:10.31579/2692-9406/005
Copyright: © 2020 Mohamed Hisham Aref. This is an open-access article distributed under the terms of the Creative Commons Attribution License, which permits unrestricted use, distribution, and reproduction in any medium, provided the original author and source are credited.
Received: 14 April 2020 | Accepted: 30 April 2020 | Published: 06 May 2020
Keywords: liver tumor; hyperspectral imaging; rf thermal ablation; k-mean clustering algorithm, tissue thermal depth
Significance: Hepatocellular carcinoma (HCC) is considered as worldwide health problem with a poor diagnosis due to limited detection techniques. Thermal ablation is the dominant modality to treat liver tumors for discriminating patients who are not allowed to have surgical intervention. Knowing that, observing or foreseeing the size of the subsequent tissue putrefaction during the Thermal Ablation techniques is a difficult undertaking.
Aim: To examine the impacts of ablation zone volume following Radiofrequency ablation (RFA) of an ex-vivo bovine liver to correlate the impacts of thermal ablation with target organ perfusion; by exploiting the unique properties of Hyperspectral Imaging (HSI).where, Vessels may source cooling in the adjacent tumor target (heat‑sink‑effect) with risk of cancer recurrence and the infiltration profundity estimations consider the lessening of the tissue.
Materials and Methods: Radiofrequency ablation was perfused on ex-vivo bovine livers at peripheral and central‑vessel‑adjacent locations, and monitored by HSI with a spectral range from 400 to 1000 nm. The system contains k-means clustering (K=8) algorithms combining spectral and spatial information. Labeled spectral signatures datasets were used as training data. Statistical analysis (10 samples) was computed to calculate the highest variance between six spectral images for determining the optimum wavelength for discrimination between the affected regions after thermal ablation (normal, thermal, and ablated liver tissue regions).
Results: The change of the optical properties of ex-vivo liver tissues provides different responses to light transmission, scattering, absorption and particularly the reflection over the spectrum range. The spectral reflectance signatures were measured and evaluated using designed K-mean clustering algorithm after image reconstructed. Trials showed that spectral region 650~650 nm was proposed as optimum spectral range. Where, these results successfully distinguishes the Surface Thermal ablation region (x,y-axis),as well as the Thermal penetration Depth (z-axis) for Tissue characterization and Contour mapping for the unwanted thermal damage.
Conclusions: Hyperspectral imaging is a powerful tool in real-time monitoring the thermal ablation and more accurate compared to the conventional imaging modality.
Liver malignancy is the 5th most common tumor and the 2nd most prominent reason for tumor-related passing around the world, and more than (800,000) deaths are accounted for globally every year [1], [2]. In Egypt, there has been a noteworthy increment in the extent of hepatocellular carcinoma (HCC) among interminable liver disease patients [3]. Hepatocellular carcinoma (HCC) is the most well-known essential dangerous tumor in the liver, particularly in patients with cirrhosis[4]. Confirmed patients with HCC follow a specific system for stage classifier and best treatment opportunity, such as the Barcelona Clinic Liver Cancer (BCLC) stage system [5].
Liver successful transplantation is considered the best option for HCC treatment for eligible patients [2], [6], [7]. However, transplantation is constrained by the accessibility of liver contributors and by the available budget [8]. Another great restorative alternative for initial-phase HCC patients with the non-cirrhotic liver is hepatic resection[9]. Fractional hepatectomy gives shorter holding up times and practically identical 5-year endurance rates (60~70%) contrasted with transplantation [10].On the other hand, the number of colorectal metastases (CLM) patients qualified for resection is less than 20% because of incompatible tumor areas and worsened residual liver function [11].
Negligibly intrusive thermal ablation, including laser interstitial thermotherapy [12], radio-frequency Ablation (RFA) [13], microwave Ablation(MWA)[14], [15], and high-Intensity ultrasound (US) (interstitial [16], focused [17], and unfocused [18]) ablation. All these modalities is a significant treatment way to deal with unresectable essential and secondary liver tumors (e.g., HCC and CLM) [13], [18], [19].
Thermal ablation may likewise be utilized to help careful resection to diminish intraoperative blood loss and postoperative hospitalization [13]. While it is considered being the most fitting alternative track for HCC long-suffering patients who are unqualified for both transplantation and resection. This track is usually used for the patients who have tumor size ≤ 3 cm, in light of the Barcelona Clinic Liver Cancer (BCLC) classification framework [5], [13].
Even-though, RF ablation is more affordable, less obtrusive, and with lower difficulty rates than incomplete resection in early hepatocellular carcinoma (HCC) and small colorectal metastases [20], [21]. However, it is not the ideal modality due to the inability to monitor the thermal effect with the conventional image-guided techniques, such as the Computed Tomography (CT) and ultrasound due to the struggle of separation of feasible and destructed tissue and distinguishing proof of the tumor edges, as a result of tissue scarring and gas bubble fact which emerge during the thermal procedure [22],[23], [24].
Imaging modalities are vital for real-time observing of thermal tissue variations throughout laser interstitial thermotherapy, RFA, MWA, HIFU, or bulk thermal ablation [25], [26]. MRᶃ-HIFU has been utilized for observing and control of thermal removal utilizing real-time MR thermometry[27], [28]. Knowing that MRᶃ-HIFU escalations treatment therapy is expensive and difficult [29], [30]. USᶃ-HIFU is more convenient and low-cost, while its high edge rate, constant ability conceivably makes it increasingly equipped for ablating versatile organs[31], [32].
Recently, many researchers have developed several imaging methods to guarantee suitable removal of liver malignant and metastases utilizing non-intrusive or negligibly obtrusive systems with respect to the conventional excisional biopsy. Of these imaging techniques, infrared thermography monitoring [33], [34],contrast‑enhanced ultrasound [35], real‑time ultrasound elastography ,high resolution US [36], [37] and electrode vibration elastography[38].This exploratory investigation was the leading at the attainability of HSI observing in RFA .On the other side hyperspectral imaging (HSI) method provides a specific wavelengths (spectral image) across the electromagnetic spectrum as it collects spatial and spectral information for the specimen under investigation [39], [40].
Spectral imaging is otherwise called imaging spectroscopy, which introduces the innovation that incorporates conventional imaging and spectroscopy techniques to acquire both spatial and spectral data of an object [41]. It was at first described in the late 1980s for remote distinguishing of the Earth [42]. Spectral imaging can be separated into multispectral imaging, hyperspectral imaging (HSI), as per its unearthly goals, the number of groups, width, and continuity of groups[43], [44]. Multispectral imaging frameworks, for the most part, gather information in few and generally noncontiguous wide ghastly groups, regularly estimated in micrometers or several micrometers. These ghastly groups are chosen to gather power in explicitly characterized pieces of the range and advanced for specific classes of data generally clear in those groups. While HSI frameworks can gather many object groups [40], [41].
HSI is a rising imaging methodology, and promising outcomes have been appeared as for malignant growth identification in the brain. Where, two HS camera is used covering the spectral range of 400–1700 nm, the system is able in ~1 min to discriminate between normal and malignant tissue in the brain tissue thru neurosurgical procedures [45]. Study on gastric tumors in 10 human subjects. Where, the spectral monograms were obtained and evaluated in normal and Tumor tissue. Processing methods with the standard deviation of the spectral graph, support vector machine, and the 1st derivatives were recommended to improve and detect the Tumor regions. The 1st derivatives in spectral region between 1226~1251 nm and 1288~1370 nm were suggested as criteria that successfully discriminate between normal and Tumor tissue[46].
Moreover, in the HSI in medical applications, ultrasonic thermos-elastic emissions were produced in breast tissue by the inclusion of nanosecond laser pulses at 1064 nm generated by a Q-switched Nd: YAG laser. Where the differences in photoacoustic reaction signatures of normal and malignant breast tissue were found to be highly enhanced[47]. In the prostate tumor, the HSI framework was utilized to catch in-vivo pictures of rats influenced by human prostate tumors. The results upon 11 mice proved that the sensitivity and specificity of the HSI classification technique are 92.8% to 2.0% and 96.9% to 1.3%, respectively [48].
This pilot study demonstrates the objective of building and implementation a custom optical imaging system and associated K-mean clustering algorithm using to characterized and evaluate different thermal effects of investigated ex-vivo bovine liver samples. This non-invasive system can provide virtual information for a medical doctor, helping in early perception during surgery by improving tissue visibility and an early admonition to maintain a strategic distance from tissue fibrosis and thermal impact utilizing electrosurgical generator or any other Surgery/Thermal ablation modality [47][49].
Materials and Methods
In this sector, exploratory arrangement and techniques for a progression of examinations on controlled thermal ablation of ex-vivo Bovine liver tissue are talked about. In these analyses, where all the pieces of the framework and their interconnections are exhibited in Figure 1. Seven different elementscompose the system acquisition platform for tissue characterization (Hyperspectral camera / CCD microscopic camera / Thermal camera / RF generator / Light source / Computer & its Image processing software / Liver sample posed on the white optical board).
Experimental under test samples (Bovine Liver Tissue) A freshly cut out bovine liver was attained from a local abattoir in EGYPT and placed in ice-box with deionized saline, Liver tissue samples were cut with measurements (5 cm × 6 cm), Analysis were performed at room temperature 25 °C, with a normal liver temperature of 23°C~ 25°C estimated before every preliminary and stored in refrigerator up to –70°C.
Optical imaging system for liver sample ablation monitoring:
To capture the necessary images Hyperspectral (HS) Camera was utilized (Brand: Surface Optics –Model: SOC710) this model has spectral range (400 to 1000 nm), 5 nm spectral resolution, pushbroom (line‐scanning) and 10 degrees field of view. The camera incorporated with a lens (Schneider KREUZNACH XENOPLAN 1.9/35 CCTV-LENS 400 bis 1000nm). For each sample, the spectral cube image composed of 128 frames, and each frame represented a spectrum image of a specific wavelength.
Thermal Ablation Set-up:
Radiofrequency Generator (RF) (Brand: Bowa, Model: ARC303) was used to generate the necessary heat in the liver tissue simulating equivalent case as the surgical theatre for liver cancer thermal ablation and have been continuously monitored the temperature by the Non-Contact thermal camera (Brand: FLIR, Model: ETS 320), where the ground plate have been cut and customized by the sample size and area under the liver tissue and the active electrode fixed with articulating arm with a specific inserting depth (2 cm) inside the tissue, where the sample dimension is (5×6 cm).
The experimental setup have been repeated by changing the RF Tip to measure initially the Surface Thermal (x,y axis) Tissue characterization as illustrated in Figure 1-a,as well as to Monitor the Thermal Depth (z axis) for Tissue characterization thermal penetration depth evaluation in the (Z-axis) as shown in Figure 1-b.

HS cameras require solid and exact brightening of the scene to be caught so as to stay away from outside obstructions created by the ecological light where the catch is being performed. The enlightenment framework utilized right now dependent on a polychromatic light (Brand: Derungs –Model: 20P SX -20 Watt) this model has spectral range (348 to 820 nm). This sort of light is reasonable for HS applications because of the high homogeneity of its range over the whole spectral range.
Several experiments were repeated and implemented to reach the desired results needed to execute the necessary image analysis and signal processing upon the various sources of captured images. Revealed the RGB images with the CCD microscopic camera (500X) to monitor and record the thermal ablation process, additionally the thermal images by thermal camera (FLIR -Model: ETS 320) for monitoring the elevation of the thermal effect in the sample tissue during the ablation, supplementary to be used in image verification with our algorithm.
HSI sensors produce a three-dimensional (3D) information structure, called HS block, where the spatial data is contained in the initial two measurements, while the third measurement incorporates the spectral data [50], [51]. In a hyperspectral picture, every pixel has an arrangement of reflectance in various spectral frequencies that can show the spectral outline of that pixel [45]. On one hand, every pixel of the HS picture contains a full otherworldly mark of length equivalent to the quantity of spectral groups of the HS cube. On the other hand, a dark scale picture of the caught scene can be gotten utilizing any of the unearthly groups that shows the spatial data gave by the picture sensor at a specific frequency[52][50].
Hyperspectral picture conquering:
Six individual arrangements of hyperspectral pictures were gotten for each liver sample, each arrangement consisting of a (5 cm × 6 cm) of the liver sample arrangement on a lined tray. Line-scan images were captured for exposure times of 6 msec at 3.12 nm intervals, and each set consisted of 600 line scans corresponding to 600 × 502 pixels per spectral band. The hyperspectral images were composed of a total of 128 spectral bands in the range from approximate 379 to 1050 nm, incorporated with a lens with range (400 to 100 nm).
The drove light enlightens the liver tissue region of interest (ROI) and the camera target focal point gathers the radiation from the tissue and shows a picture on the passage way cut plane. The cut decides the field of imaging in spatial ways. The radiation from the cut is anticipated to the prism-grating; along these lines the bearing of engendering of the radiation changes on its wavelength. Each purpose of the tissue is represented on the lattice detector by an arrangement of monochromatic focuses that makes a consistent range toward the unearthly hub.
Records standardization:
The issue with the spectral non-consistency of the light system and the impact of the dim current are wiped out through standardization of the picture information to discover the standardized reflectance of the sample. A standard reference white board was set in the area of imaging and its information were used as the white reference[44], [51].This white reference is a standard reflectance that ought to be utilized for information standardization which shows most extreme standard reflectance in every frequency and in catching time temperature. The reflectance from the board gives a gauge of the occurrence light on the organs at every frequency and standardizes the temperature changes, which is utilized in standardization of the range. The dull current was caught by keeping the camera shade shut. At that point the information was standardized to locate a relative reflectance, as clarified in equation (1):
RFλ=Rcrudeλ-RblackλRwhiteλ-Rblackλ
(1)
Where RFλthe determined relative reflectance esteem is for every Wavelength,Rcrudeλ

is crude information brilliance estimation of a given pixel,Rblackλ

and Rwhiteλ

are, correspondingly, the dull current and the white board brilliance obtained for each line and otherworldly band of the sensor.
Spectral mapping and Acquisition:
The captured HSI cube is analyzed upon the 128 frames regarding the spectral range to select the optimum contrast wavelength, after The selective image at wavelength 900 nm have been normalized, then applying moving average filter with kernel value =10, afterward K-mean clustering up to 8-clusters for the contour display of the ablation and thermal regions and color mapping to the sample tissue, finally overlay of the images to produce the final algorithm for the thermal detection to the sample.
Conversion of the hyperspectral image to the RGB image segmentation by normalization of the value of R, G and B in the range of [0, 1],as more explained with its conditions in equations (2-7), lastly these values is multiplied by 255 (8-bit conversion)[53].
n=N×π 180

(2); M=m 100

(3); i=I 255

(4)
x=i ×(1-m)

(5);y=i×1+s×cos(n)cos(π3-n)

(6)
z=3i-(x+y)

(7)
If n≤2π3 then R=y;G=z and B=x
If 2π3≤n<4π3 then n=n-2π3; R=x ;G=y and B=z

Then, applying the moving average filter, likewise well-known as arithmetic mean filter at kernel value 10 for noise removal and image enhancement [54].
fx,y=1hn+k,L∈W∞φk,L
(8)
Where ‘φ’ is the noisy image, fx,y

is the restored image, and ‘k’ and ‘L’ are the row and column coordinates respectively, within a window ‘W’ of size ‘h×n’ where the operation takes place.
Next, applying the K-mean clustering (KMC) up to 8-clusters with variable threshold value from 0.2 up to 0.9 for variable thermal display, k-means is one of the least difficult unsupervised learning algorithms that take care of the clustering problem. We can formulate a general equation for the clustering algorithm; we can define the center-based clustering. Where variables define as N=ni…nj

is the set of (ń) data points to be clustered in the d-dimensional, S=si...sj

is the set of (Ƙ) center points in the d-dimensional. The membership function Msjni

describes the proportion of the data set ni that related to the centroid sj with limitation Msjni≥0

and jƘMsjni=1

.A weight function ŵ=ni

demonstrated how much effects data set ni in recalculation the new center with limitationŵ=ni≥ 0.
We can define the general model for the center-based clustering steps, as follows:
sj= i=1ńMsjniŵ=ninii=1ńMsjniŵ=ni

(9)
K-mean clustering (KMC) algorithm improves is:
KMCN,S=i=1n j∈{1…K}min ni-sj2
(10)
This demonstrable function in equation (10) provides an algorithm which reduces the within-cluster variance.
x+an=k=0nnkxkan-k

(11)
The weight and membership functions concerning KMC are: Msjni
=1 ;if x=argminjni-sj20 ; otherwise
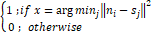
(12)
wKMCni=1

(13)
Regarding the hyperspectral image justifications, each point in the liver tissue has a succession of relative reflectance in various wavelengths that makes the spectrum outline or unearthly mark of a point. The reflectance spectra of the pixels made out of thermal and ablated zones of a liver tissue surface were separated and used to compute a normal reflectance range. The degree of the thermal effect was divided into three levels (ablated, thermal influenced, and typical tissues), where these spectrum outlines have been assessed to discover a distinction between them in the tissue.
Capturing the images with the Hyperspectral camera and processing the image before and after thermal ablation. Image normalization, moving average filter and K-mean clustering were utilized as channels to upgrade the thermal and ablated district in images caught with the hyperspectral camera. The capturing time for each image is about 5 ~ 12 sec and calculation time is < 20-sec using DADiSP/SE software (DSP Development Corporation,6.7 NI student edition B02, 2017) on a computer with processor Intel core i7 @1.8GHz with a 16 GB RAM. A conventional philosophy for target the identification and execution assessment was applied. The edges were balanced so as to expand the ablated recognition to guarantee identification of all the thermal /ablated districts. The exhibition was assessed utilizing the nature of discovery regarding the pathology.
After ablation, each sample was captured with the Hyperspectral camera, CCD microscopic camera (500X), and the thermal camera respectively thru several positions and at the same time for data recording purposes. Next, the liver sample was scanned at 1200 dpi to produce a high-resolution image to be used in image processing. Consequently, splitting it from the point of thermal ablation to explore more overall information about ablation and affected lateral cells to compare it with the captured Hyperspectral data. Thermal ablation continuously captured by a thermal camera for temperature monitoring, as shown in Figure 2.

The captured image of the ablation zone in ex vivo bovine tissue have been scanned at 1200 dpi for high image resolution shown in Figure 3 to compare it with the contour mapping analysis of the system algorithm to differentiate the unwanted thermal damage that was produced by heat conduction from the ablation tool, where heat conduction from the hot ablation zone along the ablation tool shaft have been more clearly appeared in the cross section View for the liver tissue and the penetration depth is shown by ablation tool tip which is approximately 2 cm long. Right and left piece for the bottom and top piece respectively in Figure 3-e.

The imaging method utilized with this camera is a pushbroom scanner; the cut passageway restricts the imaging field. By moving the camera between consequent pictures, inevitably all locales and wavelengths of the item are caught [52]. By reproducing the resulting pictures, a monochromatic unearthly picture for every wavelength can be developed, demonstrating the role of the wavelength to Spectacles or conceal specific information.
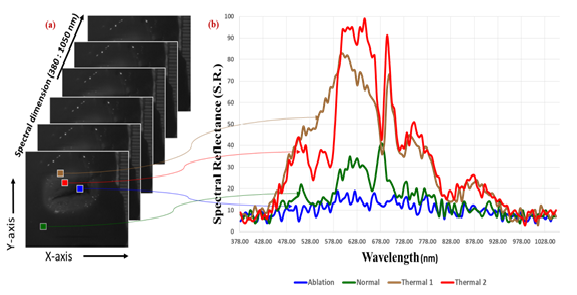
The deliberate optical spectra of biological tissues from 400 to 1000 nm spread the noticeable and can be separated at the atomic level, which extraordinarily adds to the reflectance esteems estimated in specific reaches. The test was performed utilizing the ex-vivo bovine liver tissue, where captured HSI is scanned and segmented, selecting specific points to measure the diffuse reflectance of the ablation region and two different positions around it for measuring the thermal effect with respect to the normal tissue, as illustrated in Figure 4-a.
These signals were drawn in the graph illustrating the unique spectral signatures of the normal, ablated and thermal regions, as demonstrated in Figure 4-b.the spectral reflectance between the normal signal (Green solid line) and the ablation region (Blue solid line) is more identified in wavelength ≥ 600 nm. However, to identify between the normal (Green solid line) and thermally affected tissue (Brown and Red solid line) it was more recognized in wavelength ≥ 500 nm.
we had used these spectral signatures as a guide for selecting the optimum spectral images which can be discriminate between the Four regions (Normal, Thermal#1, Thermal#2 and Ablation), to reduce the time of image processing for 128 frames to be only five spectral images starting from 500 nm up to 650 nm.
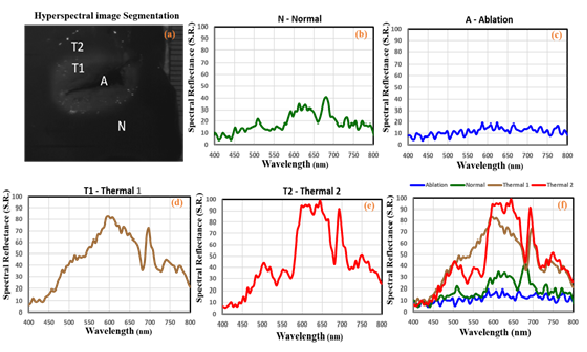
The Captured spectral images of Bovine liver tissue after thermal ablation have been analysis and processed at various wavelengths to differentiate the pixel reflectance of the liver tissue. Spectral images within 400~800 nm addressed the discrimination between the ablated region, the normal region and the thermal effect degree on the liver tissue. The spectral image at wavelength range 600 ~ 650 nm is more distinguishable for the Thermal / Ablated zones, as previously clarified in Figure 4-b and more identified in the worksheet of Figure 5.
The various wavelengths in nanometers and the vertical hub of the demonstrating HSI segmentation where standardized reflectance of the liver tissue utilizing hyperspectral camera; the signal reflectance of the normal tissue is coded with (N) and plotted in Figure5-b; the signal reflectance of the Ablation Region is coded with (A) and plotted in Figure 5-c; the signal reflectance of Thermal #1 and Thermal#2 Regions is coded with (T1) and (T2) respectively plotted in Figure 5-c,e. According to the analysis of the signature signals in Figure 5-f which highlight that it’s clearly identifying the thermal and ablated regions more at the wavelength region (600 ~ 650 nm).
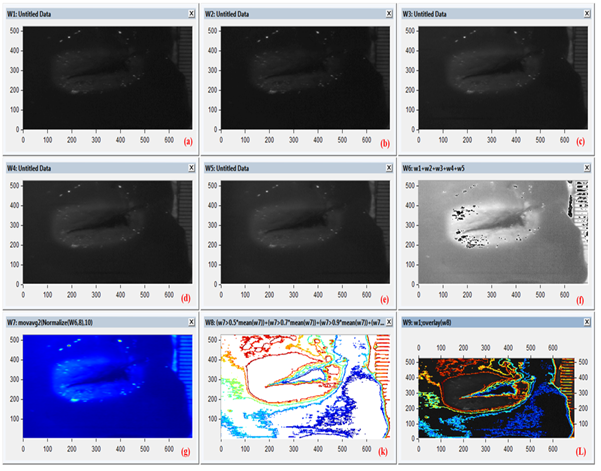
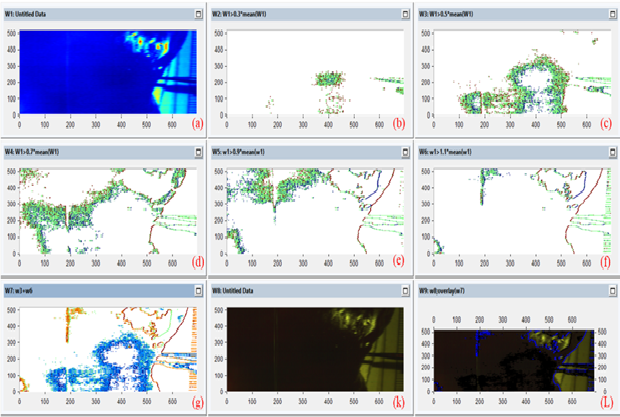
The captured images of five spectral images starting from 500 nm up to 650 nm of the liver sample utilizing hyperspectral camera have been segmented for more image data, as shown in Figure 6-f. Then, applying normalization and Moving average filter (K=10) for noise removing.Finally, perform the Contour mapping with the K-mean image clustering (K=8) illuminating the thermal region and overlaying the contour mapping according to the threshold value over the original HSI to distinguish the selective surface thermal region in the liver sample for the surgeon, as illustrated in Figure 6-k and L respectively.
The experimental trails results that the Surface Thermal (x,y axis) Tissue characterization could be identified by the HS imaging with more details versus the visual inspection as illustrated in Figure 6,eventhough the thermal penetration depth evaluation in the (Z-axis) could not be visually identified but with the HS imaging it was clearly identified as shown in Figure 7.
Thermal ablation is the dominant modalities for ablative treatment of un-resection liver tumors, where monitoring the ablation process with the right image‑guided inclusion of terminals is vital to accomplish a fruitful removal of tumors with minimum thermal damage of liver [34]–[37]. The removal procedure is routinely observed with computed tomography, or b-mode sonography to guarantee fruitful tumor removal with fitting wellbeing edges; however, tissue scarring or gas bubble development may hamper translation of sonographic pictures[20], [21], [33], [35].
Other imaging modalities like infrared thermography [33], [34], contrast‑enhanced ultrasound [35], real‑time ultrasound elastography, high-resolution US [36], [37], and electrode vibration elastography [38], which have been inspected to screen the ablation procedure. Anyway, all checking modalities have their issues to give an exact proclamation about the achievement of the ablation. On the other side hyperspectral imaging (HSI) method provides specific wavelengths (spectral image) across the electromagnetic spectrum as it collects spatial and spectral information for the specimen under investigation[39], [40].
Because of considerable between quiet spectral changeability which in turn is reflected on the ex-vivo living tissue samples the developed algorithm encountered two main challenges: the high conditionality and the predetermined number of samples. Finally, the utilization of high spectral resolution HS cameras for thermal tissue examination permits analysts to concentrate in detail the optical properties of the tissues, distinguishing the most significant spectral diverts that are engaged with a specific application. The utilization of high spatial resolution HS cameras allows the examination of tests by joining the spectral and the morphological properties of the tissue, as illustrated in Figure 4 and Figure 5, respectively.
The work introduced in this paper with the objective of building up a custom optical imaging system and associated K-mean clustering algorithm to characterize and evaluate different thermal effects of the investigated ex-vivo beef liver sample before and after Radiofrequency ablation (RFA). The results demonstrated that the optimum wavelength range (600~650 nm) differentiated between the normal region, thermal, and ablated regions of the investigated samples.
However, Hyperspectral imaging is a powerful tool in monitoring the thermal ablation and more accurate compared to the conventional imaging modality, but it is very expensive regarding the commercial CCD camera and it can`t work in real-time as the spectral cube need to be analyzed for the 128 frames and consume more time for image processing, and to avoid that topic we had to discriminate the optimum wavelength (600~650 nm), which decrease the time consuming and provide precise information to demonstrate significant monitoring of the ablation process to accomplish a fruitful ablation of tumors with minimum thermal damage of liver..
Our study was limited by ex-vivo liver tissue utilizing HS camera; further investigations will be carried out in the future work for validation using commercial CCD camera attached with the optical filter (720 nm) and several types of tissues with different properties.
The authors declare no conflict of interest and Stated that they have no competing interest. There are No funders and No one had any role in the design of the study; in the collection, analyses, or interpretation of data; in the writing of the manuscript, or in the decision to publish the results .This research did not receive any specific grant from funding agencies in the public, commercial, or not-for-profit sectors.
Author Contributions:
Dear Editorial Team, Clinical Medical Reviews and Reports. My experience with the journal was highly positive. The peer-review process was rigorous, constructive, and completed in a timely manner. The reviewers provided valuable comments that helped improve the quality and clarity of our manuscript. The editorial office was professional, responsive, and supportive throughout all stages of the publication process. Communication was clear and efficient, and any questions were addressed promptly. Overall, I found the journal to maintain high scientific standards and an excellent publication workflow. I would be pleased to consider submitting future work to this journal. Best wishes from, Elena Popa.

It was my pleasure to submit my testimonial concerning the Reviewer Board of our Scientific Journal “Brain and Neurological Disorders”. The Reviewers focused on some modifications and their contribution was helpful. The ladies of our Editorial Office were also supported my efforts. It was my honor to have such a co-operation and I am looking forward for more collaboration.

Dear Grace Pierce, Editorial Coordinator of Journal of Clinical Research and Reports, Thank you for the speedy and efficient peer review process. I appreciate the fact that your peer reviewers do not take months to respond like with some other journals. I would also like to thank the editorial office for responding quickly to my questions. It is an excellent journal. I plan to submit more manuscripts in the future. Best wishes from, Robert W. McGee

Dear Grace Pierce, Editorial Coordinator of Journal of Clinical Research and Reports, Working with you and your team on our recent publication in JCRR has been a truly wonderful and enjoyable experience. The responses were prompt, and the reviewers were patient, constructive, and highly professional. One reviewer in particular gave me the feeling that a professor was carefully reading and commenting on my coursework, which was deeply touching. The entire process was straightforward and hassle‑free, with no tedious online forms to complete. I highly recommend this journal. Best wishes from, DR Aibing Rao, Head of R&D

I Appreciate the Opportunity to Share my Experience with the Journal of Clinical Research and Reports. The peer review process was timely and constructive, and the feedback provided helped improve the quality of our manuscript. The editorial office was professional, responsive, and supportive throughout the process, ensuring smooth communication and efficient handling of the submission. Overall, it was a positive experience collaborating with your team.

Dear Mercy Grace, Editorial Coordinator of Obstetrics Gynecology and Reproductive Sciences, We would like to express our gratitude for your help at all stages of publishing and editing the article. The editors of the magazine answer all the necessary questions and help at every stage. We will definitely continue to cooperate and publish other works in the Obstetrics Gynecology and Reproductive Sciences! Best wishes from, Alla Konstantinovna Politova,
