
Case Report | DOI: https://doi.org/10.31579/2692-9759/113
Senior Registrar, Department of Cardiology, C.M.C Vellore
*Corresponding Author: Amit Mandal, Senior Registrar, Department of Cardiology, C.M.C Vellore
Citation: Amit Mandal, (2024), South African flag sign: A Red Flag in ECG, Cardiology Research and Reports. 6(3); DOI:10.31579/2692-9759/113
Copyright: © 2024, Amit Mandal. This is an open-access article distributed under the terms of the Creative Commons Attribution License, which permits unrestricted use, distribution, and reproduction in any medium, provided the original author and source are credited.
Received: 28 March 2024 | Accepted: 08 April 2024 | Published: 19 April 2024
Keywords: coronary artery; cardiac syndrome X; pathological tortuosity; hemodynamic significance; method
A method is developed to allow cardiologists to find changes in the blood flow rate in larger coronary arteries, caused by the appearance of their pathological tortuosity, and a hemodynamic significance of those changes based on the data taken from the appropriate coronarographies only. This method is based on replacement of blood flows in the originally healthy and subsequently pathologically tortuous artery with the corresponding averaged ones, and subsequent calculation of flow characteristics of interest in terms of the corresponding averaged flow characteristics. It allows one not to take account of a number of identical factors for the originally healthy and subsequently pathologically tortuous segment of the investigated artery, and gives one the possibility to determine the flow parameters of concern at any time after carrying out a coronarography. In addition, it is not associated with solving complicated technical problems, and does not require special facility to be used, special professional training and significant financial and temporal expenses. The method was successfully tested in-vitro and then applied to appropriate patients. It was found that the hemodynamic significance of the tortuosity generally increases/decreases as the number of the tortuosity arcs increases/decreases. Also, strong correlation between fundamental geometric and hemodynamic characteristics of the tortuosity and basic clinical indicators of the corresponding patients was established. This suggests a strong independent influence of the tortuosity on the clinical symptoms of the corresponding patients. The critical values for the number of the tortuosity arcs, the relative blood flow rate loss and the rate of angina
The electrocardiogram (ECG) is an important diagnostic test which provides crucial information. It is very helpful especially in evaluating patients with suspected acute coronary syndromes (ACS) and can reliably predict culprit artery. It can also potentially estimate the amount of jeopardized myocardium.
South African flag pattern is an unusual pattern that can occur on an electrocardiogram (ECG). High lateral ST elevation MI is associated with a pattern of ST elevation caused by acute occlusion of the first diagonal branch of the left anterior descending coronary artery (LAD-D1). With the 4×3 display of the 12-lead ECG, the location of the most impressive ST deviations resembles the shape of the South African flag:(1,2)
• ST Elevation: Lead I, aVL, V2.
• ST Depression: Lead III (and inferior leads)
Very often, high lateral infarctions (STEMI) are not diagnosed on time due to the non-contiguous nature of ST-segment elevation on the electrocardiogram (ECG).
We report a case of 62 years old gentleman who presented with high lateral wall MI with ST elevation in Lead I, aVL, V2 and ST depression in Lead III. He was subsequently diagnosed with multivessel disease with acute occlusion of first diagonal (D1).
A 55‐year‐old man with a history of smoking was admitted to the emergency department for acute severe chest pain for 4 hours duration. He was admitted to the chest pain unit (CPU) with acute coronary syndrome. After admission, his myocardial enzymes were urgently examined. These showed that TnT was 214 pg/mL, creatine kinase MB (CKMB) was 5.5 ng/mL, potassium was 3.5 mmol/L, and he had hyperlipidaemia. The ECG showed ST-segment elevation in lead I, aVL, and V2 with ST-segment depression in lead III (Figure 1)

Figure 1: ECG showed ST-segment elevation in lead I, aVL, and V2 (Red arrow) with ST-segment depression in lead III (Blue arrow)
His ECG pattern was suggestive of ‘South African flag sign’ which indicates occlusion of the D1 artery.
After considering a diagnosis of acute myocardial infarction, he was aspirin and clopidogrel were given. The patient’s family was informed and after taking consent he was taken to the catheterization laboratory. Emergency coronary artery angiography (CAG) revealed minor disease in proximal LAD with acute thrombotic D1 occlusion (culprit vessel) and mid RCA having diffuse disease. (Figure2 A,2B).

Figure 2A and 2B: RAO Caudal (2A) and LAO caudal (2B) view in CAG showing occlusion of the D1 branch
After consulting the patient’s family Percutaneous Old Balloon Angioplasty (POBA) to D1 was performed. Stenting was not done since it was a small calibre vessel. A repeat angiography showed that the thrombolysis in myocardial infarction (TIMI) blood flow in D1 and the distal anterior descending artery was grade three (Figure3).
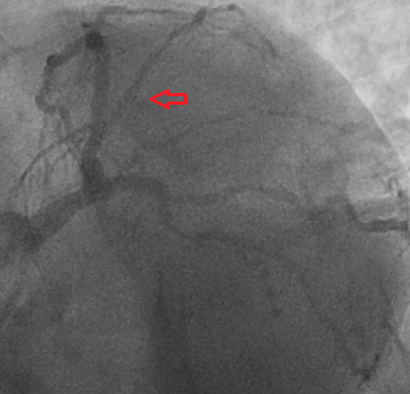
Figure 3: Post POBA, TIMI 3 blood flow in D1 and the distal anterior descending artery
Transthoracic echocardiography confirmed moderate left ventricular systolic dysfunction with regional wall motion abnormalities, hypokinesia, supplied
by the D1. The patient was treated with evidence-based preventative and heart failure pharmacotherapy and was discharged after 48 hours.
A high lateral myocardial infarction (HLMI) can often be missed due to non-contiguous ST elevation on the electrocardiogram (ECG) (1). The pattern of ST-segment elevation in lead I, aVL, and V2 with ST-segment depression in lead III is considered a sign of acute occlusion of the D1 branch of the left anterior descending coronary or HLMI, also known as the South African Flag sign.(3) The first diagonal artery (D1) supplies a part of the anterior wall of the left ventricle (LV) and lesser its basal anterolateral areas. High lateral myocardial infarction caused by D1 occlusion projects the ST-segment vector toward I, aVL, and V2, and away from III (Fig 4) With the 12-lead ECG displayed in the conventional 3×4 landscape format, this subsequent characteristic pattern of ST-deviation in I, aVL, III, and V2 resembling the pattern of the green stripe of the South African flag. (Fig 5)
The STE in 2 non-contiguous leads, aVL and V2, was previously described as associated with occlusion of the D1 branch. (4,5) In 2015, Durant et al reported an ECG pattern of STE in leads I, aVL, and V2, with STD in the inferior leads being associated with occlusion of the D1 artery (2). Later, Littman coined the term “South African flag sign” as a visual mnemonic. (1)
Evidence regarding this ECG pattern is scarce. Since lead V2 is non-contiguous with leads I and aVL, ST-elevation in these leads can sometimes be missed, and the ECG will be misinterpreted as lateral wall myocardial infarction, which is caused by occlusion of the left circumflex branch of the left coronary artery. This can mislead the cardiologist regarding planning during coronary angiography as more focus will be on the left circumflex artery rather than the D1-LAD. Thus, a careful analysis of a 12-lead ECG is essential and helps during planning for the subsequent coronary angiography.
South African flag sign indicates occlusion of the D1 artery. Identification of the sign of the South African flag on the ECG can improve the timely diagnosis of high lateral myocardial infarctions that are not diagnosed in time due to the non-contiguous nature of ST segment elevation on the electrocardiogram. Therefore, immediate recognition of these ECG changes is essential for referring patients to urgent reperfusion therapy and may have important prognostic implications.
Dear Editorial Team, Clinical Medical Reviews and Reports. My experience with the journal was highly positive. The peer-review process was rigorous, constructive, and completed in a timely manner. The reviewers provided valuable comments that helped improve the quality and clarity of our manuscript. The editorial office was professional, responsive, and supportive throughout all stages of the publication process. Communication was clear and efficient, and any questions were addressed promptly. Overall, I found the journal to maintain high scientific standards and an excellent publication workflow. I would be pleased to consider submitting future work to this journal. Best wishes from, Elena Popa.

It was my pleasure to submit my testimonial concerning the Reviewer Board of our Scientific Journal “Brain and Neurological Disorders”. The Reviewers focused on some modifications and their contribution was helpful. The ladies of our Editorial Office were also supported my efforts. It was my honor to have such a co-operation and I am looking forward for more collaboration.

Dear Grace Pierce, Editorial Coordinator of Journal of Clinical Research and Reports, Thank you for the speedy and efficient peer review process. I appreciate the fact that your peer reviewers do not take months to respond like with some other journals. I would also like to thank the editorial office for responding quickly to my questions. It is an excellent journal. I plan to submit more manuscripts in the future. Best wishes from, Robert W. McGee

Dear Grace Pierce, Editorial Coordinator of Journal of Clinical Research and Reports, Working with you and your team on our recent publication in JCRR has been a truly wonderful and enjoyable experience. The responses were prompt, and the reviewers were patient, constructive, and highly professional. One reviewer in particular gave me the feeling that a professor was carefully reading and commenting on my coursework, which was deeply touching. The entire process was straightforward and hassle‑free, with no tedious online forms to complete. I highly recommend this journal. Best wishes from, DR Aibing Rao, Head of R&D

I Appreciate the Opportunity to Share my Experience with the Journal of Clinical Research and Reports. The peer review process was timely and constructive, and the feedback provided helped improve the quality of our manuscript. The editorial office was professional, responsive, and supportive throughout the process, ensuring smooth communication and efficient handling of the submission. Overall, it was a positive experience collaborating with your team.

Dear Mercy Grace, Editorial Coordinator of Obstetrics Gynecology and Reproductive Sciences, We would like to express our gratitude for your help at all stages of publishing and editing the article. The editors of the magazine answer all the necessary questions and help at every stage. We will definitely continue to cooperate and publish other works in the Obstetrics Gynecology and Reproductive Sciences! Best wishes from, Alla Konstantinovna Politova,
