
Research Article | DOI: https://doi.org/10.31579/2690-4861/328
Senior Member, IEEE Professor and Principal, Computer Science Department, Lenora College of Engineering, India.
*Corresponding Author: Raja Sarath Kumar Boddu, Senior Member, IEEE Professor and Principal, Computer Science Department, Lenora College of Engineering, India.
Citation: Raja S. K. Boddu, (2023), SARS-CoV-2 Virion, Debacle Humane: An Analytical Approach, International Journal of Clinical Case Reports and Reviews, 14(3); DOI:10.31579/2690-4861/328
Copyright: © 2023, Raja Sarath Kumar Boddu. This is an open-access article distributed under the terms of the Creative Commons Attribution License, which permits unrestricted use, distribution, and reproduction in any medium, provided the original author and source are credited.
Received: 01 August 2023 | Accepted: 14 August 2023 | Published: 22 August 2023
Keywords: covid-19; machine learning; mortality; sars-cov-2; virion; vaccination
World Health Organization (WHO) declared the coronavirus diseases COVID-19 is pandemic, as the virus SARS-CoV2, which causes coronavirus diseases (COVID-19) and its variants has spread all over the world. This pandemic disease, COVID-19 is primarily described as an infectious disease-causing severe acute respiratory syndrome (SARS). Later it transforms into severe acute respiratory syndrome coronavirus 2 (SARS-CoV-2) virion variant. These virion variants have emerged across the globe with deceptively higher transmissibility and with immunity deteriorate capabilities. In this research paper, it is proposed to compare several ML algorithms to predict the COVID-19 mortality using the various countries data and choose the best performing algorithm as a predictive tool for decision-making. This study aimed to develop a mortality risk prediction for COVID-19 based on ML algorithms that utilize data.
COVID-19 pandemic is a worldwide epidemic. It is unfortune to recollect, but the fact is that 626,337,158 confirmed cases of COVID-19 have been witnessed, including 6,566,610 deaths globally as per WHO as per statistics as on 28, October 2022, its totally debacle the humane [1]. Further, as of 19 August 2022, a total of 12,814,704,622 vaccine doses have been administered globally [1]. This statement gives hope and immense pleasure with respect to vaccination statistics globally. Even then, the situation is becoming worse and worse. Millions of people diseased globally. Top ten highest deaths happened countries were listed in the table 1.
A. SARS-CoV-2 virion and its variants
Later days, the infectious disease-causing severe acute respiratory syndrome (SARS) transform herself into SARS-CoV-2 and further into various variants like Alpha, Beta, Gamma, Delta, Omicron (BA.1), Omicron (BA.2). Omicron (BA.4). Omicron (BA.5), Omicron (BA2.12.1), Omicron (BA2.75) and others. Figure 1 represents the SARS-CoV-2 variants in the selected 10 countries listed in table.1. The immunity of an Individual infected person of SARS-CoV-2 could be possible to estimate when the disease symptoms of a disease is known up to some extent.[2] The quantitative analysis of viral load, Ron Sender et.al estimated that each infected person carries viral load of SARS-CoV-2 bodily fluids up to 100 billion virions when infected, an equivalent mass of 0.10 mg approximately. It could be a mass of up to 10 kg. when estimated with global infected humane [3].
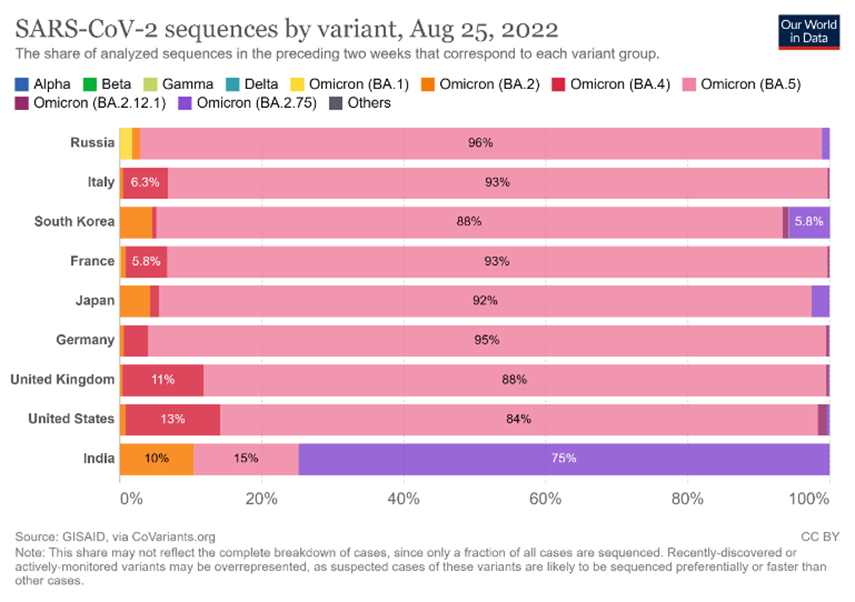
Figure 1: SARS-CoV-2 variants in the selected 10 countries as on 25th August, 2022
Actually, viruses are nucleoproteins and are non-cellular structures with infectious, genetic material. Virions are capsid encapsulated viruses with DNA or RNA molecules. The coronavirus is the cluster of related RNA (Ribo Nucleic Acid) viruses that is commonly found in birds and mammals [3]. It has both nucleic acid as well as protein layers.

Figure 2: Scientifically accurate atomic model of coronavirus (SARS-CoV-2). Each "ball" is an atom.
Machine Learning (ML) Algorithms are commonly used as alternative methods for classification and prediction and could be used as a potential solution for predicting mortality during COVID-19 globally.[4]
As covid-19 pandemic became nightmare, all countries would have been initiated and implemented counter measures such as lockdown, restrictions on movement, public and private conveyance and offices, airport, railways, roadways and all carriages in and out of every country placed underneath the quarantine, maintaining social distancing and physical isolation and repeatedly disinfection of public spaces and so on to prevent spreading COVID-19 on war basis as the healthcare systems have been collapsed in many of the countries pathetically. In addition to the above, people are advised to washing their hands thoroughly or use of sanitizer, preferably to stay home, mouth and nose covering with mask especially when coughing or sneezing and so on, to lessen the spreading of COVID-19 pandemic. On the other hand, this pandemic has also witnessed the drastic downfall of the economy across the world due to eccentric activities initiated by the several countries. In addition to this, the impermanence rate is increasing day by day and bluntly demanding an early response to diagnose and prevent the blowout of this uncurable disease. One of the critical aspects of spreading of COVID-19 is due to lack of specific clinical detection, medications and treatments, subsequently the situation has become distortion and terrifying worldwide.
| Country | Confirmed | Deaths | Case-fatality | Deaths/100k pop. |
| USA | 94,190,979 | 1,043,840 | 1.1% | 316.83 |
| India | 44,415,723 | 527,799 | 1.2% | 38.25 |
| France | 34,662,834 | 154,897 | 0.4% | 237.39 |
| Brazil | 34,368,909 | 683,397 | 2.0% | 321.51 |
| Germany | 32,041,350 | 147,104 | 0.5% | 176.90 |
| United Kingdom | 23,708,629 | 205,414 | 0.9% | 302.59 |
| South Korea | 23,026,960 | 26,618 | 0.1% | 51.92 |
| Italy | 21,806,509 | 175,347 | 0.8% | 290.01 |
| Russia | 19,123,501 | 376,301 | 2.0% | 257.86 |
| Japan | 18,531,986 | 39,047 | 0.2% | 30.87 |
Table 1: Top 10 countries- total confirmed, deaths, and recovered cases and mortality by country
Even though, the origin of the COVID-19 pandemic is struggling to handle it, fortunately, the scientific fraternity has changed the state of COVID-19 in all aspects from hopelessness to hope. Rigorous research has been initiated and done globally which has resulted in the evidence to breakdown on the unrestricted blowout of the COVID-19 pandemic by the development of precautionary trials including vaccines [4].

Figure 3: Confirmed COVID-19 cases, deaths, hospitals admissions, and patients in ICU per million people
The cumulative confirmed deaths during COVID-19[5] has been recorded officially.
This research paper is structured as follows: Section 1, introduction section stated with relevant basic information, facts and figures and data.; Next is the problem statement which states the problem and objective of the research methodology in Section 2. Section 3 is the proposed methodology which states the data, mortality statistics and technique used, architecture and software process flow. Section 4 describes the data, dataset, the steps of the empirical analysis and the discussion of the results; and Section 5 discusses this study’s limitations, conclusion where we have listed our findings and future developments.
Seven machine learning classification techniques are applied, Naive Bayes Classifier, J48 pruned tree Classifier, Bayes Network Classifier, JRIP, SVM, Random Forest and K-NN, to evaluate the dataset. Naive Bayes Classifier, is a subset of Bayesian theory for text classification which classifies the transferred data in a readable format. Naive Bayes classification algorithm discriminates against the dataset based on particular features or attributes. J48 Decision Tree, is an algorithm that produces a graphical tree, which is a frequently used for classification purposes. it uses a divide and conquer approach, which divides the instances into sub-range based on the values of the attributes. Bayes Network Classifier, is a compact, flexible and interpretable representation of a joint probability distribution [6]. These are ideal for taking an event that occurred and predicting the likelihood that any one of several possible known causes was the contributing factor. JRIP, it implements a propositional rule learner called as “Repeated Incremental Pruning to Produce Error Reduction” (RIPPER) and uses sequential covering algorithms for creating ordered rule lists. The algorithm goes through 4 stages: Growing a rule, Pruning, Optimization and Selection.in Weka, it's called JRIP. It's a basic incremental reduced-error pruning algorithm. Support Vector Machines (SVM), is a supervised learning method for classifying and predicting data. In the classification task, training and testing are involved with the data. Each instance contains the target values in training. SVM provides a set of supervised learning models which enables our present study to perform classification and regression tasks that gives accurate prediction [7]. Support vectors have the information points that lie closest to the decision surface which are also called as hyper planes. Random Forest (RF), the algorithm also produces a tree, but several trees will be generated from the values of random samples in the dataset, and the final result will be based on the results of the majority of the developed trees. An eventual improvement in accuracy thus resulted from such ensemble of trees in selecting the most suitable class. k-Nearest Neighbor’s (KNNs), are one of the best among the “simplest” supervised machine learning algorithms and have been well studied in the field of pattern recognition and a case-based learning method used to solve the classification and regression problem. It relies on labelled data to provide the correct output for unlabeled data.[8]
In classification technique, the training of dataset is supposed to be implemented first on the 7 different algorithms mentioned above and applied. Once the training process is completed next comes the performance evaluation phase which is very important as it helps to evaluate the model’s performance. The performance of each developed model was evaluated using sensitivity, specificity, accuracy, precision, and ROC of the performance metrics. The automation machine learning tool, Waikato Environment for Knowledge Analysis (WEKA) [9], has been used for data cleansing, pre-processing, feature extraction and classification of the dataset and to simulate the models.
Prior to modeling development stage, the selection criteria would be purely based on the related studies in the field and proper reviews has been made thoroughly, later, the mortality prediction model has been constructed based on these seven ML algorithms Naive Bayes, J48, Bayes Net, JRIP, SVM, Random Forest and K-NN.
A 10-fold cross-validation process system has been used for evaluating the performance for classification models. In 10-fold cross-validation process, the original samples are randomly partitioned into 10 sub-samples of about equal size. One of the 10 sub-samples was applied as the validation dataset for testing the models, and the remaining 9 sub-samples were applied as training datasets. The cross-validation method was then repeated 10 times with one of the 10 sub-samples applied sequentially for each validation. Finally, the validation results from ten experimental models are then mixed to render the performance metrics sensitivity, specificity, accuracy, precision, and ROC derived from testing only.
Mortality varies by time and location, and its measurement is affected by well-known biases that have been intensified during the COVID-19 pandemic. most affected by COVID-19 worldwide, the bars in the chart below show the number of deaths either per 100 confirmed cases or per 100,000 population. Countries at the top of this figure have the most deaths proportionally to their COVID-19 cases or population.[10]

Figure 4: Cumulative confirmed COVID-19 deaths, excess mortality
The diagonal lines on the chart Figure.5 correspond to different case fatality ratios. Countries falling on the uppermost lines have the highest observed case fatality ratios. Points with a black border correspond to the 20 most affected countries by COVID-19 worldwide, based on the number of deaths.
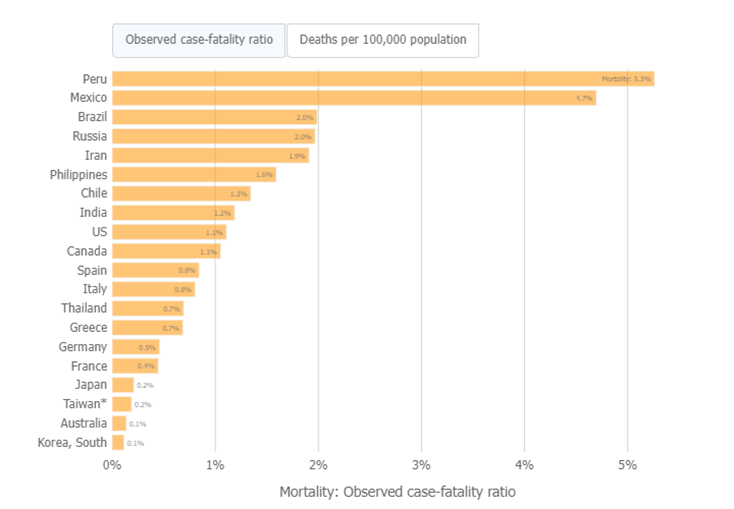
Figure 5: Mortality- Observed case-fatality ratio
The dataset, worldometer data, has been taken from Kaggle [11] is used for analysis and prediction of mortality during COVID-19. The dataset contains 16 features with 209 country records. These features lead Kaggle to the large utilized database for researchers globally as it provides features of the mortality in various countries, region-wise details, total cases, total deaths and the mortality rate. These are utilized in the present work to learn about infections and mortality progression.
The total number of instances are 209, which represents countries, while the number of attributes is 16 that represents country/region, continent, population, total cases, new cases, total deaths, new deaths, total recovered, new recovered, active cases, serious, critical, total Cases/1m pop, deaths/1m pop, total tests, tests/1m pop and WHO region. Once the dataset is loaded into the model its resultant plot matrix is shown in figure.6. The plot matrix shows the correlation within the attributes of the dataset here there two sets of numerical results, one on each axis, to see if there is a connection between them. The points will fall into a line or curve if the variables are connected. The more the points embrace the axis, the better the connection.
| Algorithm/ performance | Accuracy | Precision | Recall | F-Measure | ROC |
| Naive Bayes | 49.45% | 0.581 | 0.495 | 0.489 | 0.745 |
| Bayes Net | 76.08% | 0.733 | 0.761 | 0.745 | 0.935 |
| JRIP | 73.91% | 0.704 | 0.739 | 0.716 | 0.884 |
| SVM | 77.17% | 0.803 | 0.772 | 0.770 | 0.894 |
| Random Forest | 77.17% | 0.722 | 0.772 | 0.737 | 0.942 |
| K-NN | 76.08% | 0.762 | 0.761 | 0.756 | 0.858 |
| J48 | 78.80% | 0.772 | 0.788 | 0.778 | 0.887 |
Table 2: Major accuracy measures from the 10-fold cross-validation performance of the models built using the supervised machine learning algorithms.
As mentioned before the proposed methodology consist of 7 different classification algorithms Naive Bayes, J48, Bayes Net, JRIP, SVM, Random Forest and K-NN. When K-NN algorithm applied the total number of instances the number of correctly classified instances are 140 while the incorrect classified instances are 44 with the accuracy of 76.087% and with 0.762 and 0.761 of precision and recall respectively. Bayes Net algorithm the total no of instances the correctly classified instances are 140 with 44 incorrect classified instances, the accuracy was 49.4565% with precision and recall of 0.733 and 0.761 respectively. Naive Bayes algorithm the total no of instances the correctly classified instances are 91 with 93 incorrect classified instances, the accuracy was 68.53% with precision and recall of 0.581 and 0.495 respectively. Random Forest algorithm where from the total no of instances the correctly classified instances are 142 with 42 incorrect classified instances, the accuracy was 77.1739% with precision and recall of 0.722 and 0.772 respectively. SVM algorithm the total no of instances the correctly classified instances are 142 with 42 incorrect classified instances, the accuracy was 77.1739% with precision and recall of 0.803 and 0.772 respectively. When J48 algorithm applied the total number of instances the number of correctly classified instances are 145 while the incorrect classified instances are 39 with the accuracy of 78.8043% and with 0.772 and 0.788 of precision and recall respectively. When JRip algorithm applied the total number of instances the number of correctly classified instances are 136 while the incorrect classified instances are 48 with the accuracy of 73.913% and with 0.704 and 0.739 of precision and recall respectively [12] as per the results listed in the table 2.
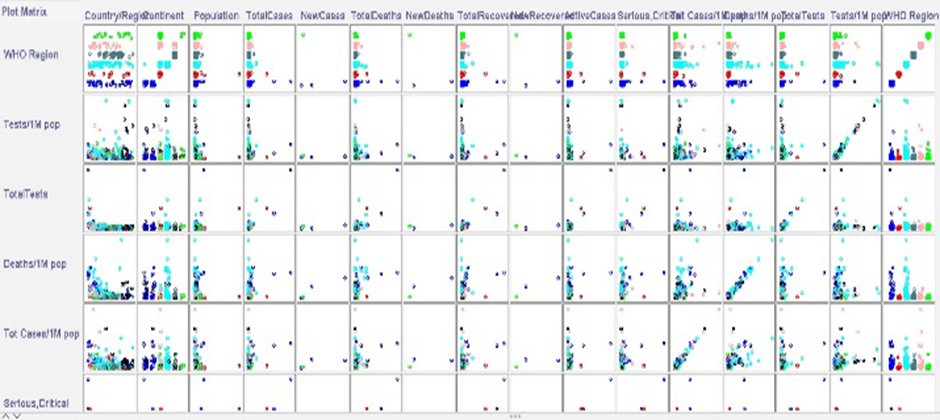
Figure 6: Plot Matrix of Proposed dataset.
This research paper aimed to develop and validate ML models based on the most relevant features in determining the risk of COVID-19 mortality. To achieve this, Naive Bayes Classifier, J48 pruned tree Classifier, Bayes Network Classifier, JRip, SVM, Random Forest and K-NN models were implemented using a dataset. The experimental results showed in table.2 that J48 had the best performance among the other seven ML techniques with the accuracy of 78.80%, precision of 77.20% and ROC around 88.70% is well. Different studies have been evaluating the application of ML techniques in predicting mortality in the patients with COVID-19. The selected features are used as inputs for developing ML-based models for severity, deterioration, and mortality of COVID-19 patient risk analysis. The proposed algorithms could predict the mortality with ROC, accuracy, precision, sensitivity, and specificity rates [13]. J48 ML algorithm performance has been reported as the best among all other ML algorithms tested.

Figure 7: COVID-19 cases, tests, positive rate and reproduction rate.
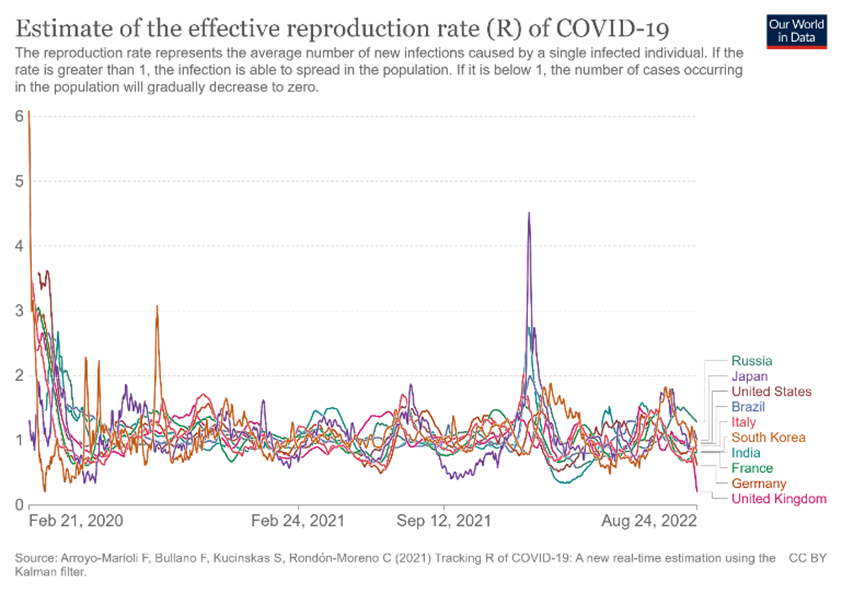
Figure 8: Estimate of The Effective Reproduction Rate (R) Of COVID-19.
This research paper helps us to serves the purpose of humans in predicting the disease that influences the disease spread abnormalities and high recovery rate. The COVID-19 pandemic has a tremendous impact on the life of people globally and the number of infected patients has considerably increased. Results have shown that the values are important to control the spread of infection. However, it is not described or evaluated which population groups should be vaccinated. it is assumed that the number of vaccines is sufficient. The J48 model performed best on classification accuracy among the other six ML algorithms. The proposed model can be suitably used for predicting the mortality risk of COVID-19.
The future work is to provide better significant results using several other machine learning models for finding estimates that helps the online datasets, clinicians, medical and governmental organizations to look forward for real time preparations ahead at this sort of pandemic disease in future. It is strongly considered that, with large and public databases, better ML models can be developed by researchers to detect and predict the COVID-19 accurately. In the future, the performance of our model will be enhanced if tested on more classification techniques at larger and different datasets.
I acknowledge the help of the public databases, worldometer_data.csv, (https://www.kaggle.com/datasets /imdevskp/corona-virus-report?select=worldometer_data.csv), and for graphical representation (https://www.worldometers.info/coronavirus/) for making available data which is used in this research paper.
I, Raja Sarath Kumar Boddu, consciously assure that for this manuscript, SARS-CoV-2 virion, debacle humane: An Analytical approach, the following is fulfilled:
The authors declare that they have no known competing financial interests or personal relationships that could have appeared to influence the work reported in this paper.
After couple of research papers published on corona virus during lockdown, I would like to know that how much total weight of the corona virion spread-out globally, even though it was weighted very little, might be nanogram. I searched it several research papers and I found it one research paper listed in references [3]. the fact is that one infected person carries an estimated 1 billion to 100 billion virions during peak infection, their total mass is no more than 0.1 mg and its diameter size from 20 nm to as large as 500 nm. Later, my enthusiastic research habituation, forced me to write a full research paper, then I started research to write a full paper on how the corona virion devastated the mankind, then I started writing the general introduction and the literature search and so on. It took much time to collect data. At this juncture, I would say, that I designed the study, performed data management, conducted the data analysis, wrote the first draft of the manuscript and up to final.
No funding received.
I collected dataset, world meter, from Kaggle [11] which contains full of COVID-19 information for the all nations. I applied the data on the 7 machine learning algorithms mentioned and evaluated with WEKA tool. Results were tabulated. Further, I found graphical user interface website, wroldometer.info for generating graphical view for the given data. I got some graphical views for the pictorial representation for better understanding to the readers. Some graphical representations were incorporated in this research paper.
Dear Editorial Team, Clinical Medical Reviews and Reports. My experience with the journal was highly positive. The peer-review process was rigorous, constructive, and completed in a timely manner. The reviewers provided valuable comments that helped improve the quality and clarity of our manuscript. The editorial office was professional, responsive, and supportive throughout all stages of the publication process. Communication was clear and efficient, and any questions were addressed promptly. Overall, I found the journal to maintain high scientific standards and an excellent publication workflow. I would be pleased to consider submitting future work to this journal. Best wishes from, Elena Popa.

It was my pleasure to submit my testimonial concerning the Reviewer Board of our Scientific Journal “Brain and Neurological Disorders”. The Reviewers focused on some modifications and their contribution was helpful. The ladies of our Editorial Office were also supported my efforts. It was my honor to have such a co-operation and I am looking forward for more collaboration.

Dear Grace Pierce, Editorial Coordinator of Journal of Clinical Research and Reports, Thank you for the speedy and efficient peer review process. I appreciate the fact that your peer reviewers do not take months to respond like with some other journals. I would also like to thank the editorial office for responding quickly to my questions. It is an excellent journal. I plan to submit more manuscripts in the future. Best wishes from, Robert W. McGee

Dear Grace Pierce, Editorial Coordinator of Journal of Clinical Research and Reports, Working with you and your team on our recent publication in JCRR has been a truly wonderful and enjoyable experience. The responses were prompt, and the reviewers were patient, constructive, and highly professional. One reviewer in particular gave me the feeling that a professor was carefully reading and commenting on my coursework, which was deeply touching. The entire process was straightforward and hassle‑free, with no tedious online forms to complete. I highly recommend this journal. Best wishes from, DR Aibing Rao, Head of R&D

I Appreciate the Opportunity to Share my Experience with the Journal of Clinical Research and Reports. The peer review process was timely and constructive, and the feedback provided helped improve the quality of our manuscript. The editorial office was professional, responsive, and supportive throughout the process, ensuring smooth communication and efficient handling of the submission. Overall, it was a positive experience collaborating with your team.

Dear Mercy Grace, Editorial Coordinator of Obstetrics Gynecology and Reproductive Sciences, We would like to express our gratitude for your help at all stages of publishing and editing the article. The editors of the magazine answer all the necessary questions and help at every stage. We will definitely continue to cooperate and publish other works in the Obstetrics Gynecology and Reproductive Sciences! Best wishes from, Alla Konstantinovna Politova,
