
Research Article | DOI: https://doi.org/10.31579/2690-4861/333
Dokuz Eylül University, Engineering Faculty, Department of Environmental Engineering, Tınaztepe Campus, 35160 Buca/Izmir, Turkey.
*Corresponding Author: Rukiye Öztekin, Dokuz Eylül University, Engineering Faculty, Department of Environmental Engineering, Tınaztepe Campus, 35160 Buca/Izmir, Turkey.
Citation: Öztekin R., Delia T. Sponza, (2023), Removal and Reuse of Collagen, Gelatine and Total Chromium from a Raw Leather Industry Wastewater using a Sequential Upflow Anaerobic Sludge Blanket Digestion (UASB) / Aerobic Forward Osmosis (FO) Reactor Configuration, International Journal of Clinical Case Reports and Reviews, 14(4); DOI:10.31579/2690-4861/333
Copyright: © 2023, Rukiye Öztekin. This is an open-access article distributed under the terms of the Creative Commons Attribution License, which permits unrestricted use, distribution, and reproduction in any medium, provided the original author and source are credited.
Received: 09 August 2023 | Accepted: 28 August 2023 | Published: 06 September 2023
Keywords: aerobic forward osmosis (FO) reactor; collagen; cost; gelatine; leather industry wastewater; methane gas; recovery; reuse; sequential anaerobic-aerobic forward osmosis reactor; total chromium; upflow anaerobic sludge blanket digestion (UASB) reactor
Collagen, gelatine and total chromium recovery was achieved from the sequential upflow anaerobic sludge blanket digestion (UASB) reactor sludge and concentrate of forward osmosis (FO) treating raw leather industry wastewater. It is aimed to reduce the cost of raw materials in leather industry process by reusing the collagen, gelatine and total chromium from the leather industry process during tanning. The recoveries of collagen and gelatine, total chromium was 78%, 80% and 27% respectively from the waste sludge in UASB process while the recoveries of these chemicals were 95%, 96% and 99% in the concentrate of FO. The maximum 85% CODtotal, 94% CODdissolved, 89% total-N, 88% total-P, 87% color, 87% total chrome (Cr+3 + Cr+6), 86% TOC, 87% SO3-2, 90% percentage of exchangeable sodium, 87% sodium adsorption rate (SAR), 84% sodium carbonate residue (RSC), 92% Cl-1, 92% SO4-2, 93% total salt, 88% B+3, 94% NO3-, 94% NH4+, 99% fecal coliform, 94% TSS, 93% EC25x106 removal efficiencies were measured to output anaerobic UABS reactor in leather industry wastewater. The maximum 99% CODtotal, 99% CODdissolved, 99% total-N, 99% total-P, 99% color, 99% total chrome (Cr+3 + Cr+6), 99% TOC, 99% SO3-2, 99% percentage of exchangeable sodium, 99% sodium adsorption rate (SAR), 99% sodium carbonate residue (RSC), 99% Cl-1, 99% SO4-2, 99% total salt, 99% B+3, 99% NO3-, 99% NH4+, 99% fecal coliform, 99% TSS, 99% EC25x106 removal efficiencies were observed to output aerobic FO reactor in leather industry wastewater. The costs of anaerobic UASB and aerobic FO processes are 0.57 euro and 0.145 euro, respectively, to treat 1 m3 leather industry wastewater. The cost of the consecutive total system is 0.715 euro for the treatment of 1m3 leather industry wastewater. The methane gas obtained in the UABS reactor is electrical energy and the electrical energy income was calculated as 1.9 euro from 1 m3 anaerobic waste sludge. The income to be obtained from the recovery of total chromium, collagen and gelatine from UABS and FO process is 2.75 Euro/l. As a result, the total cost decreases from 1.55 Euro/l to 0.715 Euro/l after aerobic FO process. The cost of these consecutive treatment processes is reduced by the production of methane gas and is increased the recovery of economic chemicals.
Tannery industry makes a significant contribution to the country’s export earnings as well as in environment pollution (Abebe, 2011). Approximately 31.4 million kilograms of skin are processed annually in Ethiopia (Behailu, 2015). The tanneries discharge 3000 liter of waste water, 100 kg of processed hides and the annual discharge of 9420 m3 (Strathmann et al., 2011). In chrome tanning, 276 chemicals and 14 heavy metals are used in process, which play major role for water pollution (Ramasamy and Naidu, 1998). They discharge large volumes of effluents, because except one or two process in the tannery industry, all the processes are wet processes and generate huge quantities of liquid wastes. The effluents are far from the desired level for acceptance due to heavy load of pollutants like chromium, chlorides, sodium, dissolved solids, biological oxygen demand (BOD), chemical oxygen demand (COD), nitrogen and suspended solids (SS) (Bosnic et al., 2000). Chromium has more importance in different metallurgical processing; chromium is traded in world market either as high-grade ore or intermediate like ferrochrome/charge chrome (Li et al., 2008). Problem of chromium disposal can be greatly minimized if recovery the chromium is made to the maximum extent possible. Numerous physical and chemical methods such as adsorption (Ha et al., 2018), sedimentation (Michalski et al., 2016), electrochemical processes (Deghles and Kurt, 2016; Jin et al., 2016), biological operations (Angelucci et al., 2017), cementation (Johnson et al., 2017), coagulation/flocculation (Mella et al., 2015), filtration and membrane processes (Bao et al., 2015; Koushkbaghi et al., 2018), chemical precipitation and solvent extraction (Nayl and Aly, 2015; Borra et al., 2017) have been employed for the minimization of the pollution level in wastewater only not for recovery. Few methods like membrane separation technology are used for treatment as well as recovery (Neoh et al., 2016). Membrane separation is a process in which a semi permeable membrane is used to retain species of low molecular weight and a pressure is applied as driving force to revert the solvent natural tendency of passing from a more diluted solution to another more concentrated one (Baker, 2008). The semi-permeable membrane is a thin film that is constructed by different materials and it is assembled in order to support a high Trans-membrane pressure. There are four types of industrial developed membrane separation processes which are microfiltration, ultrafiltration, reverse osmosis and electrodialysis (Subramani and Haribalaji, 2012). The range of application of the three pressure-driven membrane water separation processes: reverse osmosis, ultrafiltration and microfiltration Ultrafiltration and microfiltration are basically similar in that the mode of separation is molecular sieving through increasingly fine pores (Crawford et al., 2001). Although reverse osmosis, ultrafiltration and microfiltration are conceptually similar processes, the difference in pore diameter (or apparent pore diameter) produces dramatic differences in the way the membranes are used (Parameshwaran and Visvanathan, 1998). With this impression an attempted has been made for eco-friendly recovery and recycling technologies for the treatment of waste water before their disposal.
Ravindranath et al. (2015) researched in the present study, an innovative approach of treating limed fleshings after liquefaction (LLF) and tannery effluent (TE) together in an UASB reactor has been carried out for generation of green energy in the form of biogas with methane. The maximum COD removal efficiency of 75% with a methane yield of 0.29 m3/kg of COD removed at an optimum organic loading rate (OLR) of 12 kg/m3.day and hydraulic retention time (HRT) of 24 h was obtained (Ravindranath et al., (2015). This innovative approach of combined treatment resulted in an additional methane yield of 37.5% when compared to the methane yield from treatment of tannery wastewater alone in an UASB reactor. Certified emission reductions (CERs) generated have been estimated for combined treatment of TE and LLF in an UASB reactor by replacing open dumping of fleshings for a typical tannery cluster (Ravindranath et al., 2015).
Saleh et al. (2011) investigated the possibility of applying innovative low-cost biological treatment using UASB in providing adequate treatment for tannery wastewater. The anaerobic treatment application was thus evaluated through using two stage UASB reactors connecting in series, each with volume of 94 liter (Saleh et al., 2011). Five HRT were used along the experimental works, which lasted for a year, starting by HRT of 24 h then 18 h, 12 h, 8 h and finally 5 h for each UASB reactor. The proposed process at 12 h HRTs could pre-treat the tannery wastewater to be disposed to the municipality sewers. The study created best fit equations to predict the efficiency of the system (Saleh et al., 2011).
The anaerobic digestion of tannery soak liquor was studied using an UASB. COD removal reached 78% at an OLR of 0.5 kg COD/m3.d, a HRT of 5 days and a total dissolved solid (TDS) concentration of 71 g/l (Lefebvre et al., 2006). The combination of the UASB with an aerobic post-treatment enhanced the performance of the overall wastewater treatment process and the COD removal efficiency of the combined anaerobic/aerobic treatment system reached 96%. However, for effective operation, the system had to be operated at very low OLRs, which affects the economic viability of such a process (Lefebvre et al., 2006).
Among the novel treatment processes the FO membrane process, water permeation occurs spontaneously through a semi-permeable membrane, being driven by the chemical potential difference (osmotic gradient) of a high-concentration draw solution (DS) and relatively low-concentration Feed Solution (FS) (Ang et al., 2019). FO process can have the advantages of reduced capital and operational costs owing to low energy consumption and low fouling because an additional hydraulic pressure is not required (Aydiner et al., 2014; Awad et al., 2019). It was investigated the rejection of pharmaceutically active compounds by an FO process as a function of the pH. They reported that the rejection of the compounds could be affected by the charge of molecules in the solution, which could be changed depending on the pH of the FS and pKa of the molecules (Bamaga et al., 2011; Bell et al., 2017). In another study, the effects of the DS and membrane materials on the removal of COD were evaluated on an FO membrane. It was reported that the high Reverse Salt Flux (RSF) of NaCl hindered the adsorption and diffusion of the COD in the FO membrane pore (Blandin et al., 2015). Moreover, the Polyamide (PA)-based FO membrane exhibited a higher rejection of neutral COD in solution (Ning and Shen, 1998; Scholz and Lucas, 2003).
Tannery wastewaters are difficult to treat biologically due to the high salinity and organic matter concentration (Luján-Facundo et al., 2018). Conventional treatments, like sequential batch reactors (SBR) and membrane bioreactors (MBR), have showed settling problems, in the case of SBR, and ultrafiltration (UF) membrane fouling in the case of MBR, slowing their industrial application. Luján-Facundo et al. (2018) investigated the treatment of tannery wastewater with an osmotic membrane bioreactor (OMBR) is assessed. FO membranes are characterized by a much lower fouling degree than UF membranes. The permeate passes through the membrane pores (practically only water by the high membrane rejection) from the feed solution to the draw solution, which is also an industrial wastewater (ammonia absorption effluent) (Luján-Facundo et al., 2018). Experiments were carried out at laboratory scale with a FO CTA-NW membrane from Hydration Technology Innovations (HTI). Tannery wastewater was treated by means of an OMBR using as DS an actual industrial wastewater mainly consisting of ammonium sulphate. The monitoring of the biological process was carried out with biological indicators like microbial hydrolytic enzymatic activities, dissolved and total adenosine triphosphate (ATP) in the mixed liquor and microbial population (Luján-Facundo et al., 2018). Results indicated a limiting conductivity in the reactor of 35 mS/cm (on the 43th operation day), from which process was deteriorated. This process performance diminution was associated by a high decrease of the dehydrogenase activity and a sudden increase of the protease and lipase activities (Luján-Facundo et al., 2018). The increase of the bacterial stress index also described appropriately the process performance. Regarding the relative abundance of bacterial phylotypes, 37 phyla were identified in the biomass. Proteobacteria were the most abundant (varying the relative abundance between 50.29% and 34.78%) during the first 34 days of operation. From this day on, Bacteroidetes were detected in a greater extent varying the relative abundance of this phylum between 27.20% and 40.45% (Luján-Facundo et al., 2018).
The aim of this study, utilization of anaerobic UASB/aerobic FO sequential treatment system to treat the leather industry wastewater. The recovery of valuable chemicals (collagen, gelatine and total chromium) in the leather industry wastewater from UASB waste sludge and concentrate of FO. Determination of the water quality of treated water by the reduced water supply in Turkey in water again for cooking and cleaning process uneconomical for the use as purified water. Calculation of the total treatment cost in operating parameters where the maximum efficacy properties of the pollutants are obtained after all the treatments of the leather industry wastewater are passed. By reusing of methane gas, collagen, gelatine and total chromium the re-utilization of these economical merit chemicals and reducing the total cost of treatment.
2.1. Characterization of Raw Leather Industry Wastewater
The characterization of the raw leather industry wastewater used in this study is given in Table 1. The results of the analysis were repeated n=4 times in laboratory conditions and averaged (Table 1).
| Parameters | Units | Concentrations |
| CODtotal | mg/l | 12967 |
| CODdissolved | mg/l | 2576 |
| Total Nitrogen (Total–N) | mg/l | 14 |
| Total Phosphorus (Total–P) | mg/l | 44 |
| Color | A | 8.23 |
| pH | 5.5 | |
| Total chrome (Cr + 3 and Cr + 6 sum) | mg/l | 5.69 |
| TOC | mg/l | 1800 |
| SO4 | mg/l | 1200 |
| Percentage of Exchangeable Sodium | % Na | 50 |
| Sodium adsorption rate (SAR) | mEq/l | 22 |
| Sodium carbonate residue (RSC) | mg/l | 134 |
| Chloride (Clˉ), | mg/l | 338 |
| Sulfate (SO4 -2) | mg/l | 456 |
| Total salt concentration | mg/l | 963 |
| Boron (B+3) | mg/l | 1.56 |
| NO3ˉ | mg/l | 20 |
| NH4+ | mg/l | 20 |
| Fecal coliform | 1/100 ml | 60 |
| BOD5 | mg/l | 75 |
| Total suspended solids (TSS) | mg/l | 45 |
| Temperature | oC | 35 |
| EC25x106 | mg/l | 1380 |
Table 1: Characterization of raw leather industry wastewater
2.2. Operation Conditions for Raw Leather Industry Wastewater
One hundred and ten days following the start-up period, when approximately 75% COD removal and 60% methane production efficiencies were obtained at a flow rate of 6 l/day continuous operation was performed. The upflow rates were then increased from 15 1/day to 29 l/day. The UASB reactor was operated through 20–25 days in every upflow rate under steady-state conditions. The steady-state conditions were defined as constant COD removal and methane percentage in 5 consecutive days through the operation. In every upflow rate run the reactor is under steady-state conditions. The influent concentrations of parameters input UABS reactor are 12967 mg/l CODtotal, 2576 mg/l CODdissolved, 14 mg/l total-N, 44 mg/l total-P, 8.23 A color concentration, pH=5.5, 5.69 mg/l total chromium (Cr+3 and Cr+6 sum), 1800 mg/l TOC (total organic carbons), 1200 mg/l SO4-2, 50%Na percentage of exchangeable sodium, 22 mg/l SAR, 134 mg/l RSC, 338 mg/l Cl-1, 456 mg/l SO4-2, 963 mg/l total salt concentration, 1.56 mg/l B+3, 20 mg/l NO3- or NH4+, 60/100 ml fecal coliform, 75 mg/l BOD5, 45 mg/l TSS, 35oC and 1380 mg/l EC25x106, respectively.
Stainless-steel UASB reactors which had an internal diameter of 90 mm and a height of 1000 mm with a volume of approximately 2.2 liter were used in this study. Five evenly distributed sampling ports were installed over the top of the reactors. The studies were conducted at 35±2 C by means of a temperature-controlled heater in the reactor, since the anaerobic removal efficiencies; COD, volatile fatty acids (VFA) levels and decreased methane gas productions were reduced at low temperatures in UASB reactor.
Partially granulated anaerobic sludge was used as seed in UASB reactor and was taken from the methanogenic and acidogenic reactors of Pakmaya Yeast Baker Factory in Izmir, Turkey. These sludges were mixed in a ratio of 1/1 in UASB reactor. The number of methanogens and acedobens varied according to organic loadings applied to the UASB reactor. Anaerobic sludge was acclimated during the start-up period through the continuous operation of the UASB reactor.
The thin-film composite membrane (TFC-Aquaporin Inside™ or TFC-AIM) used in this study was purchased. The membrane had a thickness of approximately 110±15 mm, porosity of 50±2%, and pore size of 0.3 nm. The appropriate pH range was between pH=3.0 and pH=11.0, and the membrane was negatively charged for pH Greater than 3.0. The cellulose triacetate (CTA) membrane was obtained from Hydration Technology Innovations. This membrane had a thickness of 144±24 mm, pore size of 0.37 nm, and porosity of 50±2%. The pH range of the membrane was pH=3.0-8.0 (Li et al., 2017; Luo et al., 2018; Xie et al., 2018; Singh et al., 2019). The MD membrane used in this study is polytetrafluoroethylene (PTFE) hydrophobic membranes obtained from the Ray-E Creative company, Taiwan with pore size of 0.45 mm.
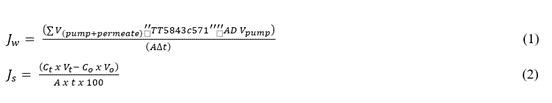
A 1-liter feed tank, 1 liter DS tank, FO membrane 1 liter feed tank, 1 liter DS tank, FO membrane, the lab-scale flat sheet FO volume was fabricated with an effective area of 41.40 cm2. The FS and DS were simultaneously operated by peristaltic pumps to recirculate in the FO system at cross flow rate of 400 cm/min at room temperature. The pH and conductivity of both sides were controlled using the pH/conductivity meter. The FO system was operated in FO mode (active layer facing FS). The wastewater had a slight TOC content because of the cellulose triacetate film within the polarizer, and the suspended solids (SS) of this TFT-LCD sewage is 10 mg/l. MgCl2 was used as the DS in this FO system since MgCl2 exhibits the characteristic of high osmosis pressure and lower reverse salt flux (Achili et al., 2009; Achilli et al., 2010). In addition, the weighing scale (BW12KH, Shimadzu, Japan) was used for determining the weight of FS. Then, the water flux (Jw) and reverse salt flux (Js) were calculated by monitoring changes of the weight and TDS concentration, as shown in Equation (1) and Equation (2) (Nguyen et al., 2013; Helfer et al., 2014; Xu et al., 2017), where Vpermeate is the volume of permeated water of membrane, Vpump is the water volume of originally cycled in the system by the pump, A means the area of the membrane, t is the time of operation, Ct represents the concentration of salt. Through detected the change of water volume and salt concentration of membrane two sides, the water flux and reverse salt can be calculated from Equation (1) and Equation (2):
Surfactant CTAB was used in the FO FS to enhance the iodide recovery and boron removal efficiencies by forming either CTAş-iodide/CTAş-boron or iodide-micelle/boron-micelle complexes in the feed because of the aggregates (Huang and Gu, 1987; Juang et al., 2003; Pavithra et al., 2014). A CTAB concentration range of 0.5 mM – 30 mM (1.82 g/l – 10.92 g/l) was used to evaluate the effects of the CTAB concentration on the CMC. The DS was diluted after long-time operation, and a PTFE hydrophobic MD with an effective area of 100 cm2 was used to concentrate the DS. The diluted DS of the FO system was used as the feed stream of the DCMD. The driving force of the MD depends on the temperature difference of the two sides. The feed side temperature was controlled at 60oC, and deionized water was used in the draw side at a temperature of 20oC. The cross-flow rate for both sides of the MD were approximately 18.9 cm/s.
COD in influent and effluent samples were measured using closed Reflux colorimetric method (Baird et al., 2017). Cumulative and methane gases were measured by liquid displacement method (Razo-Flores et al., 1997; Beydilli et al., 1998). VFA were measured by a two-stage titration method developed by Anderson and Yang (1992). The temperature was measured automatically with a digital heater held in the UASB reactor. 2,4 DCP was analyzed with a spectrophotometer at 500 nm wavelength in the samples centrifuged at 14000 rpm for 25 min (Baird et al., 2017).
pH, temperature [T(oC)], total suspended solids (TSS), total volatile suspended solids (TVSS), biological oxygen demand 5-days (BOD5), total chemical oxygen demand (CODtotal), dissolved chemical oxygen demand (CODdis), total organic carbon (TOC) and Fecal coliform bacteria were monitored according to Standard Methods 2550, 2580, 2540 D, 2540 E, 5210 B, 5220 D, 5220 E, 5520, 9225 respectively, (Baird et al., 2017). Ammonium nitrogen (NH4-N), nitrate nitrogen (NO3-N), chloride (Cl-1), boron (B), Sodium (Na), sodium carbonate (NaCO3), sulfate ion (SO4-2), total phosphorus (Total-P) and total nitrogen (Total-N) were measured with cell test spectroquant kits (Merck, Germany) at a spectroquant NOVA 60 (Merck, Germany) spectrophotometer (2003). Total chrome (Cr+3 and Cr+6 sum) analysis was performed according to the standard method (2005) SM3500-Cr in Inductively Coupled Plasma-Mass Spectrometer (ICP-MS) device.
The measurement of color was carried out following the approaches described by Olthof and Eckenfelder (1976), and Eckenfelder (1989). According these methods, the color content was determined by measuring the absorbance at three wavelengths (445 nm, 540 nm and 660 nm), and taking the sum of the absorbances at these wavelengths. Sodium adsorption ratio (SAR) means a value representing the relative amount of sodium ions to the combined amount of calcium (Ca+2) and magnesium (Mg+2) ions in water using the following formula: SAR=[Na]/(([Ca]+[Mg])/2)1/2, where all concentrations are expressed as milliequivalents of charge per liter (mEq/l).
2.6. Water Pollution and Control Wastewater Regulation for Wastewater Treatment
Water pollution control ordinance in (the water pollution control ordinance, the classification of irrigation waters, technical procedures communique of January 7, was published in 1991, 20748 in the official gazette.) Referring to the limits of a very dirty wastewater purified water that leather industry can be reused in the process and 2. Class water and 1. Class water with “good” and “very good” properties (Table 2).
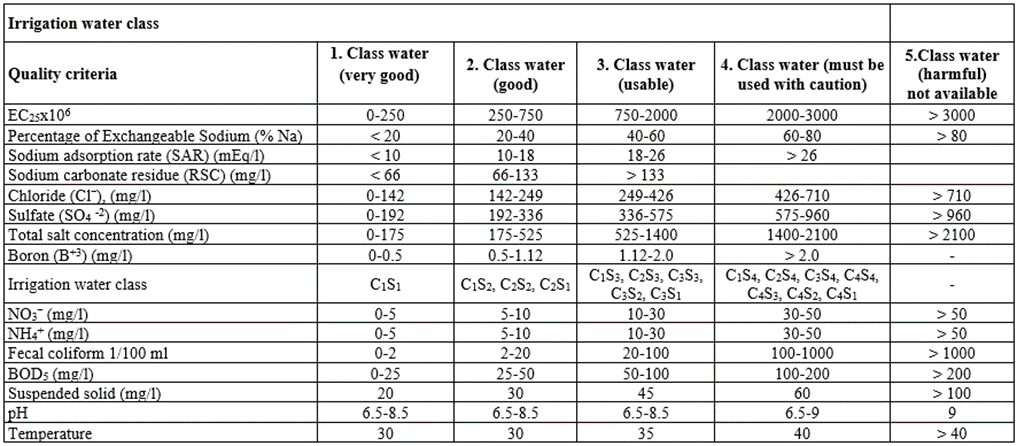
Table 2: Irrigation water quality parameters based on the classification of irrigation water (The regulation on water pollution and control, classification of irrigation water, the technical procedures communique was published in the official newspaper dated 7 January 1991 and numbered 20748.)
2.7. Reuse of Treated Water
2.7.1. Collagen recovery from total chromium and FO concentrate from anaerobic reactor
Collagen protein was prepared through degradation of chrome leather scraps under alkaline-heating condition. Briefly, the chrome leather scraps from FO concentrate output from anaerobic reactor were mixed with 200% water, 0.1% surfactant, solid 2% MgO (magnesium oxide) and 0.125% Enzyme (all based on the weight of chrome leather scarps) into reaction still, stirring continuously for 1.5 h at 72oC. The obtained degradation liquid was shifted through 0.45-micron pore diameter filtering under 5.92 atm at 35oC-40oC in order to remove the sludge. After press filtering, the filtering liquid was adjusted to pH=6.5-7.0 with ammonium sulfate. After 1.5% diatomite, as an adsorbent, was add into filtering liquid to absorb and flocculate chromium compound at 30oC, the filtering liquid was purified by press filtering again to get rid of the precipitate. Top liquid collagen (as collagen hydrolized) was viewed after press filtering. At the last the filtering liquid was concentrated using RE52CS rotary evaporator and was spray dried using JOYN-8000 spray dryer (China), the collagen protein was obtained finally.
2.7.2. Gelatine and total chromium recoveries from FO concentrate from anaerobic reactor
Gelatine was recovered from prepared through degradation of chrome leather scraps under alkaline-heating condition. Firstly, the chrome leather scraps from FO concentrate output from anaerobic reactor were mixed with 200% water, 0.1% surfactant (Pluronic 25R2 noniyonic) and solid 6%MgO addition into reaction still, stirring continuously for 6 h at 70oC. After, samples were precipitated in the collapse unit. The obtained degradation liquid was shifted through 0.45-micron pore diameter filtering under 5.92 atm at 35oC-40oC in order to remove the sludge. After press filtering, the filtering liquid was adjusted to pH=6.5-7.0 with ammonium sulfate. After 1.5% diatomite, as an adsorbent, was add into filtering liquid to absorb and flocculate chromium compound at 30oC, the filtering liquid was purified by press filtering again to get rid of the precipitate. Gelatine was observed in top water after press filtering. At the last the filtering liquid was concentrated using RE52CS rotary evaporator and was spray dried using JOYN-8000 spray dryer (China), finally, the gelatine was obtained finally.
2.7.3. Total chromium recovery in FO concentrates and anaerobic waste sludge of UASB
Total chromium is recovered by precipitation in the alkaline environment from the waste sludge in the anaerobic reactor. Total chromium recovery was obtained both reactant of anaerobic reactor and FO concentrate. In filtering, which is the final treatment of FO treatment, total chromium analysis was performed on the settled sludge and its concentration was observed to be very low. For this reason, no chrome recovery has been made from the sludge. At optimum condition inlet feed concentration 4200 mg/l, flow rate 0.62 m3/h, working pressure 39.5 atm for maximum permeated mass flux 45 g/min/cm2, inlet flow rate 0.72 m3/h was achieved to 99.9% of Chromium recovery at optimum pH=6.7, respectively. To reduce energy consumption the pressure should be adjusted at medium level, around 29.61-34.54 atm. The flow rate should be adjusted also at medium level between 0.6 m3/h and 0.66 m3/h. Samples should be pretreated to avoid clogging and reduce the energy excreted to filter the wastewater.
3.1. Total Chromium, Collagen and Gelatine Recovery in Anaerobic UASB Reactor Sludge
334 mg/l of total chromium has passed through anaerobic UASB reactor mud and 243.82 mg/l of total chromium in the raw leather industry entrance wastewater passes to anaerobic UASB mud. In other words, 27% of the total chromium is recovered from the anaerobic UASB mud (Table 3 and Table 4). After adding 5 mg/l sodium carbonate in the mud alkaline medium, it is mixed in a mechanical mixer for 1 h and the chromium concentration is measured in the precipitated part (Table 3).
| Chemicals | Units | Na2CO3 concentrations |
| Dosage Actual | mg/l | 5 |
| pH influent | 8.42 | |
| pH effluent | 7.66 | |
| Total Cr(III) and Cr(V) concentration in anaerobic sludge | mg/l | 5.28 |
| Sludge volume (ml) final precipitation | mg/l | 100 |
| Cr(III) and Cr(V) in the upper fluid | mg/l | 0.41 |
| Cr recovery | % | 27 |
Table 3: Total chromium recovery through precipitation in alkaline environment from sludge in anaerobic UASB reactor
10 mg/l of collagen has passed through anaerobic reactor mud and 7.8 mg/l of total chromium in the raw leather industry entrance wastewater passes to anaerobic UASB mud. In other words, 78% of the total chromium is recovered from the anaerobic UASB mud (Table 4). 5 mg/l of total chromium has passed through anaerobic reactor mud and 4 mg/l of total chromium in the raw leather industry entrance wastewater passes to anaerobic UASB mud. In other words, 80% of the total chromium is recovered from the anaerobic UASB mud (Table 4).
| Parameters | Where was it recovered | Influent Conc. (mg/l) | Effluent Conc. (mg/l) | Recovery Conc. (mg/l) | Recovery (%) |
| Total Chromium | Anaerobic UASB mud | 334 | 90.18 | 243.82 | 27 |
| Collagen | Anaerobic UASB mud | 10 | 2.2 | 7.8 | 78 |
| Gelatine | Anaerobic UASB mud | 5 | 1 | 4 | 80 |
Table 4: Yield properties of total chromium, collagen and gelatine with high economic value recovered from the raw leather industry wastewater from anaerobic UASB mud.
3.2. Total Chromium, Collagen and Gelatine Recovery from Aerobic FO Outlet
In the sample taken from the aerobic FO concentrate output, the total chromium, collagen and gelatine concentrations were measured as 3.34 mg/l, 0.5 mg/l and 0.2 mg/l, respectively (Table 5). The efficiency characteristics of chemical substances (total chromium, collagen and gelatine) with high economic value recovered from the raw leather industry wastewater from aerobic FO concentrate output are indicated in Table 5.
| Parameters | Where was it recovered | Influent Conc. (mg/l) | Effluent Conc. (mg/l) | Recovery Conc. (mg/l) | Recovery (%) |
| Total Chromium | FO concentrate output | 334 | 3.34 | 330.66 | 99 |
| Collagen | FO concentrate output | 10 | 0.5 | 9.5 | 95 |
| Gelatine | FO concentrate output | 5 | 0.2 | 4.8 | 96 |
Table 5: Yield properties of total chromium, collagen and gelatine with high economic value recovered from the raw leather industry wastewater from aerobic FO concentrate output
3.3. Anaerobic UASB Reactor Performance
In fact, on one hand, the dosage of moderate amount of sodium bicarbonate in the substrate contributed to alkalinity maintenance, since the pH in both UASB reactors were maintained around pH=7.0, which is the ideal value for methanogens (Ahmad et al., 2011).
The soluble carbohydrates removal efficiencies (CREs) in the UASBO-S closed to 95% at the OLR range of 1–4 g-COD/l/d (Table 6). This is clear evidence that excellent starch conversion could be achieved in a UASB reactor with a lower OLR, which has been agreed upon with the report by Lu et al. (2015), who obtained a satisfactory UASB treatment performance of SW at an OLR of 4 g-COD/l/d. It was obvious that in the UASBO-S, the CRE at the OLR of 8 g-COD/l/d was significantly lower than other experimental periods (one-tailed t-test, the p-value Less than 0.05), and has decreased to 88.8%. In the methanogenesis, In-situ acidification procedure of converting carbohydrates to short-chain fatty acids is fast, but should not to be considered as a rate limiting step (Ma et al., 2018). At the OLR of 8 g-COD/l/d, only 30 mg/l of acetic acid was detected in the UASBO-S effluent, without significant VFAs accumulation. This suggests that the decrease of carbohydrates conversion in the UASBO-S at the OLR of 8 g-COD/l/d was not contributed to residual starch in the effluent. The MLVSS of granular sludge in the UASBO-S started to show a downward trend at an OLR of 4 g-COD/l/d, and further decreased to 47.54 g/l when the OLR was increased to 8 g-COD/l/d. It is known that the MLVSS of the sludge is positively correlated with the biomass amount in the bioreactor (Zhang et al., 2019a; Zhang et al., 2019b). This implied that when the OLR was increased to 4 g-COD/l/d, the granules disintegration resulted in the biomass loss in the UASBO-S. Furthermore, at the OLR of 4 g-COD/l/d, the granules settling velocities (SV) in the UASBO-S performed lower than that in the UASBT-S. This could also reflect the biomass loss and the worsened sludge granulation in the UASBO-S (Ahmad et al., 2011).
Hence, the decrease in the carbohydrate removal capability in the UASBO-S at the higher OLR conditions is suggested to attribute to the dissolution of intracellular polysaccharide (PS) components caused by the cytoplasmic release of microorganisms. 95% of carbohydrates could be removed in the pre-acidification unit, the overall CRE could be maintained higher than 95% throughout the whole experiment. The improvement of the CRE in the two-stage (T-S) process, especially at higher OLR was apparently due to the creation of better acidification conditions, viz., the influent carbohydrates (starch) could be converted to acetic and propionic acids during the pre-acidification. In other words, the UASBT-S was mainly fed with the acetic and propionic acids as the substrate. Because of the biochemical conversion from propionate to acetate is thermodynamically unfavorable (ΔG=+76.1 kJ/mol), in the anaerobic digestion (AD) process, the accumulation of propionate is not usually conducive to methanogenesis (Feng et al., 2015; Li et al., 2018). However, the concentrations of the propionic acid in the CSTRT-S were at the range of 88–193 mg-HAc/l.
The overall performance of both the UASB during the entire 200-day long-term operation is given in Table 6. Both the reactors were initiated with a long HRT of 24 h and an OLR of around 3 g-COD/l/d at the beginning. It is obvious that when being inoculated with the DAS, both the UASB exhibited excellent methanogenic degradation of dimethylformamide is a common solvent for chemical reactions (DMF) before Day 28: A high DMF removal efficiency of nearly 100% and a high methane production rate were obtained (Table 6). This remarkable result was even observed on the first day, demonstrating that the co-culture of dried activated sludge (DAS) with either annotation data set (ADS) or aerobic granular sludge (AGS) was effective and feasible, and was also a repeatable method which is easy to realize quick start-up of the DMF-degrading system (Table 6). However, when the HRT was shortened to 18 h and the OLR was elevated to around 4 g-COD/l/d, the UASB still maintained a nearly 100% of DMF removal. This suggests that the granular sludge contained in the UASB could tolerate a much higher OLR (Table 6).
| HRT (h) | Period | pH | OLR (g COD/l/d)a | DMF removal efficiency (%) | MPR (L CH4/l/d)b | CH4 content (%) | SS (mg/l)c |
| 24 | 1–14 | 7.65 ± 0.14 | 3.37 ± 0.08 | 99.24 ± 0.10 | 1.218 ± 0.041 | 89.42 ± 1.11 | 175.0 ± 52.2 |
| 18 | 15–28 | 7.26 ± 0.16 | 4.22 ± 0.12 | 96.53 ± 1.37 | 1.270 ± 0.063 | 89.83 ± 0.44 | 83.0 ± 64.7 |
| 12 | 29–42 | 7.21 ± 0.15 | 6.17 ± 0.13 | 70.64 ± 4.49 | 1.250 ± 0.049 | 89.61 ± 0.65 | 51.4 ± 20.5 |
| 8 | 43–74 | 7.43 ± 0.26 | 9.24 ± 0.20 | 27.36 ± 23.22 | 0.933 ± 0.401 | 88.40 ± 1.26 | 90.3 ± 29.5 |
| 6 | 75–100 | N.A | 13.25 ± 0.19 | 13.19 ± 18.56 | 0.325 ± 0.126 | 84.49 ± 2.48 | 106.3 ± 27.6 |
| Batch | 101–124 | 7.41 ± 0.22 | N.A | N.A | 0.035 ± 0.024 | 82.19 ± 3.42 | N.A |
| 24 | 125–142 | 7.32 ± 0.11 | 3.34 ± 0.10 | 67.99 ± 14.53 | 0.527 ± 0.207 | 89.93 ± 1.05 | 142.5 ± 32.6 |
| 48 | 143–200 | 7.29 ± 0.09 | 1.52 ± 0.07 | 39.87 ± 8.45 | 0.118 ± 0.045 | 85.26 ± 3.79 | 117.5 ± 17.7 |
| a OLR = Organic loading rate; b MPR = Methane production rate; c SS = Suspended solid. DMF: dimethylformamide. | |||||||
Table 6: The results of the UASB during the 200-day long-term operation.
With the further shortening of HRT to 12 h, the OLR correspondingly rose to around 6 g COD/l/d. The performance of UASB also slightly worsened. By the end of this period, the DMF removal efficiency of the UASB was maintained at around 70% (Table 6). This suggests that the DMF-degrading ability of the sludge weakened with the increase in OLR. The DMF removal efficiency of UASB dramatically dropped. It was apparent that under such a high OLR, the sludge in both reactors could no longer handle the higher loading of DMF within 8 h. This was probably due to the shock of the sludge caused by the high OLR and the deactivation of the DMF-hydrolytic enzyme. The UASB was also conducted with a re-inoculation of DAS on Day 58. The UASB immediately regained 100% removal efficiency the next day. However, the high DMF-degrading ability then gradually weakened with time under the HRT of 8 h. After that, a further shorter HRT of 6 h with the highest OLR of around 13 g-COD/l/d was attempted on the UASB. The degradation of DMF was remarkably poor during this period. Although another re-inoculation of new DAS was performed on Day 88, the UASB just temporarily obtained a slightly recovered DMF removal efficiency. Rather than the expected recovery of the excellent DMF-degrading ability, both the DMF removal efficiency and methane production rate continued to drop with time (Table 6).
After that, a batch period was conducted in both reactors by stopping the feed in order to recover the DMF-degrading ability of the sludge. This period only lasted for 14 days, and the HRT was soon lengthened to 24 h (Table 6). For the UASB, a third re-inoculation of 1-liter new DAS performed right after the batch period helped to lift the DMF removal efficiency to around 80%. However, this re-inoculation was not sufficient to regain the thorough degradation of DMF to nearly 100% even when the HRT was 24 h. After that, even when the HRT of UASB was lengthened to 48 h, the DMF removal efficiency remained at a low level around 40%. During this period, while the OLR was not that high, the DMF removal efficiency of both reactors still kept weakening. This indicates that those 2,5-dihydroxybenzoic acid (DHB) sourcing from the DAS was likely to keep decaying all the time even when the OLR was kept low. It is also obvious that whether the effective degradation of DMF can be realized depends on the replenishment of DAS during the entire operation (Table 6).
While DMF was not effectively degraded with the increase in OLR, it should be noted that the methane content of the produced biogas from UASB was higher than 85%, which are much higher than that from the AD process of normal biomass such as food waste (Li et al., 2017), indicating that the AD process is a feasible option for the treatment of DMF-containing industrial wastewater because methane with higher purity could be directly recovered from DMF. The UASB in this study obtained in higher methane content. However, as shown in Table 6, it should also be noted that the effluent from the UASB contains relatively high suspended solid (SS) due to the flushed-out sludge or decayed cells.
Influent and effluent concentrations of all pollutant parameters after 84% recovery of anaerobic UASB reactor in the raw leather industry wastewater was shown in Table 7.
| Parameters | Units | Influent Conc. | Effluent conc. |
| CODtotal | mg/l | 12967 | 2075 |
| CODdissolved | mg/l | 2576 | 412.16 |
| Total Nitrogen (Total–N) | mg/l | 14 | 2.24 |
| Total Phosphorus (Total–P) | mg/l | 44 | 7.04 |
| Color | A | 8.23 | 1.32 |
| pH | 5.5 | 5.5 | |
| Total chrome (Cr + 3 and Cr + 6 sum) | mg/l | 5.69 | 0.91 |
| TOC | mg/l | 1800 | 288 |
| Sulfite (SO3-2) | mg/l | 1200 | 192 |
| Percentage of Exchangeable Sodium | % Na | 50 | 8 |
| Sodium adsorption rate (SAR) | mEq/l | 22 | 3.52 |
| Sodium carbonate residue (RSC) | mg/l | 134 | 21.44 |
| Chloride (Clˉ), | mg/l | 338 | 54.08 |
| Sulfate (SO4 -2) | mg/l | 456 | 73 |
| Total salt concentration | mg/l | 963 | 154.08 |
| Boron (B+3) | mg/l | 1.56 | 0.25 |
| NO3ˉ | mg/l | 20 | 3.2 |
| NH4+ | mg/l | 20 | 3.2 |
| Fecal coliform | 1/100 ml | 60 | 9.6 |
| BOD5 | mg/l | 75 | 12 |
| TSS | mg/l | 45 | 7.2 |
| Temperature | oC | 35 | 35 |
| EC25x106 | mg/l | 1380 | 221 |
Table 7: Influent and Effluent concentrations of all pollutant parameters after 84% recovery of anaerobic UASB reactor in the raw leather industry wastewater
3.4. Aerobic FO Reactor Performance
3.4.1. Effect of temperature
In the FO process, operation conditions are the dominant influential factors that determine water flux and reverse solute flux (RSF) (Zhao and Zou, 2011; Im et al., 2018). Among the operation conditions, temperature is a governing factor for mass transfer coefficient and membrane properties such as structural parameters, water permeability, salt permeability, and concentration polarization (CP) effects (You et al., 2012; Xie et al., 2013; Song et al., 2018). In practical aspect, because FO used two water resources at different sides, temporal and spatial variations of temperature difference can affect the membrane performance significantly (Babu et al., 2018). Therefore, in this section, in relation to one of the influencing factors, the algae metabolized materials removal efficiency was investigated according to the temperature difference of feed solution (FS) and DS and the transmembrane temperature difference.
3.4.2. Performance with temperature difference
Water flux and RSF values of polyamide (PA) based thin-film composite (TFC) FO membrane were significantly affected by FS and DS temperatures (Table 8). When the temperatures of FS and DS are equally increased from 10oC to 30oC, both water flux and RSF also increased. Water flux and RSF increased from 11.7±6.3 to 27.9±3.5 litres per square metre hour (LMH, l/m2.h) and from 38.1±0.32 to 55.5±0.77 gram per square metre hour (GMH, g/m2.h), respectively (Table 8).
| Parameters | Water flux | Reverse solute flux (RSF) |
| Temperature of FS | 10 | 30 |
| Temperature of DS | 10 | 30 |
| LMH, (l/m2.h) | 11.7±6.3 | 27.9±3.5 |
| (GMH, g/m2.h) | 38.1±0.32 | 55.5±0.77 |
Table 8: Performance with temperature differences
This may be due to the effects of temperature-dependent parameters, such as water permeability coefficient, mass transfer coefficient, osmotic pressure, viscosity and solute diffusivity. These factors enhance the water permeability and mass transfer coefficient and reduce viscosity, resulting in increased water flux and RSF values. These results are in a good agreement with the results from the previous studies related to temperatures in membrane field (You et al., 2012; Im et al., 2017).
3.4.3. Effect of feed (inlet) flow rate on permeate flow rate
To determine the effect of feed flow, rate the experiment was carried out at different feed concentrations 4500 mg/l, 2500 mg/l and 700 mg/l at different working pressure 24.7 atm, 29.6 atm and 39.5 atm, respectively (Table 9). The forward osmosis technology involves application of pressure to the feed stream to overcome natural osmotic pressure.
| Feed flow rate concentrations (mg/l) | Feed flow rate working pressures (atm) |
| 4500 | 24.7 |
| 2500 | 29.6 |
| 700 | 39.5 |
Table 9: Effect of feed (inlet) flow rate on permeate flow rate
If excess pressure was applied to the concentrated solution the flow of water is reversed. Besides the slope of the graphs for this case are steeper than the, permeate flow rate verses inlet flow rate, graphs; this shows that working pressure has more effect on the permeate flow rate than inlet flow rate. Increasing the applied/feed pressure also results in increased solute rejection (Cr salt recovery), might be due to reverse osmosis membranes are imperfect barriers to dissolved the salts in the feed. As feed pressure is increases, the solute passage is increasing and the solution is pushed through the membrane at a faster rate than solute can be transported (Dao et al., 2016; Yin et al., 2016).
3.4.4. Effect of feed chromium concentration on permeate flow rate
The effect of chromium concentration was carried out at 700 mg/l, 2500 mg/l and 4500 mg/l at different inlet flow rate 0.36 m3/h, 0.62 m3/h and 0.72 m3/h, at 24.7 atm, 29.6 atm and 39.5 atm pressure, respectively (Table 10). It was found that feed concentration not affect the efficiency. The slope of the lines on these graphs are a slight deviation from horizontal which indicates that the effect of feed chromium concentration on permeate flow rate is not as significant as the above two parameters. In addition, the trend of the curves for all cases is increasing to some extent and then decreasing except some lines which may due to reading or any errors incorporated like experimental leaks, pressure oscillations in factor adjustment. In Table 10 when the feed concentration 4500 mg/l at inlet flow rate 0.36 m3/h and 40 atm working pressure, the permeate flux was 28 g/min/cm2 and when feed concentration was 700 mg/l permeate flux was 25 g/min/cm2. When the inlet flow rate was 0.62 m3/h and feed concentration was 4500 mg/l, the permeate flux 33 g/min/cm2 was almost similar to 700 mg/l feed concentration (Table 10).
| Feed chromium concentration (mg/l) | Different inlet flow rate (m3/h) | Different pressures (atm) |
| 700 | 0.36 | 24.7 |
| 2500 | 0.62 | 29.6 |
| 4500 | 0.72 | 39.5 |
Table 10: Effect of feed chromium concentration on permeate flow rate
3.4.5. Influence of pH on Water flux rate
FO experiments were carried out with FSs of varying pH (from pH=4.0 to pH=10.0); the results are presented in Table 11. Water flux rate increased only slightly (from 20.4±1.2 l/m2/h to 20.8±2.1 l/m2/h) with an increase in solution pH (from pH=4.0 to pH=10.0, respectively), suggesting pH had no significant influence, associated with external concentration polarization (ECP) (Table 11).
| Feed solution pH | Water flux rate (l/m2/h) |
| 4.0 | 20.4±1.2 |
| 10.0 | 20.8±2.1 |
Tablo 11: Influence of pH on FO performance
Influent and effluent concentrations of all pollutant parameters after 99% recovery of aerobic FO reactor in the raw leather industry wastewater was shown in Table 12.
| Parameters | Units | Influent conc. | Effluent conc. |
| CODtotal | mg/l | 12967 | 129.67 |
| CODdissolved | mg/l | 2576 | 25.76 |
| Total Nitrogen (Total–N) | mg/l | 14 | 0.14 |
| Total Phosphorus (Total–P) | mg/l | 44 | 0.44 |
| Color | A | 8.23 | 0.082 |
| pH | 5.5 | 5.5 | |
| Total chrome (Cr + 3 and Cr + 6 sum) | mg/l | 5.69 | 0.06 |
| TOC | mg/l | 1800 | 18 |
| Sulfite (SO3-2) | mg/l | 1200 | 12 |
| Percentage of Exchangeable Sodium | % Na | 50 | 0.5 |
| Sodium adsorption rate (SAR) | mEq/l | 22 | 0.22 |
| Sodium carbonate residue (RSC) | mg/l | 134 | 1.34 |
| Chloride (Clˉ), | mg/l | 338 | 3.4 |
| Sulfate (SO4 -2) | mg/l | 456 | 4.6 |
| Total salt concentration | mg/l | 963 | 9.63 |
| Boron (B+3) | mg/l | 1.56 | 0.02 |
| NO3ˉ | mg/l | 20 | 0.2 |
| NH4+ | mg/l | 20 | 0.2 |
| Fecal coliform | 1/100 ml | 60 | 0.6 |
| BOD5 | mg/l | 75 | 0.8 |
| TSS | mg/l | 45 | 0.5 |
| Temperature | oC | 35 | 35 |
| EC25x106 | mg/l | 1380 | 14 |
Table 12: Influent and effluent concentrations of all pollutant parameters after 99% recovery of aerobic FO reactor in the raw leather industry wastewater
3.5. The Comparison of All Parameters Removal Efficiencies for UABS Reactor and FO Reactor in the Raw Leahter Industry Wastewater
The Comparison of All Parameters Removal Efficiencies were evaluated for UABS Reactor and FO Reactor in the Raw Leahter Industry Wastewater as seen in Table 13.
| Parameters | Removal Efficiency (%) | |
| Output Anaerobic UASB Reactor | Output Aerobic FO Reactor | |
| CODtotal | 85 | 99 |
| CODdissolved | 94 | 99 |
| Total Nitrogen (Total–N) | 89 | 99 |
| Total Phosphorus (Total–P) | 88 | 99 |
| Color | 87 | 99 |
| Total chrome (Cr + 3 and Cr + 6 sum) | 87 | 99 |
| TOC | 86 | 99 |
| Sulfite (SO3-2) | 87 | 99 |
| Percentage of Exchangeable Sodium | 90 | 99 |
| Sodium adsorption rate (SAR) | 87 | 99 |
| Sodium carbonate residue (RSC) | 84 | 99 |
| Chloride (Clˉ), | 92 | 99 |
| Sulfate (SO4 -2) | 92 | 99 |
| Total salt concentration | 93 | 99 |
| Boron (B+3) | 88 | 99 |
| NO3ˉ | 94 | 99 |
| NH4+ | 94 | 99 |
| Fecal coliform | 99 | 99 |
| BOD5 | 94 | 99 |
| TSS | 94 | 99 |
| EC25x106 | 93 | 99 |
Table 13: Removal efficiencies of all parameters for output anaerobic UASB reactor and output aerobic FO reactor.
Our leather industry wastewater from the outlet of the sequential UABS and aerobic FO reactors; It is suitable to be discharged to the receiving environment according to the Water Pollution Control Regulation (Date of Update: RG-17122022-32046) Table 12: The wastewater of leather, leather products and similar industries is discharged to the receiving environment according to the discharge standards. As a result, our leather industry wastewater from the outlet of Sequential UABS and aerobic FO reactors can be used as irrigation water.
3.6. Economic Evaluations
To get a preliminary idea on the cost implication of the proposed membrane-based technology, an economic analysis was carried out for a treatment plant of capacity of 25000 l/day. The forward osmosis-nanofiltration set-up yielded 48 l/m2.h clean water by removing chromium by almost 99%, and CODdissolved, chloride and sulfate by around 98% from the tannery wastewater. The clean permeate water produced per day computes to 4080 l/m2.day. The cost estimation was based on the annualized capital and operational cost. Annualized investment cost was computed as (Thakura et al., 2015) (Equation 3):

Cost recovery factor is calculated by the following equation (Pal, 2017) (Equation 4):

Where n is the plant project life (15 years) and i is the interest rate (8%). Annualized cost can be computed as (Thakura et al., 2015) (Equation 5):

The costs of anaerobic UASB and aerobic FO processes are 0.57 euro and 0.145 euro, respectively, to treat 1 m3 leather industry wastewater. The cost of the consecutive total system is 0.715 euro for the treatmet of 1m3 leather industry wastewater. The methane gas obtained in the UABS reactor is electrical energy and the electrical energy income was calculated as 1.9 euro from 1 m3 anaerobic waste sludge. The income to be obtained from the recovery of total chromium, collagen and gelatine from UABS and FO process is 2.75 Euro/l. As a result, the total cost decreases from 1.55 Euro/l to 0.715 Euro/l after aerobic FO process. The cost of these consecutive treatment processes is reduced by the production of methane gas and is increased the recovery of economic chemicals.
The overall annualized cost as calculated by summing up the annualized investment cost and annualized operational stands at 1.17 $/m3 of clean reusable water. The cost estimation is only preliminary in the context of a country where membranes are only imported and bit expensive. Large scale development of such membranes and even large-scale commercial purchase are likely to bring down the cost further. Moreover, total cost-benefit analysis indicates that such a technology not only produces quality water of reusable criteria from wastewater but also protects the surface water bodies from the onslaught of hazardous wastewater discharges as observed in many countries across the world amidst poor compliance of environmental regulations. A membrane-based technology is known for representing high degree of process intensification as measured in terms of involved space, energy, manpower, waste generation, compactness, operational flexibility and overall eco-friendliness.
In this study, two different sequential reactor systems (anaerobic UABS and aerobic FO) were used to treat the raw leather industry wastewater and optimum operating parameters were determined for maximum treatment efficiencies. The economic value of collagen and gelatine recovery and total chromium recovery values were determined.
In the biological anaerobic UABS reactor, when the sludge age was 6 days, the F/M ratio=0.95mg COD/mg MLVSS * day and the inlet flow 500 ml/day, it was found that the total chromium was removed with high yield (93%). A large part of total chromium has passed into anaerobic mud. CODtotal, CODdissolved and phosphorus were found to go with high yields (68%, 76% and 83%, respectively). When the sludge age was 6 days in the aerobic FO reactor, it was observed that the total chromium removal efficiencies were high (/92%). Total phosphorus removal efficiency was /971% and CODtotal and CODdissolved removals were found to be high in the aerobic FO reactor (90 and 920%, respectively). Considering the total biological system efficiency, total chromium, color and phosphorus removals were determined as 99%.
Our leather industry wastewater from the outlet of the sequential UABS and aerobic FO reactors; It is suitable to be discharged to the receiving environment according to the Water Pollution Control Regulation (Date of Update: RG-17122022-32046) Table 12: The wastewater of leather, leather products and similar industries is discharged to the receiving environment according to the discharge standards. As a result, our leather industry wastewater from the outlet of sequential UABS and aerobic FO reactors can be used as irrigation water.
The recovery of three chemical substances (chrome, collagen and gelatin) with high economic value from the leather industry wastewater was provided. Total chromium recovery in FO was 99%; The recovery of collagen and gelatine was also 67% and 80% in FO concentrate output, respectively. The costs of anaerobic UASB and aerobic FO processes are 0.57 euro and 0.145 euro, respectively, to treat 1 m3 leather industry wastewater. The cost of the consecutive total system is 0.715 euro for the treatment of 1m3 leather industry wastewater. The methane gas obtained in the UABS reactor is electrical energy and the electrical energy income was calculated as 1.9 euro from 1 m3 anaerobic waste sludge. The income to be obtained from the recovery of total chromium, collagen and gelatine from UABS and FO process is 2.75 Euro/l. As a result, the total cost decreases from 1.55 Euro/l to 0.715 Euro/l after aerobic FO process. The cost of these consecutive treatment processes is reduced by the production of methane gas and is increased the recovery of economic chemicals.
Finally, total cost-benefit analysis indicates that such a technology not only produces quality water of reusable criteria from wastewater but also protects the surface water bodies from the onslaught of hazardous wastewater discharges as observed in many countries across the world amidst poor compliance of environmental regulations. A membrane-based technology is known for representing high degree of process intensification as measured in terms of involved space, energy, manpower, waste generation, compactness, operational flexibility and overall eco-friendliness.
This research study was undertaken in the Environmental Microbiology Laboratories at Dokuz Eylül University Engineering Faculty Environmental Engineering Department, Izmir, Turkey. The authors would like to thank this body for providing financial support.
Dear Editorial Team, Clinical Medical Reviews and Reports. My experience with the journal was highly positive. The peer-review process was rigorous, constructive, and completed in a timely manner. The reviewers provided valuable comments that helped improve the quality and clarity of our manuscript. The editorial office was professional, responsive, and supportive throughout all stages of the publication process. Communication was clear and efficient, and any questions were addressed promptly. Overall, I found the journal to maintain high scientific standards and an excellent publication workflow. I would be pleased to consider submitting future work to this journal. Best wishes from, Elena Popa.

It was my pleasure to submit my testimonial concerning the Reviewer Board of our Scientific Journal “Brain and Neurological Disorders”. The Reviewers focused on some modifications and their contribution was helpful. The ladies of our Editorial Office were also supported my efforts. It was my honor to have such a co-operation and I am looking forward for more collaboration.

Dear Grace Pierce, Editorial Coordinator of Journal of Clinical Research and Reports, Thank you for the speedy and efficient peer review process. I appreciate the fact that your peer reviewers do not take months to respond like with some other journals. I would also like to thank the editorial office for responding quickly to my questions. It is an excellent journal. I plan to submit more manuscripts in the future. Best wishes from, Robert W. McGee

Dear Grace Pierce, Editorial Coordinator of Journal of Clinical Research and Reports, Working with you and your team on our recent publication in JCRR has been a truly wonderful and enjoyable experience. The responses were prompt, and the reviewers were patient, constructive, and highly professional. One reviewer in particular gave me the feeling that a professor was carefully reading and commenting on my coursework, which was deeply touching. The entire process was straightforward and hassle‑free, with no tedious online forms to complete. I highly recommend this journal. Best wishes from, DR Aibing Rao, Head of R&D

I Appreciate the Opportunity to Share my Experience with the Journal of Clinical Research and Reports. The peer review process was timely and constructive, and the feedback provided helped improve the quality of our manuscript. The editorial office was professional, responsive, and supportive throughout the process, ensuring smooth communication and efficient handling of the submission. Overall, it was a positive experience collaborating with your team.

Dear Mercy Grace, Editorial Coordinator of Obstetrics Gynecology and Reproductive Sciences, We would like to express our gratitude for your help at all stages of publishing and editing the article. The editors of the magazine answer all the necessary questions and help at every stage. We will definitely continue to cooperate and publish other works in the Obstetrics Gynecology and Reproductive Sciences! Best wishes from, Alla Konstantinovna Politova,
