
Research Article | DOI: https://doi.org/10.31579/2692-9759/074
1Resident at Hôtel-Dieu de France hospital, Faculty of Medicine, Saint-Joseph University, Beirut, Lebanon.
2Clinical Research Center at Hôtel-Dieu de France Hospital, Faculty of Medicine, Saint-Joseph University, Beirut, Lebanon.
3Department of Endocrinology at Hôtel-Dieu de France hospital, Faculty of Medicine, Saint-Joseph University, Beirut, Lebanon.
*Corresponding Author: Isabelle Jambart, Resident at Hôtel-Dieu de France hospital, Faculty of Medicine, Saint-Joseph University, Beirut, Lebanon.
Citation: I Jambart, G Sleilaty, S Jambart, R Medlej, G Halaby, et al. (2021) Relative Fat Mass, a new tool for measuring obesity, could predict the complications of type 2 diabetes. Journal of Endocrinology and Disorders. 5(3): Doi:10.31579/2640-1045/074
Copyright: © 2021 Isabelle Jambart. This is an open-access article distributed under the terms of the Creative Commons Attribution License, which permits unrestricted use, distribution, and reproduction in any medium, provided the original author and source are credited.
Received: 28 April 2021 | Accepted: 25 May 2021 | Published: 27 May 2021
Keywords: relative fat mass; body mass index; cardio metabolic risk
Aim/background: Obesity is a chronic disease contributing to many metabolic illnesses, in particular type 2 diabetes. The Relative Fat Mass (RFM) is a tool recently introduced for obesity which better predicts the level of visceral fat than the Body Mass Index (BMI). The aim of this study is to determine whether RFM is a better predictor of the cardiometabolic risk factors and the complications of type 2 diabetes than BMI.
Materials and methods: This is a cross sectional study. A list of information was collected from endocrinologists treating type 2 diabetic patients in a primary healthcare clinic and a tertiary hospital in Beirut. This list allowed us to evaluate the micro and macro vascular complications of type 2 diabetic patients, to assess their risk factors and to calculate their RFM and BMI.
Results: We analyzed the data of 359 patients. Higher RFM was associated with higher systolic blood pressure (p < 0.05), and both RFM and BMI were significantly correlated to higher CRP, triglyceride levels and liver enzymes. However, the BMI was better associated with other cardiometabolic risk factors such as the total cholesterol (p = 0,003), LDL cholesterol (p = 0,002) and HbA1c (p = 0,01) than RFM. Both RFM and BMI were correlated with higher microalbuminuria (p < 0.001) but unlike BMI, higher RFM was associated with higher creatinine level (p = 0.317 versus 0.047 respectively) and therefore better linked to diabetic nephropathy than BMI. More importantly, we observed an unprecedented result, associating RFM to diabetic neuropathy: a normal RFM excludes diabetic neuropathy with a high probability of 82.5%. Furthermore, a RFM cutoff value of 30.76 in men and 43.31 in women showed an increased risk of developing diabetic neuropathy by 2.464. No association was observed between RFM and diabetic retinopathy.
Conclusion: The RFM better predicts microvascular complications of diabetes than BMI except for retinopathy. It is also associated with a worse profile of metabolic syndrome. This study is unique in its discovery of the potential role of RFM as a tool which could rule out neuropathy in diabetic patients.
Obesity constitutes nowadays a real epidemic health problem [1]. It is defined as excess body fat and contributes greatly to the occurrence of several metabolic diseases, such as diabetes, hypertension, dyslipidaemia and many others which are responsible for cardiovascular complications [2]. It is also correlated to an increased incidence of complications in diabetic patients [3, 4]. This makes obesity a major public health issue, and in 1997, the World Health Organization defined it as a chronic disease rather than a simple aesthetic matter.
In clinical practice, the gold standard to measure obesity is the Body Mass Index (BMI). It is easy to calculate, reliable, and gives a better estimation of the body fat than weight alone. However, it has many limitations. It varies according to ethnicity [5, 6] and is not representative of the amount of visceral fat [7] which, by itself, constitutes an independent risk factor for morbidity [8-12]. BMI does not take into consideration the distribution of fat mass and fat free mass [13-16]. People with identical BMI can vary widely in percent body fat, which can lead to misclassification of body-fat defined obesity.
Another way of measuring obesity is waist circumference. It is simple, not related to height, and associates with visceral fat but it is also dependent on ethnicity [5, 17]. Evidence has shown that measuring waist circumference in clinical practice provides both independent and additive information to BMI for predicting morbidity and risk of death [18].
Anthropometric measures of body fat such as DEXA (Dual Energy X ray Absorptiometry), computerized tomography, MRI and biometric impedance evaluate visceral fat in a more precise manner than waist circumference [19-21] but are mostly dedicated to research because of their cost.
In 2018, a new tool, the Relative Fat Mass (RFM), was developed and many studies have shown that it is more accurate than BMI to estimate body fat percentage and more precise in the clinical diagnosis of obesity [22-26].
Since RFM is a very recently discovered tool, studies comparing the correlation of RFM and BMI to type 2 diabetes complications are rare.
The objective of this study is to determine whether RFM is a better predictor of the cardiometabolic risk factors and the complications of type 2 diabetes than BMI.
This is a cross-sectional study that took place in Lebanon from December 2018 to December 2019.
A series of information was collected from endocrinologists affiliated to a primary healthcare clinic and a tertiary hospital in Beirut, treating patients with type 2 diabetes (appendix). This information allowed us to evaluate the micro and macro vascular complications of these patients, to assess their risk factors and to calculate their RFM and BMI.
Inclusion criteria are type 2 diabetic patients treated by these endocrinologists. Patients with an HbA1c < 6.5% were excluded to make sure not to include patients taking antidiabetic medications for other purposes than diabetes.
The RFM formula includes height and waist circumference and is calculated as follows:
a – (20 x height / waist circumference) ; a being 64 for men and 76 for women [7].
A statistical analysis was performed using the SPSS v16.0 computer program. The statistical tests used are the T-test, the ROC curve (Receiver Operating Characteristic), as well as the Chi-square test.
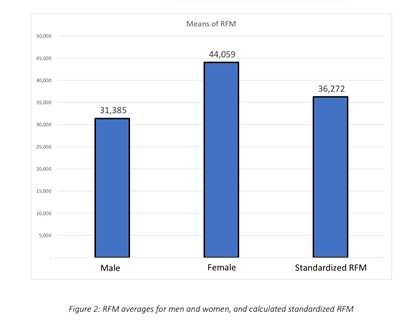
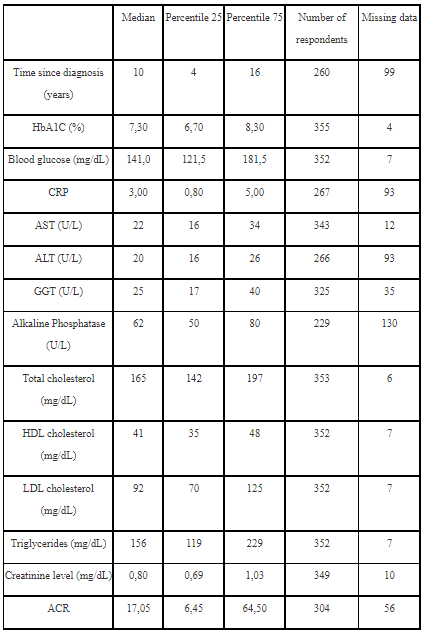
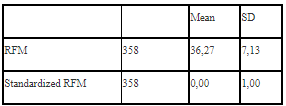
359 patients were recruited, 221 men (61.6%), and 138 women (38.4%). The average age was 61 years old and the median BMI was 29.07 kg / m2. Microvascular complications were found in 44.6 % of patients and macrovascular complications in 62.7%. Characteristics of the patients are listed in table 1. The average RFM was 31.4 for men (Standard Deviation SD 3.32), and 44.1 for women (SD 3.93). RFM in men and women was normally distributed (Figure 1) and standardized in order to use a single value in the correlation calculations. The average for both genders was 36.27 (Figure 2).

For the cardiometabolic risk factors, higher RFM was associated with higher systolic blood pressure (p < 0.05) whereas no correlation was found between RFM and diastolic blood pressure (p = 0.072). The RFM, as well as the BMI, were both significantly correlated to higher CRP and triglycerides levels and liver enzymes. Unlike RFM, BMI was significantly correlated to higher HbA1c (p-value of 0.010 vs 0.060 for RFM), total cholesterol (p-value of 0.003 vs 0.316 for RFM) and LDL-c (p-value 0.002 vs 0.179 for RFM). The HDL-c did not show any significant correlation to neither RFM nor BMI.
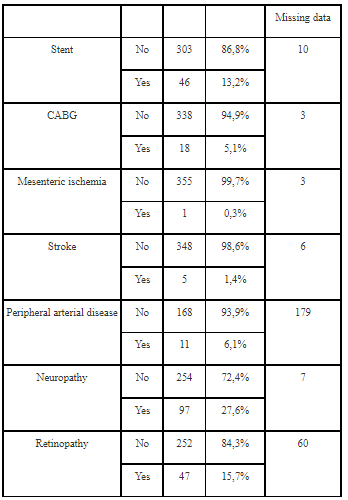
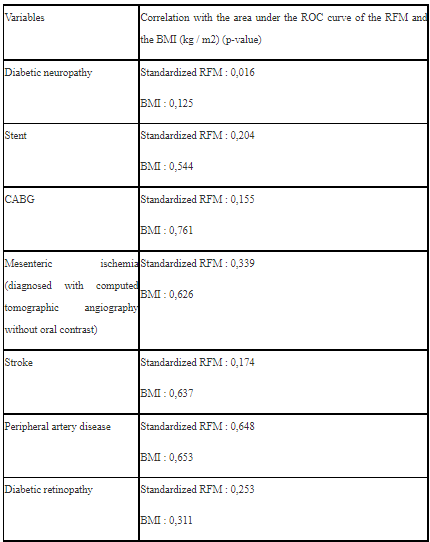
Regarding the macrovascular complications of diabetes, there was no statistically significant correlation between RFM and stenting, coronary artery bypass graft or peripheral arterial disease.
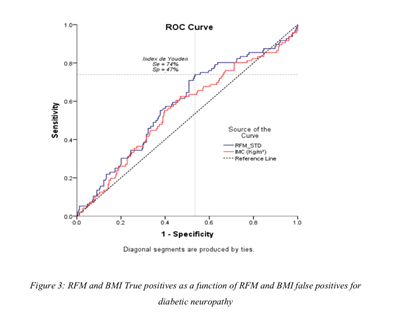
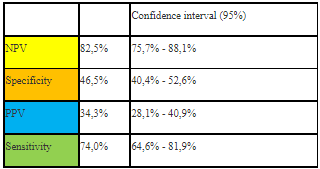
However, when assessing the microvascular complications of diabetes, we found an interesting correlation between RFM and diabetic nephropathy and neuropathy but not retinopathy. Indeed, unlike BMI, higher RFM was associated with higher creatinine level (p = 0.317 vs 0.047 respectively) and both RFM and BMI were correlated with higher microalbuminuria (p < 0.001). Furthermore, the area under the curve of true positives (sensitivity) as a function of false positives (1-specificity) of RFM had a statistically significant correlation with diabetic neuropathy (p = 0.016), unlike that of BMI (Figure 3 and Table 2). RFM was found to have a negative predictive value of 82.5% for the diagnosis of diabetic neuropathy (Table 3). A RFM cutoff value of 30.76 in men and 43.31 in women showed an increased risk of developing diabetic neuropathy by 2.464 (CI 1.468 - 4.137).
This is, to our knowledge, the first study on RFM performed on a population of diabetic patients assessing the correlation between RFM as an obesity marker and diabetic complications.
Nowadays, BMI is the most commonly and widely used obesity marker. Other markers such as waist circumference are also used by physicians. Numerous recent studies [22-26] proved the validity of RFM as a tool for measuring obesity or visceral fat. RFM was superior to BMI in diagnostic accuracy for obesity among men, women, and across ethnic groups [27]. Compared with abnormal BMI, abnormal RFM better predicted obesity among men and women using dual energy X-ray absorptiometry (DXA) as the gold standard (19); it was also found to be superior to BMI as a predictor of diabetes. According to Woolcott and Bergamn, the threshold of RFM beyond which a patient is considered obese and therefore at higher risk of mortality was set at 40 in women and 30 in men [26]. In our diabetic population, 68.6% of men and 87.9% of women have an RFM > 30 and > 40 respectively and thus are considered obese. When using the BMI with a cut-off of 30, only 44.4% of men and 44.3% of women are considered obese. This reflects the increasing prevalence of obesity among diabetic patients in our population using the RFM tool and therefore their increased risk of morbidity.
Our study emphasizes the correlation of RFM to higher triglycerides level as it was demonstrated by Leiba et al in their study showing that RFM is a better predictor of dyslipidemia and metabolic syndrome than Body Mass Index [29]. However, we found that BMI was better than RFM in its correlation to total cholesterol and LDL cholesterol. Furthermore, as shown by Kobo et al [22], RFM as the obesity criterion of metabolic syndrome encompasses a larger proportion of the population as suffering from metabolic syndrome. Indeed, our study better correlates RFM to some of the components of the metabolic syndrome: systolic blood pressure, triglycerides and obesity.
Machado et al [29] compared the roles of RFM and BMI as predictors of the severity of non-alcoholic fatty liver disease. They did not observe any significant difference between both tools [30]. This is in line with the results of our study which did not reveal any significant difference between the correlations of RFM and BMI with the markers of liver function: AST, ALT, GGT, alkaline phosphatase.
This study is the first to find an interesting correlation between RFM and diabetic nephropathy and neuropathy.
The high negative predictive value implies that RFM would be a good screening tool for diabetic neuropathy, since a normal RFM could eliminate the presence of neuropathy with a probability of 82.5%. In addition, a high RFM (> 30.76% in men and 43.31% in women), implies a risk of neuropathy multiplied by 2.464. However, although the risk more than doubled, that probability/risk still does not exceed 34.3%, which is not enough to make RFM a diagnostic tool for neuropathy. It would be interesting to confirm these findings with another study in a new population of diabetics. This study would verify whether patients with normal RFM indeed do not have diabetic neuropathy. It would also be noteworthy to identify the reasons why RFM is correlated to diabetic neuropathy and nephropathy only, and not to diabetic retinopathy and other macrovascular complications.
Our study has some limitations. It is a cross-sectional study, which reduces its power. In addition, the population comprises diabetic patients treated by endocrinologists affiliated to two health care centres. This means that we cannot generalize the results to the rest of the Lebanese population, or to the Lebanese diabetic patients. This study only includes diabetic patients with an HbA1C greater than or equal to 6.5. The results are therefore not applicable to patients with pre-diabetes. Finally, the majority of patients with type 2 diabetes who visit their endocrinologist are already being treated for their diabetes, which means that those of them who have an HbA1C below 6.5% thanks to their treatment were eliminated from the study.
The RFM is a very promising new clinical tool, which has been proven to be superior to BMI in predicting the percentage of body fat mass associated with DEXA scan results. It is also associated with a worse profile of metabolic syndrome. This study is unique in its discovery of a relationship between RFM and diabetic neuropathy and nephropathy, and the potential role of RFM as a factor that might rule out neuropathy in diabetic patients. However, further studies are needed to validate this finding.
Annex
List of information collected from patients:
- Age, sex, weight, height, waist circumference
- Date of onset of diabetes
- Blood pressure
- HbA1C and blood glucose
- Creatinine and micro-albuminuria (ACR)
- CRP
- Diabetic neuropathy (diagnosed by questioning patients and carrying out a targeted physical examination: tuning fork, thread)
- Diabetic ophthalmopathy (Normal or pathological fundus)
- Complete liver panel: AST, ALT, GGT, alkaline phosphatases
- Lipid profile: total cholesterol, HDL cholesterol, LDL cholesterol, triglycerides
- Cardiovascular history: stent, coronary artery bypass graft, mesenteric ischemia, stroke, peripheral artery disease.
ACR: albumin/creatinine ratio
BMI: body mass index
CABG: coronary artery bypass graft
DBP: diastolic blood pressure
F: female
M: male
RFM: relative fat mass
SBP: systolic blood pressure
Declarations:
Ethics approval: approved by the ethics committee of Hôtel-Dieu de France Hospital and the Faculty of Medicine of Saint Joseph University.
Consent for Publication: not applicable
Availability of Data and material: The datasets used and/or analyzed during the current study available from the corresponding author on reasonable request.
Competing interests: the authors declare that they have no competing interests.
Funding: None
Authors’ contribution: GH and IJ wrote the manuscript and established the research plan. DA, GHajje, GHalabi, MHGY, RM and SJ helped in the collection of the data required from each patient. GS analyzed and interpreted the data collected. All authors read and approved the final manuscript.
Acknowledgements: Not applicable
Dear Editorial Team, Clinical Medical Reviews and Reports. My experience with the journal was highly positive. The peer-review process was rigorous, constructive, and completed in a timely manner. The reviewers provided valuable comments that helped improve the quality and clarity of our manuscript. The editorial office was professional, responsive, and supportive throughout all stages of the publication process. Communication was clear and efficient, and any questions were addressed promptly. Overall, I found the journal to maintain high scientific standards and an excellent publication workflow. I would be pleased to consider submitting future work to this journal. Best wishes from, Elena Popa.

It was my pleasure to submit my testimonial concerning the Reviewer Board of our Scientific Journal “Brain and Neurological Disorders”. The Reviewers focused on some modifications and their contribution was helpful. The ladies of our Editorial Office were also supported my efforts. It was my honor to have such a co-operation and I am looking forward for more collaboration.

Dear Grace Pierce, Editorial Coordinator of Journal of Clinical Research and Reports, Thank you for the speedy and efficient peer review process. I appreciate the fact that your peer reviewers do not take months to respond like with some other journals. I would also like to thank the editorial office for responding quickly to my questions. It is an excellent journal. I plan to submit more manuscripts in the future. Best wishes from, Robert W. McGee

Dear Grace Pierce, Editorial Coordinator of Journal of Clinical Research and Reports, Working with you and your team on our recent publication in JCRR has been a truly wonderful and enjoyable experience. The responses were prompt, and the reviewers were patient, constructive, and highly professional. One reviewer in particular gave me the feeling that a professor was carefully reading and commenting on my coursework, which was deeply touching. The entire process was straightforward and hassle‑free, with no tedious online forms to complete. I highly recommend this journal. Best wishes from, DR Aibing Rao, Head of R&D

I Appreciate the Opportunity to Share my Experience with the Journal of Clinical Research and Reports. The peer review process was timely and constructive, and the feedback provided helped improve the quality of our manuscript. The editorial office was professional, responsive, and supportive throughout the process, ensuring smooth communication and efficient handling of the submission. Overall, it was a positive experience collaborating with your team.

Dear Mercy Grace, Editorial Coordinator of Obstetrics Gynecology and Reproductive Sciences, We would like to express our gratitude for your help at all stages of publishing and editing the article. The editors of the magazine answer all the necessary questions and help at every stage. We will definitely continue to cooperate and publish other works in the Obstetrics Gynecology and Reproductive Sciences! Best wishes from, Alla Konstantinovna Politova,
