
Research Article | DOI: https://doi.org/10.31579/2690-1919/169
1 Genie Biomedical Laboratory (GBM), Faculty of Technology, University of Abou. Bakr. Belkaid, Tlemcen, Algeria.
*Corresponding Author: S.M Debbal, Genie Biomedical Laboratory (GBM), Faculty of Technology, University of Abou.Bakr.Belkaid, Tlemcen, Algeria.
Citation: F. Medjahed, A. Mokdad, S.M Debbal, (2021). Realization of a Device for the Evaluation of the Muscular Effort through the Electromyogram Signal Emg. J Clinical Research and Reports, 8(1); DOI:10.31579/2690-1919/169
Copyright: © S.M Debbal. This is an open access article distributed under the Creative Commons Attribution License, which permits unrestricted use, distribution, and reproduction in any medium, provided the original work is properly cited.
Received: 05 May 2021 | Accepted: 12 May 2021 | Published: 20 May 2021
Keywords: electromyogram (EMG); surface electrodes; instrumentation amplifier; arduino card; PC; matlab; frequency
In this work, a device for the evaluation of the muscular effort through the electromyogram signal is produced. This device consists essentially of three parts: the sensor part, the shaping portion, the acquisition part and the software part. The sensor part allows the EMG signal to be collected by means of surface electrode. The shaping port is realized based on an instrumentation amplifier. The acquisition part concerns the analogue digital conversion and the transfer of the digital data to the pc; this is done via an arduino card, which is equipped with a microcontroller for the visualization in real time and the storage of the EMG signal on the pc on which the processing logitiels will be implemented. The signal thus processed must be displayed with the data allowing the evaluation of the effort on the monitor of the pc through a graphical interface; these are the different steps that are carried out to finalize this work.
In order for movement to occur, the muscles, bones, tendons and ligaments must all work together in response to signals from the brain [1].
The musculoskeletal system, consisting of muscles, bones and joints, requires special attention and care; otherwise stiffness, stiffness, contractures, pain and inflammation will become the companions of ill-adapted and poorly prepared physical activity had not the opportunity to feel the painful consequences of an unusual gesture. To help the doctor to assert the existence or not of a muscular pain, the electromyography is particularly useful in the assessment of certain muscular deficits in order to evaluate this muscular effort. This is the goal of this project of end of studies. In fact, the goal is to make a device that allows the detection of the signal Electromyogram (EMG), its shaping and its treatment to assess the muscular effort.
Electromyography is the study of muscle function through the inquiry of the electrical signal the muscles emanate [2]. This signal is detected through electrodes that must be properly arranged on a muscle. However, the signal detected is very low level and embedded in different kinds of noise, it is necessary to amplify and filter it to be exploited. However, and in order to evaluate the effort through this signal, digital processing is necessary. To carry out this processing, it is essential to scan it and transfer it to a PC on which the processing software will be implemented. The signal thus processed must be displayed with the data enabling the evaluation of the effort on the monitor of the PC through a graphical interface. These are the different steps that must be carried out to finalize this device.
1. Acquisition of EMG signal:
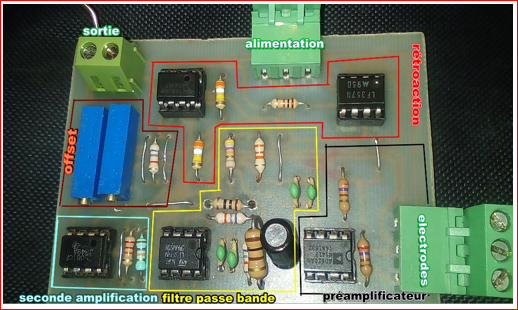
The EMG signal once detected and formatted is digitized for transmission to the PC for digital processing and display. The card used for this scan and interface with the PC is the ARDUINO-UNO card. However, since the analog inputs of the card accept only unipolar signals, an offset circuit has been realized. This circuit shifts the EMG signal between 0V and a maximum of 5V [3]. Open source ARDUINO software has been formatted to allow acquisition of the EMG signal. The key in this formatting of the PC acquisition and interface software is the choice of the input port, and the frequency and sampling. The selected port is port A0; however, the sampling frequency is chosen according to the maximum frequency of the EMG signal which is about 500 Hz. The frequency is then fixed at 1000 Hz [4]. (Figure 1) below shows the picture of the device made.
2. Acquisition of the EMG signal through the Arduino acquisition board:
The EMG signal thus obtained is applied to the Arduino acquisition board via the analog input A0 to be digitized and transferred to the PC for digital processing. (Figure 2) shows a picture of the realized device connected to the PC.

The EMG signal thus digitized and transferred to the PC or it can be viewed on the serial monitor of the Arduino IDE [5] as values or on serial plotter as a graph (see figure 3)

3. EMG signal processing and analysis:
The EMG signal once acquired is processed and analyzed. Digital processing is particularly relevant to spectral analysis and envelope detection, but the analysis concerns the evaluation of the spectral content and the envelope respectively for different EMG cases depending on the size and age of the subject. The intensity of the effort applied. However, and for a comprehensible representation of the EMG signal on the graphical interface (i.e. amplitude in volts and duration depending on time), normalization step has been developed to convert the values of the samples into volts and their variation in depending on the sampling frequency in time.
3.1. Normalization:
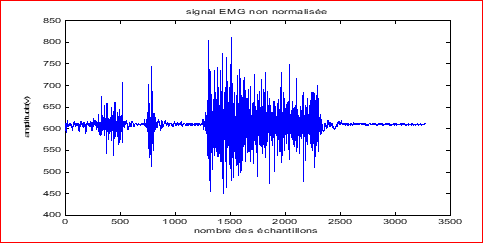
The (Figure 4) below describes the EMG signal collecting activity on the muscle of an exerting arm. It is a signal drawn directly by using the samples acquired through the acquisition card (after offset circuit) at the sampling frequency. It is considered as non-standardized EMG signal. For a more understandable representation this signal is normalized through the routine described below.
To normalize our signal it is necessary to go through three operations:
After applying these operations our signal will be normalized. The standard EMG signal is shown in (Figure 5).

3.2. EMG signal envelope detection:
In order to evaluate the intensity of the effort through the EMG signal, the signal envelope is detected. This is detected through the development of a Matlab environment routine. This routine first allows a correction of the signal (rectification) then a low pass filtering with a cut off frequency suitably chosen [6]. In fact, the choice of the cutoff frequency depends on the high frequencies present in the rectified signal. On this subject, after rectification different cutoff frequencies of the low pass filter (the low pass filter chosen in our case is the Butterworth filter) [7] were tested to finally choose the most appropriate frequency.
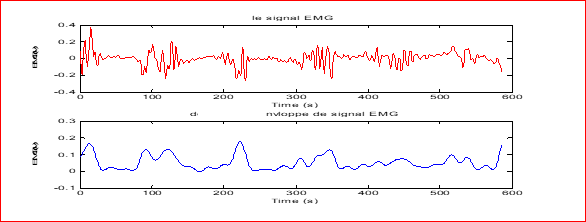
From the cutoff frequency test results, it is clear that low pass filter with the cutoff frequency of 40 Hz, generates the most significant envelope. However, for the case of the 10Hz and 20Hz cutoff frequencies, the detection is very vague, and for 100Hz the generated signal is similar to the original signal. The filter with the cutoff frequency of 40Hz is then used for further analysis of the effort.
3.3. Spectral analysis:
In order to evaluate the variation of frequency content as a function of the effort. It returns to make a spectral analysis of a signal that identifies each of these frequency components and their respective importance. What is called "importance" is the amount of energy (or power) that each frequency component carries.
Fourier analysis is one way to do this analysis. It allows a signal to be broken down into a sum of particular elementary (sinusoidal) signals with adequate coefficients. It makes it possible to associate with the usual '' waveform '' the complementary representation in the frequency domain. This decomposition is obtained on the discrete signals through the Discrete Fourier transform TFD. It is obtained through a known calculation algorithm by fast Fourier transform (FFT). This is a particular DFT calculation algorithm. It is essentially based on the following constraint: the number of samples is imposed to be of the form2i.
N=2i (1)
We know that the calculation of DFT is associated with the calculation of the following sum:
σk

= n=0N-1Snejk2nN

---- (2) [8].
This computation has N multiplications between Sn and complex exponentials, and N additions in total; the calculation of the most penalizing multiplications in term of duration. However, the imposed constraint makes it possible to simplify and accelerate their calculation.
The FFT is applied to the EMG signals in order to analyze the spectral content to assess the effort with respect to the frequency content [9].
4. Measurements of muscular effort:
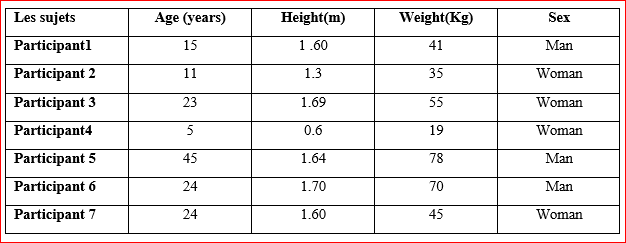
In this part we made spectral analysis on seven participants to compare the frequency content between them in the cases: rest, average and with a strong muscular effort, the following (Table 1) describes the information of each participant (age, height, weight, sex).
We measured the EMG signal of each in three cases, the first at rest (the volunteer releases his arm), then a contraction lasting a few seconds or a half seconds, after a slow or rapid effort also lasting a few seconds.
Participant 1:
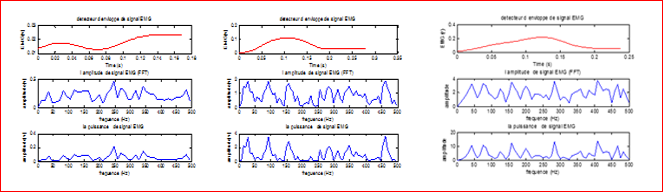
This experiment on young 15 years where he made the three cases at the same time, we detected the envelope of its signal EMG then the spectral analysis.
Participant 2:

Participant 3 :
Participant 4:

Participant 5:
Participant 6:

Participant 7 :
In our project, seven treated subjects participated in the study to make measurements after having informed consent about the safe procedure associated with the study. They were instructed to perform voluntary contractions of the biceps. Surface EMG signals were collected from the arm muscles. The power of the signals (from the spectrum) was then analyzed to evaluate the effort by taking into account physical variations such as height and weight, and it was noted that the latter directly influenced muscular effort.
A power spectral analysis was performed to determine the characteristics of the EMG in the muscles concerned to evaluate the muscular effort in order to examine the relationship between the spectral parameters and the contraction levels.
What we can notice is the specificity is due to the variations existing between the individuals, among which we find the physical variations (ex: the size, the weight, the corpulence).
According to the individuals, the same information does not indicate the same interpretation.
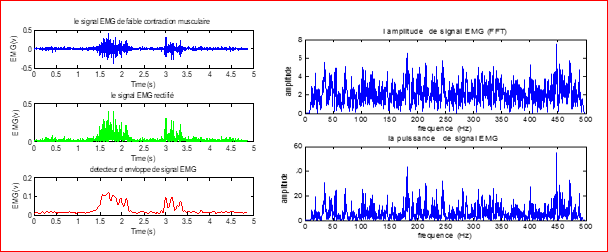
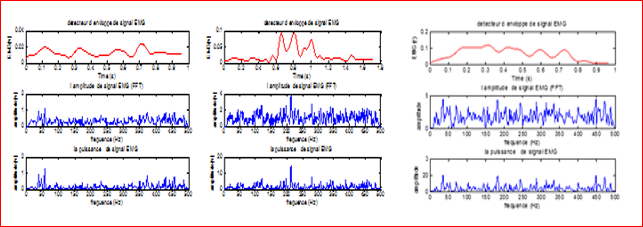
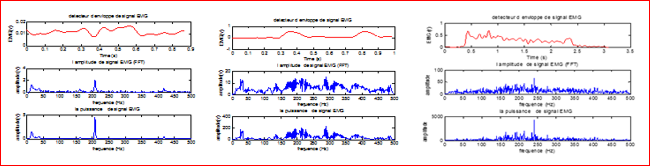
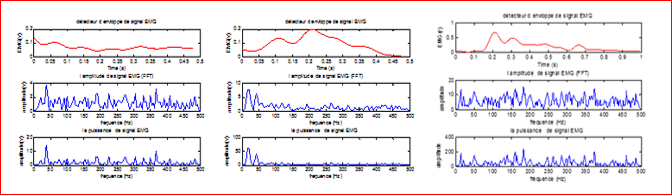
The envelope detector
The representation of the signal envelope allows a pleasant visualization of the periods of activation of the muscle.
During a very strong effort the seven subjects presents the same reponse that is to say the intensity of the signal increases.
As muscular contraction intensity increases, each UM is recruited at a higher frequency and the number of UMs recruited also increases, which leads to an enrichment in PUMs of the recordings.
Signal amplitude (FFT):
These lines will be reinforced with a much more remarkable effort.
the frequency content of the EMG signal changes according to a variable set such as the physical variations of the subject (age, height, weight ...), good analog and digital filtering, the health of the subject, the right way to make a contraction and the good EMG signal acquisition.
Through the envelope we can appreciate the effort. Indeed the amplitude of this envelope reflects the intensity of the effort, and its duration the duration of the effort.
The muscular effort is also analyzed through the Fourier transform (spectral analysis) to determine the frequency content and therefore evaluate its variation as a function of the effort.
It can clearly be noted that the envelope detection and the analysis of the frequency content of the EMG signal allowed us to evaluate the muscular effort.
In this work, we are interested in the practical theoretical study and realization of a device for the evaluation of the muscular effort through the signal Electromyogram EMG.
The approach that has been adopted for the realization of this project is that used by an engineer in the design, development and realization; namely to establish a specifications, see and study the different circuits that can be used, and finally the practical realization.
Thus, first a bibliographic research study was conducted. Through this study, the Electromygraphic signal has been described from its source at the cellular level to its appearance on the surface of the skin. This study was followed by a theoretical study of the circuits that can be used to detect, format and acquire the EMG signal. Thus, theoretical notions about sensors, instrumentation amplifier, filtering and acquisition have been recalled. The manuscript was finalized by our own contribution namely the practical realization of the device allowing the evaluation of the muscular effort through the EMG.
Thus, the device made enables the detection of the EMG signal, its shaping, and its acquisition through an ARDUINO acquisition card to a PC, and its digital processing to evaluate the muscular effort. This digital processing was mainly frequency analysis and envelope detection, or the results obtained showed that the frequency content as well as the signal envelope changed according to the effort. These results as well as the EMG signal are displayed on a graphical interface that has also been developed in this work.
Dear Editorial Team, Clinical Medical Reviews and Reports. My experience with the journal was highly positive. The peer-review process was rigorous, constructive, and completed in a timely manner. The reviewers provided valuable comments that helped improve the quality and clarity of our manuscript. The editorial office was professional, responsive, and supportive throughout all stages of the publication process. Communication was clear and efficient, and any questions were addressed promptly. Overall, I found the journal to maintain high scientific standards and an excellent publication workflow. I would be pleased to consider submitting future work to this journal. Best wishes from, Elena Popa.

It was my pleasure to submit my testimonial concerning the Reviewer Board of our Scientific Journal “Brain and Neurological Disorders”. The Reviewers focused on some modifications and their contribution was helpful. The ladies of our Editorial Office were also supported my efforts. It was my honor to have such a co-operation and I am looking forward for more collaboration.

Dear Grace Pierce, Editorial Coordinator of Journal of Clinical Research and Reports, Thank you for the speedy and efficient peer review process. I appreciate the fact that your peer reviewers do not take months to respond like with some other journals. I would also like to thank the editorial office for responding quickly to my questions. It is an excellent journal. I plan to submit more manuscripts in the future. Best wishes from, Robert W. McGee

Dear Grace Pierce, Editorial Coordinator of Journal of Clinical Research and Reports, Working with you and your team on our recent publication in JCRR has been a truly wonderful and enjoyable experience. The responses were prompt, and the reviewers were patient, constructive, and highly professional. One reviewer in particular gave me the feeling that a professor was carefully reading and commenting on my coursework, which was deeply touching. The entire process was straightforward and hassle‑free, with no tedious online forms to complete. I highly recommend this journal. Best wishes from, DR Aibing Rao, Head of R&D

I Appreciate the Opportunity to Share my Experience with the Journal of Clinical Research and Reports. The peer review process was timely and constructive, and the feedback provided helped improve the quality of our manuscript. The editorial office was professional, responsive, and supportive throughout the process, ensuring smooth communication and efficient handling of the submission. Overall, it was a positive experience collaborating with your team.

Dear Mercy Grace, Editorial Coordinator of Obstetrics Gynecology and Reproductive Sciences, We would like to express our gratitude for your help at all stages of publishing and editing the article. The editors of the magazine answer all the necessary questions and help at every stage. We will definitely continue to cooperate and publish other works in the Obstetrics Gynecology and Reproductive Sciences! Best wishes from, Alla Konstantinovna Politova,
