
Research Article | DOI: https://doi.org/10.31579/2693-4779/112
IAE, 175-28, Goan-ro 51 beon-gil, Baegam-myeon, Cheoin-gu, Yongin-si, Gyeonggi-do, 17180, Korea.
*Corresponding Author: Dong-Chan Lee, IAE, 175-28, Goan-ro 51 beon-gil, Baegam-myeon, Cheoin-gu, Yongin-si, Gyeonggi-do, 17180, Korea.
Citation: Dong-Chan Lee. (2022) Quantitative Measurement and Estimation of Gait Postural Kinematics and Balance. Clinical Research and Clinical Trials. 6(3) ; DOI: 10.31579/2693-4779/112
Copyright: © 2022 Dong-Chan Lee, This is an open access article distributed under the Creative Commons Attribution License, which permits unrestricted use, distribution, and reproduction in any medium, provided the original work is properly cited.
Received: 15 September 2022 | Accepted: 21 September 2022 | Published: 29 September 2022
Keywords: gait postural kinematics; gait postural balance; kriging model; statistical estimations
The function of gait is to move the body from one point to another, and at this time, the body weight is naturally transferred from one lower limb to the other. Gait postural analysis is to analyze the behavior of each joint and muscle during walking and measure the ground reaction force. Deformation of the lower extremities due to anatomical or neurological abnormalities results in abnormal pathological gait. At this time, the hip, knee, and ankle joints may exhibit secondary pathological movements due to not only primary abnormalities in each joint but also other adjacent joint abnormalities. When a characteristic gait pattern appears compared to normal gait, a relaxed pathological gait can be observed for neuromuscular diseases that have influences on muscles or joints. In this point, a three-dimensional and systematic quantitative analysis of pathological gait is necessary because the motion analysis test can detect changes in the transverse plane as well as in the coronal and sagittal planes.
In this research, kriging model that can represent both interpolation and regression has been used for the estimations of gait postural kinematics and balance in the clinical data. Through the statistical model called to Kriging model, the characteristics of gait postural kinematics can be investigated for more clinical implications. The performances of kriging model are compared with those of interpolating the numerical function with error of normal distribution type. As an application of the newly proposed approach, the response of a gait postural model with numerical estimation error is predicted based on sampling data. If more sampling data and more clinical correlations, it can be verified that the ergonomic kriging model can predict a gait postural response with the deviation of ergonomic parameters from its normal behavior.
The function of gait is to move the body from one point to another, and at this time, the body weight is naturally transferred from one lower limb to the other. Gait postural analysis is to analyze the behavior of each joint and muscle during walking and measure the ground reaction force. Deformation of the lower extremities due to anatomical or neurological abnormalities results in abnormal pathological gait. At this time, the hip, knee, and ankle joints may exhibit secondary pathological movements due to not only primary abnormalities in each joint but also other adjacent joint abnormalities. Therefore, for the treatment of pathological gait, a systematic study on gait patterns characteristically observed in each disease is required after understanding normal gait. In order to understand normal gait, a comprehensive understanding including not only kinematics and kinetics, but also gait energy consumption, muscle contraction pattern, and neuromuscular transmission system is required. When a characteristic gait pattern appears compared to normal gait, a relaxed pathological gait can be observed for neuromuscular diseases that have influences on muscles or joints. In this situation, a three-dimensional and systematic quantitative analysis is necessary because the motion analysis test can detect changes in the transverse plane as well as in the coronal and sagittal planes. [1,2]
Gait and balance disorders are one of the representative neurological symptoms that can appear in movement disorders including musculoskeletal disorders, stroke, and peripheral nerve disorders. Clinically, gait disorders are identified by experienced neurologists observing and diagnosing gait and balance disorders. Because gait is complicated by neuroanatomical physiology, the pathology of normal gait and pathological gait has not been accurately analyzed. In addition, for normal posture maintenance and gait, neurological functions as well as musculoskeletal system, vestibular function, cognitive function, and pain. It is possible only when the symptoms related to the disease act in combination. Therefore, when any one of several anatomical functions is abnormal, gait disturbance occurs, and one gait disturbance can occur due to abnormalities in several functions. Because of the characteristics of gait and balance disorders, subjective experience in the diagnosis worked a lot, and only experienced specialists were able to observe gait and balance disorders. However, due to the recent development of various diagnostic technologies, objective analysis of gait and balance disorders, which were considered the exclusive domain of experienced professionals, is now possible, and quantitative analysis of gait and balance disorders is now being realized by various studies. Recently, an analysis method for gait disturbance and balance disorder will be introduced, and an analysis method with clinical usefulness will be investigated.
In order to solve these time and technical constraints, the meta-model in the clinical analysis, which is easy to link within the design framework, is a mathematical model based on statistical theory and sample data based on the
design of experiments can be verified their accuracy through an error validation technique. Among them, the error verification method checks the accuracy of the estimated meta-model and determines the minimum number of sample points used in the clinical meta-model. Statistical theory acquires the information through statistical analysis of sample data selected through sampling design in the population and makes decisions of the feasibility of design space of gait postural mechanism. Therefore, an efficient sensitivity verification method uses only the statistical information provided by the kriging meta-model. [3,4]
Kriging interpolation can be divided into a point estimation method that calculates the predicted value of a single point and a region estimation method that predicts the average value of a certain area. The area estimation method is easy to apply when the amount of change in physical properties in a wide area is small. The point estimation method can be further divided into a simple kriging interpolation method and a regular kriging interpolation method, and can be distinguished depending on whether there is a bias between the data value and the estimated value. Since the regular kriging interpolation method applied in this study includes the condition of unbias, it provides more accurate prediction values than the simple kriging interpolation method. Prediction through kriging interpolation requires several steps of data transformation compared to the relatively simple least squares method. Kriging interpolation proceeds as shown in Figure. 1. [5,6] The kriging interpolation method predicts the value of the prediction point, that is, the location of the data, the distance between the prediction point and the data point, and the degree of variance between the data values at each data point. It constructs a relationship between the design variables and corresponding responses using relatively few sampling points and the original complex model is effectively replaced by a transfer function called response surface. Therefore, it can be said that the definition of the sample space for collecting data values is a very important part that affects the degree of future prediction values. In order to give weight to the data values used through the kriging interpolation method, each data value should be expressed as a relationship between distance and variogram. Since the variogram between data values is expressed as a function of distance, the most important factor in assigning weights is the separation distance between data points. [6]

Figure 1: Flowchart of design process based on the Kriging Interpolation Method
2. Kriging Meta model for Gait Postural Estimation
2.1 Acquisition of Clinical Sampling Data
Since this study confirms the application of the sensitivity verification method according to the increase of the clinical sample points based on the sequential design of experiment method is performed. [2, 6] The minimum distance maximization method is a sequential design of experiment method that selects a sample point  that maximizes the minimum distance between any two sample points from the existing sample point
  .
.
 (1)
(1)

where,  represents one of m newly selected sample points,
  is the sum of l existing sample points and newly selected sample points, and
  represents one of
  . The maximum entropy approach was proposed to define the amount of information that can be obtained from one experiment as entropy and maximize it. [1,2]
This is to select  , which has the largest entropy, when the kriging meta model is constructed with the existing sample point
  and the new sample point
  .
.
 (2)
(2)
where,  and
and  are the correlation matrix and
  matrix of the Krigging metamodel composed of the existing sample points and the added sample points.
2.2 Kriging Meta Model
Meta-models are largely classified into regression models and interpolation models. Since the regression model does not pass the response value at the sample point, it is widely used in experiments with small nonlinearity or physical experiments where experimental errors exist. On the other hand, the interpolation model passing the response value at the sample point has strong nonlinearity and is widely used in experiments that give the same response to the same input. The Kriging meta-model calculates the actual function to be estimated as the sum of the global model  corresponding to the mean and the local model
  corresponding to the deviation, as shown in Equation (3). [5,6]
 (3)
(3)
where,  is a polynomial function vector,
  is a vector of estimated coefficients,
  has a probability distribution defined as having a mean of 0 and covariance as in Equation (4).
 (4)
(4)
where,  is a correlation matrix indicating the correlation between two sample points
  and
and  , and is defined as follows.
 (5)
(5)
where d is the number of spatial variables, and unknown  is the correlation coefficient that determines the degree of correlation between sample points
The Kriging meta-model is a linear predictor generated from experimental data and is expressed as follows.
 (6)
(6)
where  , and
, and  represents the correlation vector between the prediction point and the sample points.
The variance, which is the parameter in Equation (4), can be replaced with the variance estimated with n data as follows.
 (7)
(7)
In Equation (6) representing the kriging meta-model, the unknown is the correlation coefficient  in Equation (5), and is calculated as follows by maximum likelihood estimation (MLE), a statistical estimation method.[6]
 (8)
(8)
2.3 Statistical Verification of Gait Postural Data
The verification method is classified according to the characteristics of the regression model and the interpolation model. In the case of a regression model such as a response surface model (RSM), since the response value at the sample point is not passed, the R-square value or R-adjust value obtained by comparing the response value at the sample point is used. Thus, the accuracy of the model can be judged. However, in the case of the interpolation model, it is impossible to compare the response value with the actual response value at the sampling point because the response value passes through the sample point. Therefore, to verify the accuracy of the interpolation model, complex calculations are required, and various verification methods have been developed. Among them, an easily applicable verification method includes a method of additionally generating verification points to obtain the mean error, root mean square error, and maximum error. The most commonly used mean square error is defined as follows. [6]
 (9)
(9)
These verification methods are a method of evaluating the accuracy of the meta-model by creating additional verification points to evaluate the error and using the difference between the actual response and the predicted response. Therefore, it cannot be used when it takes a long time and computational cost to interpret once, or when additional response information is limited.
A cross-validation method is representative of a verification method that does not require additional experimental points. The cross-validation method divides the total number of sample points ny selected to construct the meta-model into nc for reconstructing the meta-model and ny for validation points to evaluate the error of the meta-model, and reconstructs the meta-model using sample points nc. This is a method to evaluate the error with respect to the sample point ny afterward.
The biggest advantage of the cross-validation method is that it does not need to create a separate verification point, which means that additional analysis is not required to verify the meta-model. However, even though it is an accurately approximated model, as a result of cross-validation, if the sensitivity of the meta-model to the sample points for verification is high, it may be evaluated as an inaccurate model. In this study, it is efficient using only the sensitivity information provided by the kriging meta-model, and when applying the sequential kriging meta-model, a sensitivity verification method that can be used as an end condition of the experiment is used.
The Kriging meta-model provides not only the predicted response for random prediction points, but also the sensitivity at sample points and prediction points by defining the relationship between design variables and responses instead of repeatedly analyzing complex simulation models for a long time. In general, sensitivity is a partial differential value for a design variable as shown in the following equation.
 (10)
(10)
In the kriging meta model, F, R, Y are matrices determined by sample points and function values. Therefore, the terms related to the design variable x are  and the formula is as follows.
 (11)
(11)

where, x represents an arbitrary prediction point within the design area, and ,  and
and  are constant vectors determined by the sample points and their function values. By finding the partial derivatives of
  and
and  terms, the sensitivity of the following kriging meta-model can be obtained.
 (12)
(12)

The convergence conditions are as follows.
 (13)
(13)
Where,  creates a kriging metamodel with
  sample points, the sensitivity at
  sample points, and the point at which sample points are sequentially generated and
  is derived from the sensitivity of
  sample points.
What the above convergence condition means is that as the model becomes more accurate, the change in the model decreases and the difference in sensitivity converges to 0 and applied to the verification method. It is judged that convergence is achieved when the above convergence conditions are satisfied 3 times in a row, and since the sensitivity is derived as much as the number of design variables, the number of converged sample points may differ for each design variable. In this case, the maximum value among the number of final converged sample points was used. If the kriging meta-model satisfies the above conditions for 3 consecutive times, the kriging meta-model will not change significantly. The biggest advantage of the sensitivity verification method is that it can judge the accuracy of the meta-model without additional analysis, creation of additional verification points, or reconfiguration of the meta-model.

(a) Sample distribution by clinical sampling points (b) Sample distribution by kriging interpolation
Figure 2 : Analysis of characteristic values according to design variable
2.4 Steps for Ergonomic Kriging Model
Step 1: Selection of Sampling points and Arrangement of Experiments
For the sampling point generation method, an appropriate method should be selected from the full combination method, Latin hypercube, orthogonal arrangement table, depending on the analysis time. In this study, the Latin hypercube sampling method was used to maximize the minimum distance between test points. The formula is as follows.
 (14)
(14)
where  is the distance among sampling points
  and
and  .
.
Step 2: Implementation of Matrix Experiments
In step 1, a finite element analysis is performed on the combination of sample points generated by Latin hypercube to calculate the reaction value, weight, stress, displacement, and stiffness for each load condition.
Step 3: Configuration of Kriging Model
Based on the results of the finite element analysis performed in step 2, we define a kriging approximation model for the weight and stress, displacement, and stiffness for each load condition.
Step 4: Validation of the Kriging Model
Since the kriging model is an approximate model constructed based on the response values of the sample points, it always has an error with the actual model. Several indices have been introduced to verify such approximate models. In this study, the indices of eq. (13) are used.
Step 5: Sequential Sampling Application
When the accuracy of the kriging approximation model is not satisfactory, sample points are added using a sequential experimental design. Then, after going back to step 3 and reconstructing the kriging approximation model for each response, the validity of the kriging approximation model reconstructed in step 4 is reviewed. This process is repeated until the reference value is satisfied
Step 6: Estimations based on Kriging Model
Estimations is performed with the kriging approximation model defined in step 5. That is, the formulation of the general predicted design can be modified as follows using the Kriging approximation model.
 (15)
(15)

3. Gait Postural Analysis and Results
3.1 Gait Postural Analysis
Gait Physiology The first study to analyze gait was a method of studying the composition of gait by recording video. The composition of gait can be basically divided into a spatio-tempral parameter called the gait linear index and a kinematic parameter that measures the angle for each joint. The spatiotemporal element is the most basic component of gait. It consists of a stance phase and a swing phase, and ensures a stride length from one heel to the next heel and from one heel to the other. It consists of step width, steps per minute divided by cadence, and walking speed divided by stride length. Also, a double support in which both feet support the ground is called a double support, and a support in which only one foot is supported is called a single support (Figure. 3). The kinematics elements measure the angle of movement of each joint in the sagittal plane and measure the angles of the shoulder, elbow, wrist, hip, knee, and ankle joints. In addition, the kinetic parameter can measure the force acting on the joint and the degree of postural stability by measuring the pressure transmitted to the sole. [7~12]

Figure 3 : Parameters of gait cycle. gait parameters consist of stance phase. swing phase, double support and sign support. Stride length is defined as the length from initial heel contact to next ipsilateral heel contact. Step length is defined as the length from heel contact to next contralateral heel contact.
Lab-Based Gait Analysis Various devices have been developed and commercialized for gait analysis, and are widely used in rehabilitation or sports fields before neurological diseases. The representative device is a three-dimensional gait analysis device using infrared detection, which is the most precise analysis method among existing devices. and kinematic parameters (Figure. 4). [13]
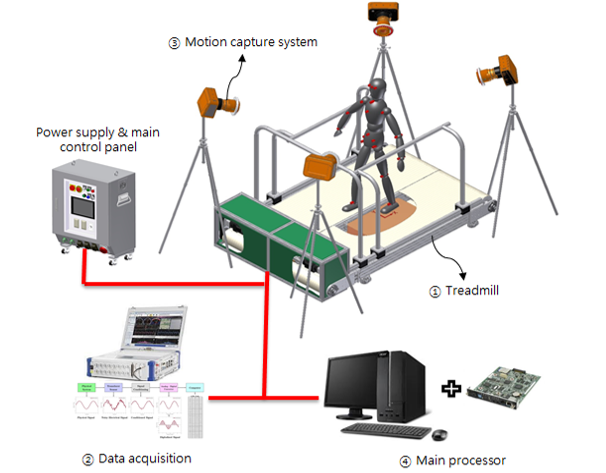
Figure 4: Schematics of developed 3-Dimensional Motion Capture
The advantage of 3D gait analysis is that it is evaluated as the most precise device due to the vast amount of data collected, and it can measure not only the sagittal plane, but also the coronal plane and the transverse plane. can be observed. In addition, it is the only test that can measure the kinematic factors that are movement for each joint. However, for the inspection, a space of at least 6 meters is required to collect the reflected infrared rays, and there is an inconvenience in that the examinee has to take off his clothes to attach the marker. There is a disadvantage in that it is difficult to know the overall change of gait because only one cycle in the middle of 6 meters can be analyzed. To compensate for these shortcomings, a widely used gait analysis device has been developed to quantify the spatiotemporal elements by measuring the pressure of the feet. can be saved It is reported that this information shows almost the same accuracy as the result of 3D gait analysis. However, since only spatiotemporal elements can be measured, there is a disadvantage in that three-dimensional walking state and kinematic elements cannot be measured.
As the most common clinical test, gait analysis has been widely used in various neurological diseases. Musculoskeletal disorders are degenerative diseases with symptoms such as tremor, rigidity, locomotion, and gait disturbance, and gait disturbance is the most important symptom. In patients with musculoskeletal disorders, changes in spatiotemporal elements were clearly observed compared to normal subjects, and it was observed that the kinematic elements were also significantly lowered. Arm movement can also be quantified by 3D gait analysis, so we observed asymmetrical decline in arm movement, an early symptom of Parkinson's disease. This can be confirmed by analyzing the gait pattern that the gait worsens as the cognitive function decreases.
Wearable Gait Analysis In order to overcome the spatial limitations of laboratory-based gait analysis devices, wearable devices are recently in the spotlight. Wearable devices have been widely used in the fields of normal movement, rehabilitation, and sports as well as medical care in line with the recent 4th industrial craze. Wearables are often equipped with an accelerometer to analyze the acceleration of the movement and quantify the movement. There are few clinical applications being attempted. The greatest strengths of wearable devices are that they are inexpensive and easy to wear, can be applied to real life rather than laboratory-based, can record long-term gait, and can measure temporary and intermittent gait disorders rather than continuous gait disorders. points, etc. In addition, not only the acceleration sensor but also the gyro-sensor is being applied, so it is possible to measure not only the magnitude of simple speed movement but also information about the position. However, there are still many experimental stages, and the reliability or validity of the test device has not been fully proven for medical use, so it is an area that requires follow-up research. [7~12]
The most useful part of wearable devices is gait freezing, which is a representative gait disorder in Parkinson's disease. Gait freeze is irregular and temporary, and is often induced in daily life, so it is not observed well in laboratory-based gait analysis. In order to overcome this limitation, algorithms such as a method of measuring the frequency of trembling, which are characteristically seen during gait freezing, and a support vector machine that analyzes a spectrum have been tried, and an acceptable level of accuracy is used. have. Wearable devices are reported to be able to measure gait freezing in daily life at home rather than in a laboratory, so they can be used for patient-specific treatment. Because it can be easily worn for a long time as well as frozen gait, it is widely used in treatment evaluation for gait disorders. It can also be inserted into shoes, so you can get information about your daily gait patterns.
3.2 Postural Instability Analysis
Postural stability requires visual information and proprioceptive functions to act simultaneously. Neurological tests should be measured with relatively simple tests such as pull test, romberg test, and tandem gait. do. Postural instability is a symptom most closely related to falls, and there is no clinically important evaluation or quantification method, so various measuring devices and methods are used to overcome the limit of postural instability to the extent of classifying falls and non-falls. Quantification has become possible, and many research and clinical applications are in progress. [14~16]
Static Posturography The representative method is to stand on a footrest that measures pressure and measure the center of pressure or center of mass, and the method is to obtain and measure the diameter, area, or speed at which the center of pressure changes. to be. As mentioned above, several factors act on postural stability, so there are many limitations to simply measuring the center of pressure without external intervention. Therefore, when measuring static posture, an intervention that disturbs the visual information by closing and opening the eyes is necessary.
Dynamic Posturography In order to overcome the limitations of static posture measurement, various studies have been conducted, and methods such as shaking the body back and forth or measuring the center of pressure when the eyes are closed and opened were tried. Computerized dynamic posture measurement was developed to evaluate the degree of posture for each item by comprehensively intervening all factors related to postural stability. It was designed to measure the items involved in postural stability, and it was actually programmed and developed so that only the results analyzed from the clinician's point of view can be easily viewed.
Postural imbalance is closely related to the risk of falls due to musculoskeletal disorders and is useful as a predictor of falls, and can quantitatively evaluate vestibular and cerebellar functions. In addition, it is possible to quantify postural imbalance, which is difficult to confirm with a neurological examination.
4.1 Results and Conclusions
In the case of normal gait, each muscle shows a typical and constant EMG shape and changes according to the gait speed. Among the muscle movements that occur during walking, when the length of the muscle decreases and concentric contraction occurs, joint power is formed (power generation) and the body is accelerated. In addition, in case of eccentric contraction as the length of the muscle increases, joint work rate is absorbed (power absorption) and deceleration occurs, which contributes to maintaining stability during walking of each joint. Concentric contractions occur in the stance phase. The gastrocnemius and soleus muscles contract to release the heel, and the iliopsoas contract concentrically to bring the lower extremities off the ground during the final stance and pre swing phases, causing hip flexion to accelerate gait.
In terms of kinematics, angular rotation of the joint represents the movement of the lower extremity pelvis, hip joint, knee joint, and ankle joint during the stance and swing phases. Gait is observed in three-dimensional planes such as sagittal plane, coronal plane, and transverse plane, flexion and extension of each joint in the sagittal plane, abduction and adduction of the hip joint in the coronal plane. In cross-section, hip, tibia and foot rotation are measured. As a joint movement during walking, the movement of the pelvis is based on the connection plane between the left and right posterior superior iliac spines and the left and right anterior superior iliac spines. The movement of the pelvic long axis as viewed from the left and right connecting line of the pelvis is recorded in the sagittal plane, the movement of the left and right connecting axis of the pelvis as viewed from the anteroposterior connecting line is recorded in the coronal plane, and the movement of the anteroposterior and left and right connecting axes of the pelvis as seen from the long axis of the torso is recorded in the transverse plane.
The angle of the hip joint reflects the movement of the femur with respect to the pelvis. The movement of the long axis of the femur viewed from the left and right connecting lines of the pelvis is recorded in the coronal plane, and the relationship between the distal femur and the left and right connecting axes of the pelvis as viewed from the long axis of the femur is recorded in the transverse plane, respectively. The angle of the knee joint reflects the movement of the shin relative to the femur. The movement of the long axis of the shin as seen from the left and right connection line of the knee joint is in the sagittal plane, the movement of the long axis of the shin as seen from the anteroposterior connection line of the femur is in the coronal plane, and the relationship between the left and right connecting axes between the distal shin and the femur as seen from the long axis of the shin is in the transverse plane. Each is recorded. The angle of the ankle joint reflects the movement of the foot relative to the shin. The movement of the long axis of the heel viewed from the anteroposterior connection line of the shin is recorded in the coronal plane, while the plantar plane viewed from the left and right connecting axes of the foot is in the sagittal plane. The angle of movement of the foot means the angle between the long axis of the foot and the direction of gait. Therefore, the amount of deviation or change for the abnormal state is quantitatively indicated by comparing the variable representing the movement of each joint with the normal state, and the kinematic domain for the steady state and the abnormal state can be expressed using the kriging meta model.

(a) Range of Motion (Sagittal)

(b) Torque (Sagittal)

(c) Range of Motion (Coronal & Transversal)

(d) Range of Motion (Coronal & Transversal)
(Blue: baseline, Red: 5%, Green: 10%, Cyan 20?viations)
Figure 5: Gait Postural Estimation on the deviations of normal range
In this paper, we propose a method for detecting abnormal gait without prior knowledge of human gait abnormality, using the sequential kriging meta-model. By applying it to various mathematical functions and actual clinical sampling data, it can make the creation of additional prediction points and additional analysis of the simulation model, unlike the existing methods. Since the environmental factors related to the location and size of the design space can also have a great influence, these influencing factors additionally are needed in the clinical sampling. This study focuses on a low-cost, easy-to-use gait analysis system for clinical settings. The system is fully automated, so there are no markers or sensors on the patient's body, no calibration or manual intervention. It can detect abnormal gait and provide a normal index. In addition to screening for musculoskeletal disorders, clinicians should perform surgery, treatment, or follow-up for recovery of patients with musculoskeletal disorders.
This method can be applied to several gait types. (1) Describe the skeletal features that help distinguish between normal and abnormal gait, and (2) describe a simple gait cycle identification method. (3) A low-cost and easy-to-use Kinetic-based gait analysis for clinical environments is proposed. (4) Accuracy of abnormal gait detection can be confirmed by evaluating and comparing multiple gait types from multiple databases.
4.2 Discussions
Most technological advances have been developed enough to measure the gait and postural balance of various neurological diseases, but there is a limit to its immediate clinical application. Most of the gait analysis studies up to now are preliminary studies in the technical stage rather than by clinicians due to clinical needs. In order for a single medical measuring device to be used clinically, validation of validity and reliability should be preceded centering on the gold standard. However, the validity and reliability of the studies are not consistent. In addition, the measurement equipment and methods also differ from study to study, so there is no standardized method with reliability. In addition, most studies have been conducted with a small number of patients, so it is insufficient to evaluate the effectiveness. For gait analysis, too many devices or complex markers are attached or expensive equipment is often used. Considering the cost-effectiveness, clinical usefulness and commercialization potential beyond the research purpose are still unknown.
Finally, the advantage of gait or postural imbalance is the quantification of symptoms. It is possible to monitor the course of the disease, but considering the various characteristics of neurological diseases, only tests. Since they do not play an important role in diagnosis, they often serve only as an auxiliary function in diagnosis or treatment.
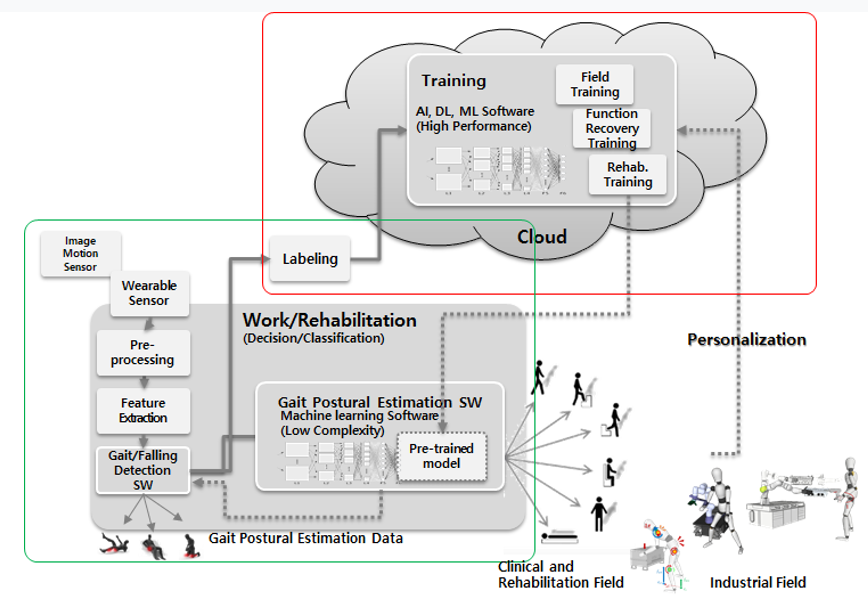
Figure 5: Extendibility of Gait Postural Analysis
This work was supported by the Technology Innovation Program (20019115) funded by the Ministry of Trade, Industry, & Energy (MOTIE, Korea)
Dear Editorial Team, Clinical Medical Reviews and Reports. My experience with the journal was highly positive. The peer-review process was rigorous, constructive, and completed in a timely manner. The reviewers provided valuable comments that helped improve the quality and clarity of our manuscript. The editorial office was professional, responsive, and supportive throughout all stages of the publication process. Communication was clear and efficient, and any questions were addressed promptly. Overall, I found the journal to maintain high scientific standards and an excellent publication workflow. I would be pleased to consider submitting future work to this journal. Best wishes from, Elena Popa.

It was my pleasure to submit my testimonial concerning the Reviewer Board of our Scientific Journal “Brain and Neurological Disorders”. The Reviewers focused on some modifications and their contribution was helpful. The ladies of our Editorial Office were also supported my efforts. It was my honor to have such a co-operation and I am looking forward for more collaboration.

Dear Grace Pierce, Editorial Coordinator of Journal of Clinical Research and Reports, Thank you for the speedy and efficient peer review process. I appreciate the fact that your peer reviewers do not take months to respond like with some other journals. I would also like to thank the editorial office for responding quickly to my questions. It is an excellent journal. I plan to submit more manuscripts in the future. Best wishes from, Robert W. McGee

Dear Grace Pierce, Editorial Coordinator of Journal of Clinical Research and Reports, Working with you and your team on our recent publication in JCRR has been a truly wonderful and enjoyable experience. The responses were prompt, and the reviewers were patient, constructive, and highly professional. One reviewer in particular gave me the feeling that a professor was carefully reading and commenting on my coursework, which was deeply touching. The entire process was straightforward and hassle‑free, with no tedious online forms to complete. I highly recommend this journal. Best wishes from, DR Aibing Rao, Head of R&D

I Appreciate the Opportunity to Share my Experience with the Journal of Clinical Research and Reports. The peer review process was timely and constructive, and the feedback provided helped improve the quality of our manuscript. The editorial office was professional, responsive, and supportive throughout the process, ensuring smooth communication and efficient handling of the submission. Overall, it was a positive experience collaborating with your team.

Dear Mercy Grace, Editorial Coordinator of Obstetrics Gynecology and Reproductive Sciences, We would like to express our gratitude for your help at all stages of publishing and editing the article. The editors of the magazine answer all the necessary questions and help at every stage. We will definitely continue to cooperate and publish other works in the Obstetrics Gynecology and Reproductive Sciences! Best wishes from, Alla Konstantinovna Politova,
