
Research Article | DOI: https://doi.org/10.31579/2768-0487/110
1 Resident Medical Officer, New Kamadhenu Hospital, Kolar. 563102. Karnataka. India.
2 Consultant Physician, New Kamadhenu Hospital, Kolar. 563102. Karnataka. India.
*Corresponding Author: Kalyani Raju, Consultant Pathologist, New Kamadhenu Hospital, Kolar. 563102. Karnataka. India.
Citation: Priyanka P. Kamarthi, Kamarthi P., Raju K., (2023), Profile of Haematological Parameters in Covid-19 Positive Cases -A Cross Sectional Study, Journal of Clinical and Laboratory Research. 6(2); DOI:10.31579/2768-0487/110
Copyright: © 2023, Kalyani Raju. This is an open-access article distributed under the terms of the Creative Commons Attribution License, which permits unrestricted use, distribution, and reproduction in any medium, provided the original author and source are credited.
Received: 11 July 2023 | Accepted: 24 August 2023 | Published: 31 August 2023
Keywords: blood group in COVID; COVID–19; ESR in COVID; haematological parameters; SARS–CoV–2
Introduction
Severe acute respiratory syndrome coronavirus 2 (SARS–CoV–2), a fast spreading and disastrous global pandemic. We have studied changes in haematology parameters in COVID-19 infected patients.
Objective / Aim: To assess haematological Parameters in COVID positive cases and analyse difference in profile of haematological parameters between categories of COVID positive cases.
Methods
This is a laboratory observation retrospective study. All COVID RT-PCR (Real Time Polymerase Chain Reaction) Positive cases from June 2020 to May 2022 was considered for the study. The haematology parameters of cases including blood group and ESR were captured from hospital records and analysed for the difference between mild (Category A), moderate (Category B) and severe cases (Category C). Statistical analysis was done using SPSS software version 22. p value less than 0.05 was considered statistically significant.
Results
Total WBC count, absolute neutrophil count (ANC), absolute lymphocyte count (ALC), absolute eosinophil count (AEC), absolute monocyte count (AMC), platelet count, neutrophil lymphocyte ratio (NLR), monocyte lymphocyte ratio (MLR), eosinophil lymphocyte ratio (ELR) and platelet lymphocyte ratio (PLR) between the three categories of cases were statistically significant. The commonest blood group was O positive and majority of O positive cases were in Category C. 81.9% cases tested for ESR showed raised ESR.
Conclusion
Haematology parameters can be considered to predict progression of the disease and assess prognosis in COVID-19 infection. Total WBC count, ANC, ALC, AEC, AMC, platelet count, NLR, MLR, ELR and PLR can be considered while monitoring COVID-19 cases.
Severe acute respiratory syndrome coronavirus 2 (SARS–CoV–2), a fast spreading and disastrous global pandemic [1]. In December 2019, an outburst of COVID-19 occurred, caused by SARS-CoV-2 in Wuhan, China and briskly infected people across the globe. The novel virus was named as SARS-CoV-2 2019 by World Health Organization (WHO) due to 79% resemblance with SARS-CoV [2]. Corona virus disease 2019 (COVID-19) clinical features ranges from flu-like symptoms to multiple organ failure and death [3]. Various studies have indicated that the haematological parameters are markers of disease severity and advocated that the parameters arbitrate the progression of the disease.[4] There are less published information about the changes in haematology parameters in COVID-19 infected patients.[5] Ministry of Health and family welfare guidelines has classified COVID-19 as Mild (Category A), Moderate (Category B) and Severe (Category C) categories. Category C COVID is defined as the patients having fever ≥38°C (100.4°F), respiratory rate (RR) >30 breaths/min; severe respiratory distress; or pulse oximeter oxygen saturation ≤90% in room air and neutrophil lymphocyte ratio (NLR) of >5. Category A patients are asymptomatic/patients with mild symptoms with RR <24>94% in room air and NLR 1-3. Category B patients are symptomatic patient with mild to moderate pneumonia with no signs of severe disease, RR 24-30/m or SPO2 90%-94% at room air and NLR 4-5.[6] Few studies have comprehensively analyzed haematological parameters among patients with Category A, B and C COVID-19 infection.[7] Various studies stated that decreased platelet count is associated with severe COVID-19 and a higher mortality rate.[8,9,10,11,12] So finding efficacious haematological parameters for risk stratification and predicting prognosis is a prime concern. This is a retrospective analysis to unearth the role of the haematological parameters in COVID-19. Interpreting the changes in haematological parameters in SARS–CoV–2 infected patients may be helpful in understanding the pathophysiology of the disorder and could contribute timely clues to diagnosis and hopefully predicts the prognosis.
This is a laboratory observation retrospective cross section study for duration of six months from June 2020 to May 2022 performed at New Kamadhenu Hospital, a health care center, in Kolar, Karnataka. The objectives of the study were to assess haematological parameters in COVID positive cases and analyse difference in profile of haematological parameters between three categories of COVID positive cases. All the cases positive for COVID test by RT-PCR (Real Time Polymerase Chain Reaction) was considered for the study. The sociodemographic data of the all cases was captured from hospital records. Data of haematological parameters (complete blood count) along with blood group and erythrocyte sedimentation rate (ESR) was captured from laboratory for each case. Neutrophil lymphocyte ratio (NLR), monocyte lymphocyte ratio (MLR), Eosinophil lymphocyte ratio (ELR) and platelet lymphocyte ratio (PLR) was calculated from the absolute values of each parameter of the case. All the cases were classified into three categories as per the Ministry of Health and family welfare guidelines as Category A, Category B and Category C. Alteration in haematological parameters, blood groups and ESR between categories was noted. The Data was entered in Microsoft excel sheet. Statistical analysis was done using SPSS software version 22. Continuous variables were expressed as the mean and standard deviation. Categorical variables were presented as counts and percentages in each category. The unpaired Student’s t-test was used for continuous variables. Chi-square (χ) and Fisher’s exact tests was used for categorical variables. p value less than 0.05 was considered statistically significant.
Total number of cases analysed was 410 of which 284 (69.2%) cases were males and 126 (38.2%) females with male to female ratio of 2.2:1. Majority of cases were in the age group of 51-60 years (23.9%) and 41-50 years (21.7%) (Table 1).
| Age group | No of cases (n%) | Males (n%) | Females (n%) |
| 1 month-10 years | 06 (1.4%) | 5 (83.3%) | 1 (16.66%) |
| 10-20 years | 13 (3.1%) | 2 (15.38%) | 11 (84.6%) |
| 20-30 years | 38 (9.2%) | 22 (57.8%) | 16 (42%) |
| 30-40 years | 59 (14.3%) | 47 (79.6%) | 12 (20.4%) |
| 41-50 years | 89 (21.7%) | 65 (73%) | 24 (27%) |
| 51-60 years | 98 (23.9%) | 68 (69.3%) | 30 (20.3%) |
| 61-70 years | 67 (16.3%) | 49 (73.1%) | 18 (26.8%) |
| 71-80 years | 29 (7.2%) | 20 (68.9%) | 9 (31.1%) |
| 81-90 years | 09 (2.1%) | 5 (55.55%) | 4 (44.44%) |
| 91-100 years | 02 (0.4%) | 01(50%) | 01 (50%) |
| Total | 410 (100%) | 284(69.2%) | 126 (30.8%) |
Table 1: Age and sex distribution among cases in the present study.
The minimum age was two months and maximum age was 95 years among cases. The mean age among males was 45 years and in females 22 years. Majority of cases were in Category A (46.3%) followed by Category B (28.6%) and then Category C (25.1%) (Table 2).
| Category | No of cases | % of cases |
| Category A | 190 | 46.3% |
| Category B | 117 | 28.6% |
| Category C | 103 | 25.1% |
| Total | 410 | 100% |
Table 2: Distribution of cases category wise in the present study.
Mean values of red blood cells (RBC) parameters as RBC count, mean corpuscular volume (MCV), mean corpuscular haemoglobin (MCH), mean corpuscular haemoglobin concentration (MCHC) and red cell diameter width (RDW) between three categories of cases were not statistically significant by unpaired student’s t-test (Table 3). Only 16 and 4 cases showed MCV ranging from 57-77 fL and 102-104 fL respectively.
| RBC Parameters | Category A n=103 | Category B n=117 | Category C n=190 | p value |
| Count (million/mm3) | 4.70±0.889 | 4.72±0.891 | 4.75±0.91 | 0.881 |
| MCV (fl) | 91.55±5.89 | 91.45±4.25 | 91.35±4.15 | 0.594 |
| MCH (pg) | 30.24±2.63 | 30.32±1.54 | 30.42±1.62 | 0.902 |
| MCHC (g/dl) | 32.26±2.62 | 34.26±2.42 | 33.26±2.52 | 0.901 |
| RDW (%) | 15.03±3.34 | 14.68±2.04 | 14.71 ±2.04 | 0.682 |
Table 3: Distribution of mean values of RBC parameters among three categories of cases.
Anaemia was noted only in 53 cases (12.9%). Median values of haemoglobin, total white blood cells (WBC) count, differential leukocyte count and platelet count was analysed between three categories of cases using chi square test / Fisher’s exact test. In addition, median values of NLR, MLR, ELR and PLR was analysed between three categories of cases using chi square test / Fisher’s exact test. The total WBC count, absolute neutrophil count (ANC), absolute lymphocyte count (ALC), absolute eosinophil count (AEC), absolute monocyte count (AMC), platelet count, NLR, MLR, ELR and PLR between the three categories of cases were statistically significant (Table 4).
| Blood Parameters | Category A n=103 | Category B n=117 | Category C n=190 | p value |
| Haemoglobin (g/dl) | 12.6 (11.2-13.2) | 11.9 (10.9-12.8) | 11.8 (10.8-12.9) | 0.1012 |
| Total WBC Count (Thousand/mm3) | 5.88 (4.40 - 8.27) | 5.02 (3.92- 6.22) | 5.84 (4.34-8.24) | <0> |
| ANC 10⁹ cells per L | 3·49 (2·37–4·39) | 4·39 (2·97–6·33) | 8·28 (5·30–12·12) | <0> |
| ALC 10⁹ cells per L | 1·8 (0·90–1·59) | 0.98 (0·59–1·36) | 0·74 (0·30–0·91) | <0> |
| AEC 10⁹ cells per L | 0.02 (0.01-0.08) | 0.03 (0.01-0.11) | 0.05 (0.03-0.12) | <0> |
| ABC 10⁹ cells per L | 0.01(0.01-0.03) | 0.01(0.01-0.03) | 0.01(0.01-0.03) | 0.38 |
| AMC 10⁹ cells per L | 0.49(0.31-0.63) | 0.48(0.34-0.62) | 0.51(0.32-0.64) | 0.0020 |
| Platelet count | 188.00 (145.50-249.50) | 247.00 (142.5-328.00) | 115.00 (55.75-200.75) | <0> |
| NLR | 2·87 (1·69–4·08) | 4·91 (2·62–7·78) | 17.02 (6·49–24·79) | <0> |
| MLR | 0.52 (0.1-3.6) | 0.56 (0.1-3.8) | 0.58 (0.1-3.8) | 0.0040 |
| ELR | 0.05 (0-0.15) | 0.06 (0-1.2) | 0.08 (0-1.4) | <0> |
| PLR | 89.1(10.81-1304.1) | 158.1(10.81-1304.1) | 288.1(10.81-1304.1) | <0> |
Table 4: Distribution of median values of haemoglobin, WBC and platelet parameters among three categories of cases.
Blood grouping was performed in 74 cases out of 410 cases of which majority were O positive cases (37.8%) followed by B positive (24.3%) and then A positive (20.2%). Majority of cases of O positive (n=18) were in Category C (Table 5). ESR was performed for 157 cases out of 410 of which majority of cases (14%) had ESR between 11-20 mm/hour (Table 6). Out of 157 cases, 127 cases (81.9%) showed raised ESR.
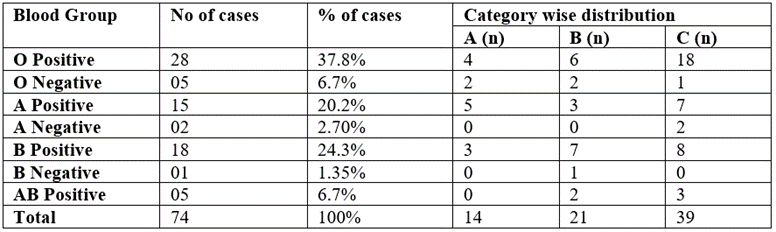
Table 5: Distribution of Blood Group among cases in the present study.
| ESR Range (mm/hour) | No of cases | % of cases |
| 1-10 | 6 | 3.8% |
| 11-20 | 22 | 14% |
| 21-30 | 17 | 10.8% |
| 31-40 | 12 | 7.64% |
| 41-50 | 16 | 10.1% |
| 51-60 | 17 | 10.8% |
| 61-70 | 15 | 9.5% |
| 71-80 | 12 | 7.64% |
| 81-90 | 10 | 6.3% |
| 91-100 | 9 | 5.7% |
| 101-110 | 7 | 4.45% |
| 111-120 | 2 | 1.2% |
| 121-130 | 7 | 4.45% |
| 131-140 | 1 | 0.63% |
| 141-150 | 4 | 2.54% |
Table 6: Distribution of ESR among cases in the present study.
COVID-19 is a viral disease caused by a novel coronavirus SARS-CoV-2. Haematology parameter abnormalities are noted in COVID-19 patients. In this study we have analysed RBC, WBC and platelet parameters between categories A, B and C of COVID RT-PCR positive cases. In the present study all the RBC indices (Table 5) was normal except in 20 cases (4.8?ses) of which 16 cases showed MCV ranging from 57 to 77 fL and 4 cases showed MCV ranging from 102-104 fL. Other cases showed normal RBC indices. This finding was comparable to study done by Lu Chong et al which also showed decrease in MCV values in 9?ses.[13] In present study anaemia was noted in 53 cases (12.9%). This finding was comparable to the study done by Helms J et al which also showed 12?ses with anaemia.[14] In a study by Tang et al, haemoglobin was decreased in 51% of cases with SARS-CoV-2 infection.[7] Decreased haemoglobin was reported to be more marked in Category C.[15] In a study by Zhou et al, no difference was observed in the incidence of anaemia between categories, but the haemoglobin decreased significantly in more severe cases.[8] In a study by Li Q et al, 4.14% (17 cases) of the patients had leukopenia (<4.0×10⁹ /L) whereas in a study by Liu et al leukopenia was observed in 33?ses.[16] In the present study, total WBC count was decreased in Category B and C cases compared with Category A cases. Liu J et al reported that most of the COVID-19 ICU cases had absolute neutrophilia which showed that neutrophilia is an indicator of disease progression.[17] In the present study 393 cases showed absolute neutrophilia (95?ses). The absolute neutrophilia between categories was statistically significant (p value <0.0001) with neutrophilia increasing from Category A to Category B to Category C. A study by Wu CM et al reported that, among the laboratory parameters of COVID-19 patients, 34.5% of patients with ARDS developed higher neutrophil count than those without ARDS and it was statistically significant (p value <0.001).[18] Increase in neutrophil count is usually associated with activation of neutrophils which is required for immune response to fight against the virus. However high neutrophil count results in cytokine storm which leads to severe disease with clinical manifestation.[18] Other studies report that neutrophilia is due to cytokine storm. Coronavirus binds to ACE-2 receptors present on type-2 pneumocytes and releases cytokines especially IL-6 causing cytokine storm which subsequently induces and recruits more neutrophils which could be one of the causes for neutrophilia. Increase in number of neutrophils causes suppression and reduction in other WBCs as lymphocytes, eosinophils and monocytes.[19] The present study showed lymphopenia (<1.0×10⁹/L) in 60.2?ses (247 cases). The ALC decreased from Category A to B to C with SARS and it was statistically significant (p value <0.0001). Usually, lymphopenia occurs with leucopenia. Lymphopenia can occur even with normal WBC count. Zhongnan Hospital affiliated to Wuhan university reported lymphopenia in 138 patients (70.3%) with COVID-19.[20] A study by Wu C et al reported that in 50?ses of COVID 19 initial laboratory investigation showed lymphopenia (64%).[18] Lymphocytes are the crucial antiviral cells. The lymphocyte count is reported to continuously decline in severe COVID ICU patients in a study by Zhang et al. [20] A study done by Singh et al suggests that the cause of lymphopenia could be due to expression of ACE-2 receptors on lymphocytes in lungs and due to viral cytopathic effect resulting in lysis of lymphocytes and resulting in lymphopenia.[21] Among the cases which showed lymphopenia in present the study, most of the cases were in Category C indicating the disease progression. In the present study eosinopenia was observed in all categories of COVID19 cases and eosinophil count was statistically significant between the categories with p value <0.001. In the present study 150 cases (36%) showed eosinopenia of which 130 cases (86%) were in Category C. A study by Yang M et al reported that eosinopenia was observed in severe COVID-19 cases and it improved on discharge of the patient. Thus, improvement of eosinopenia can serve as an indicator of improving clinical condition of the patient.[22] In the present study basophil count was decreased in all categories of COVID -19 cases and was unrelated to severity of the disease. But study done by Sun Y et al showed lower basophil count in severe COVID-19 cases.[23] In the present study monocytes were decreased in all categories of COVID19 and was unrelated to the severity of COVID-19. But study by Sun S. et al showed monocytopenia in severe COVID-19 cases. The cause for monocytopenia can be due to increase in neutrophils following cytokine storm suppressing all other WBCs.[19] A study by Tang N et al has reported thrombocytopenia in 12% COVID cases, thrombocytosis in 3.9?ses (>450×109/L) and rest of the cases showed normal platelet count.[7] In the present study Category C cases manifested with thrombocytopenia than non-severe cases (Category A and B Cases) and it was statistically significant (p value <0.001) (Table 4). Lung is recognized as an organ with probable hematopoietic function and predominant site for production of platelets, which accounts for fifty percent of the entire production of platelets. Large number of megakaryocytes release platelets in pulmonary circulation. Lungs are considered as pool for hematopoietic progenitor cells and megakaryocytes, suggesting that thrombocytopenia can be due to lung damage in COVID infection causing activation of reticular activating system (RAS) with improper functioning of vascular endothelial cells and coagulation system. This causes activation and aggregation of platelets leading to increase in consumption of platelets resulting in thrombocytopenia. Damaged pulmonary capillary beds lead to rupture of megakaryocyte and block platelet release affecting release of platelets into the pulmonary circulation resulting in decreased platelet synthesis and release into systemic circulation.[24] It is reported that in severe COVID-19 cases lymphopenia occurs along with rise in neutrophil count and NLR can help in early prediction of the incidence of severe cases.[17] In the present study NLR ratio was 1-3 in Category A and increased subsequently in Category B and C which was statistically significant (p value <0.001) (Table 4). Thus, stratification of COVID-19 cases can be done with NLR and in the present study, it was observed that NLR can be useful as a predictive factor of severe illness. In the present study MLR and ELR was statistically significant between the three categories (p value 0.0040 and 0.0001 respectively). However, there are no published studies regarding MLR and ELR parameter in COVID-19. Further research is required to assess the value of MLR and ELR parameter in COVID-19. In present study PLR increased in Category B and C cases and it was statistically significant. PLR value increased with severity of the disease. A study by Erdogan A et al showed similar results of high PLR with severity of COVID. Hence PLR can be a useful marker for predicting severity of the disease and can be helpful prognostic indicator.[25] In the Present study the most common blood group noted in COVID infected patients was O Positive in 28 cases (37.8%) and among 28 cases 18 were in Category C. Second most common blood group noted was B Positive in 18 cases (24.3%) of which 8 cases were in Category C. 15 cases (20.2 %) were A positive of which 7 cases were in category C. O Negative and AB Positive blood group were 5 cases (6.7%) each. Our results were comparable to study done by Almadhi MA et al which showed out of 196 COVID-19 infected ICU patients 80 (40.82%) were of blood group O, 59 (30.10%) blood group B, 46 (23.47%) blood group A and 11 (5.61%) blood group AB. Of 2138 COVID-19 infected non-ICU patients, 980 (45.84%) were of blood group O, 585 (27.36%) blood group B, 467 (21.84%) blood group A and 106 (4.96%) blood group AB. There was no association between severity of COVID-19 infection and blood group or antibodies in their study (p value =0.603).[26] Further research is needed to evaluate the association between blood group and severity of COVID-19 infection. Very few studies are published in English literature regarding COVID-19 and blood groups. In present study ESR was captured in 157 cases, of which 127 cases (81.9%) showed raised ESR. ESR is altered by shape and size red blood cells. ESR is also altered by plasma characteristics.[27] A study by Sheng Lan Pu et al reported raised ESR in their case report and explained the probable mechanism for increased ESR as, COVID-19 may lead to change of RBC form or change in characteristics of plasma induced by immune system. High level ESR presumably causes a negative impact on COVID-19 infected patients’ prognosis.[28] ESR is considered as a precursor of Liver and Kidney dysfunction and hence can be considered as a prognostic marker in COVID-19.[29] But it is difficult to predict the prognosis of COVID-19 patients based only on ESR. Further research considering larger number of cases is required to study role of ESR in COVID -19 infected patients. The limitations of the present study were, it is unicentric and a cross section study. Similar studies in multicentric health care centers with larger population yields better results to extrapolate the findings to patient care. However, in the present study, total WBC count, ANC, ALC, AEC, AMC, platelet count, NLR, MLR, ELR and PLR between the three categories of cases were statistically significant. The commonest blood group was O positive and majority of O positive cases were in Category C. 81.9?ses tested for ESR showed raised ESR.
Haematology parameters can be considered to predict progression of the disease and assess prognosis in COVID-19 infection. Total WBC count, ANC, ALC, AEC, AMC, platelet count, NLR, MLR, ELR and PLR can be considered while monitoring COVID-19 cases. O positive blood group cases and cases with raised ESR are to be monitored more carefully.
Nil.
Nil.
Nil.
Dear Editorial Team, Clinical Medical Reviews and Reports. My experience with the journal was highly positive. The peer-review process was rigorous, constructive, and completed in a timely manner. The reviewers provided valuable comments that helped improve the quality and clarity of our manuscript. The editorial office was professional, responsive, and supportive throughout all stages of the publication process. Communication was clear and efficient, and any questions were addressed promptly. Overall, I found the journal to maintain high scientific standards and an excellent publication workflow. I would be pleased to consider submitting future work to this journal. Best wishes from, Elena Popa.

It was my pleasure to submit my testimonial concerning the Reviewer Board of our Scientific Journal “Brain and Neurological Disorders”. The Reviewers focused on some modifications and their contribution was helpful. The ladies of our Editorial Office were also supported my efforts. It was my honor to have such a co-operation and I am looking forward for more collaboration.

Dear Grace Pierce, Editorial Coordinator of Journal of Clinical Research and Reports, Thank you for the speedy and efficient peer review process. I appreciate the fact that your peer reviewers do not take months to respond like with some other journals. I would also like to thank the editorial office for responding quickly to my questions. It is an excellent journal. I plan to submit more manuscripts in the future. Best wishes from, Robert W. McGee

Dear Grace Pierce, Editorial Coordinator of Journal of Clinical Research and Reports, Working with you and your team on our recent publication in JCRR has been a truly wonderful and enjoyable experience. The responses were prompt, and the reviewers were patient, constructive, and highly professional. One reviewer in particular gave me the feeling that a professor was carefully reading and commenting on my coursework, which was deeply touching. The entire process was straightforward and hassle‑free, with no tedious online forms to complete. I highly recommend this journal. Best wishes from, DR Aibing Rao, Head of R&D

I Appreciate the Opportunity to Share my Experience with the Journal of Clinical Research and Reports. The peer review process was timely and constructive, and the feedback provided helped improve the quality of our manuscript. The editorial office was professional, responsive, and supportive throughout the process, ensuring smooth communication and efficient handling of the submission. Overall, it was a positive experience collaborating with your team.

Dear Mercy Grace, Editorial Coordinator of Obstetrics Gynecology and Reproductive Sciences, We would like to express our gratitude for your help at all stages of publishing and editing the article. The editors of the magazine answer all the necessary questions and help at every stage. We will definitely continue to cooperate and publish other works in the Obstetrics Gynecology and Reproductive Sciences! Best wishes from, Alla Konstantinovna Politova,
