
Review Article | DOI: https://doi.org/10.31579/2692-9759/135
*Corresponding Author: José Luis Moragrega-Adame, Medical Tower Hospital. Private medicine. Irapuato, Guanajuato, Mexico.
Citation: Moragrega-Adame JL, (2024), Probability At the Heart of Clinical Epidemiology, Cardiology Research and Reports, 6(5); DOI:10.31579/2692-9759/135
Copyright: © 2024, José Luis Moragrega-Adame. This is an open-access article distributed under the terms of the Creative Commons Attribution License, which permits unrestricted use, distribution, and reproduction in any medium, provided the original author and source are credited.
Received: 10 September 2024 | Accepted: 20 September 2024 | Published: 30 September 2024
Keywords: schizophrenia; electron microscopy; virus; mitochondria; brain; foetus
We know that statistics is the science of probability, and in relation to statistics and medicine Sir William Osler wrote that, "Medicine is a science of uncertainty and an art of probability" 1
I published in 2021, how medicine is part science and art 2 and now, while defining the role of statistics, we unveil another association of both.
In these times where complexity is the hallmark of the epoch and when, according to the late German physic Hans-Peter Dürr (*) we must discard reductionism, we should use statistics to understand the phenomena of nature. Albert Einstein insisted in his posture about determinism but lost the race to Nielhs Bohr whose work confirmed the uncertainty principle of Werner Heisenberg as the basis of quantum mechanics. You can read the beautiful book from Ian Stewart entitled “Does God Play Dice?” 3 and enjoy this beautiful dissertation.
Of course, at any moment it will rain if you are in the midst of a hurricane and of course you will die if you get the rabies, but in almost all other circumstances there will be a probability that events will occur. Medicine and meteorology are two examples where uncertainty is the rule of the game. In the simplest probabilistic statement, they will tell you the percentage probability of rain in the next 24 hours or the probability that pneumonia will resolve with certain treatment. If it does not rain or the infection persists, it should come at no surprise because there was a probability of this occurrence.
In biostatistics we express the probability that the calculated values in a sample reflect the parameters from the universe from which the sample comes from. The more used calculations are presented as confidence limits or as “p” values where the probability can be from 0 to 1.
We can express probability values as fractions, where the numerator is for example the number of cases of a disease and the denominator is the exposed population. For example the number of diabetics among obese males: 10/100. Furthermore, we can express it as 10%. This is the simplest form to measure uncertainty. But in biology, there are always other factors that influence the effect of the independent variable (obesity) on the dependent one (diabetes). We know that besides body weight, we can calculate the effect of age, gender, physical activity, genetics and many more factors. As you can notice, we are entering the realm of complexity and we will no longer be in the reductionism that so far has plagued medicine. Conditional probability is a statistical measure that indicates the probability of an event A occurring if another event B has happened. That is, the conditional probability P(A|B) refers to how likely it is that event A will happen once event B has already occurred. (table 1).
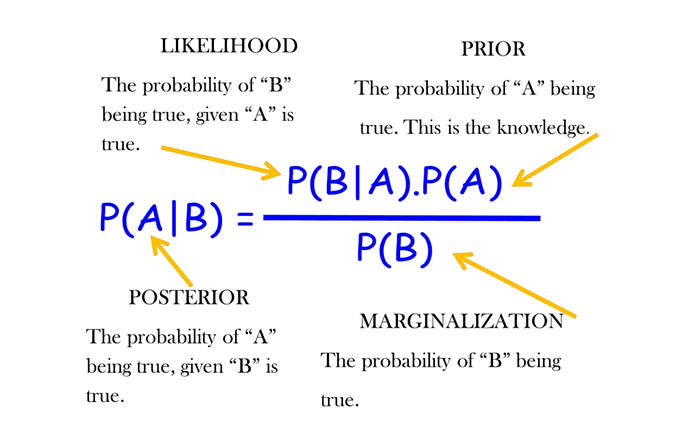
Table 1: Conditional probability or Bayes formula.
In clinical medicine every day we deal with multifactorial events, and it is a mystery how the mind of medical professionals evaluate the information and arrive to a decision. An example is a patient with chest pain and we can apply an algorithm separating first men from women, then by age groups and then according to the type of pain and arrive at a probability that the pain is of ischemic origin 4.
A situation where the concept of conditional probability is very useful is in the evaluation of laboratory and imaging tests. Our example will help in understanding that the values of sensitivity and specificity are not enough to assess the usefulness of a test. We have to calculate the predictive value of a positive or negative test and then proceed to estimate the prevalence of the disease in the group where an individual patient belongs (previous probability) and then using de Bayes proportion of probabilities (also known as likelihood ratio) calculate the posterior probability.
Let´s begin by portraying in a contingency table, the test´s results against the “reality” or the best estimation with the gold standard, accordingly with the state of the art (table 2)
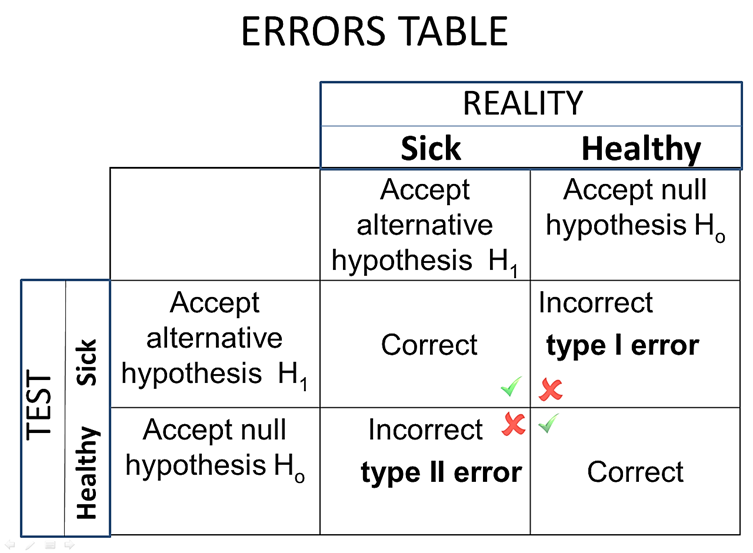
Table 2: The correct boxes are marked with  , while the wrong ones where the decision is incorrect are marked with
  . We can see that the concept is the same as accepting or rejecting the null hypothesis in scientific investigation.
A good test correctly identifies most sick individuals (sensitivity) and the healthy ones (specificity). Now using the same table we will calculate sensitivity, specificity and the predictive values of a positive or a negative test. (table 3).
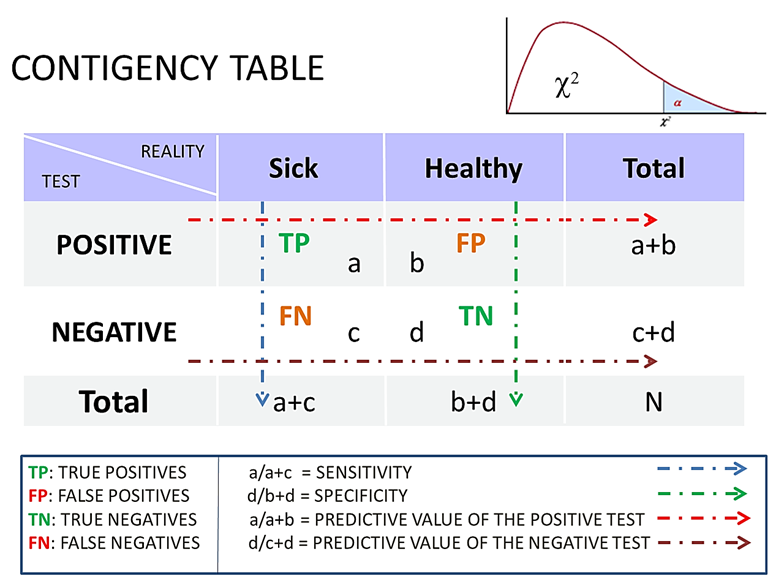
Table 3: We can visualize the sensitivity (a/a+c) and specificity (d/b+d) along with the false positive (FP) and negative tests (FN); this is shown in the vertical arrows. But to know the predictive value of a single patient, we calculate the proportion with the total number of positive (a/a+b) or negative (d/c+d) test as shown in the horizontal arrows.
We will use the sensitivity and specificity of troponin test, often used to evaluate patients with chest pain 5 (table 4).
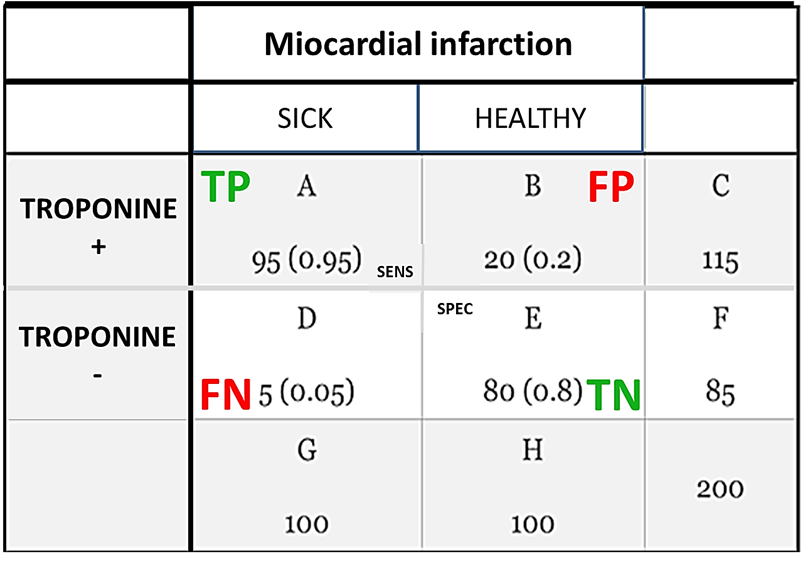
Table 4: Shows the published sensitivity (95%) and specificity (80%) of the troponin test for myocardial infarction in patients with acute chest pain.
Then we calculate the Bayes or likelihood ratio for a positive or negative test. In table 5.
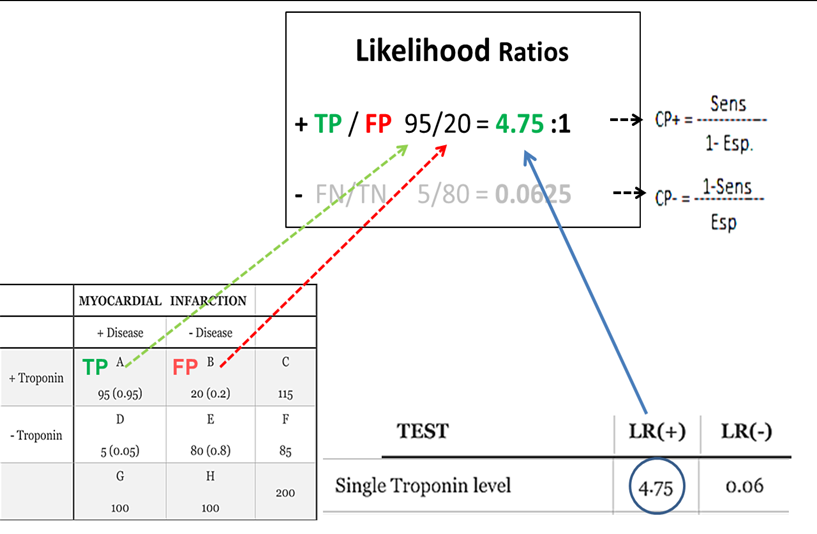
Table 5: The proportion of true positives and false positives is the probability quotient of a positive test.
we see that the ratio for a true positive test is 4.74 for every false positive. And in table 6
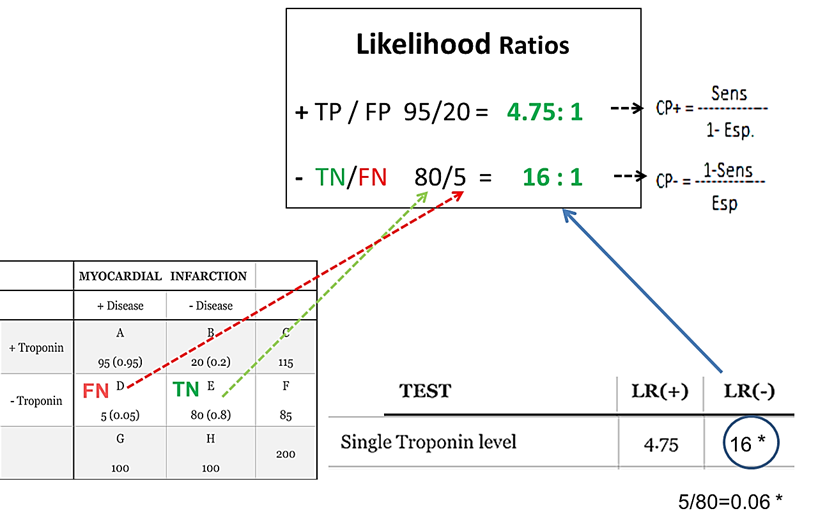
Table 6: The proportion of true negatives and false negatives is the probability quotient of a negative test.
We see 16 cases of a true negative test for every false negative, so the test has a better sensitivity than specificity and has a better predictive value to rule out the disease than to confirm it.
We will use this likelihood ratios in a nomogram published by Fagan 6, but to be able to illustrate the values for a negative or a positive test in the same
graph, as the scale is exponential for the positive ratio and logarithmic for the negative one we will calculate the negative likelihood ratio as FN/TN instead of TN/FN and then the quotient will in this case, be a fraction (0.0625) that will fit properly in the nomogram (table 7).
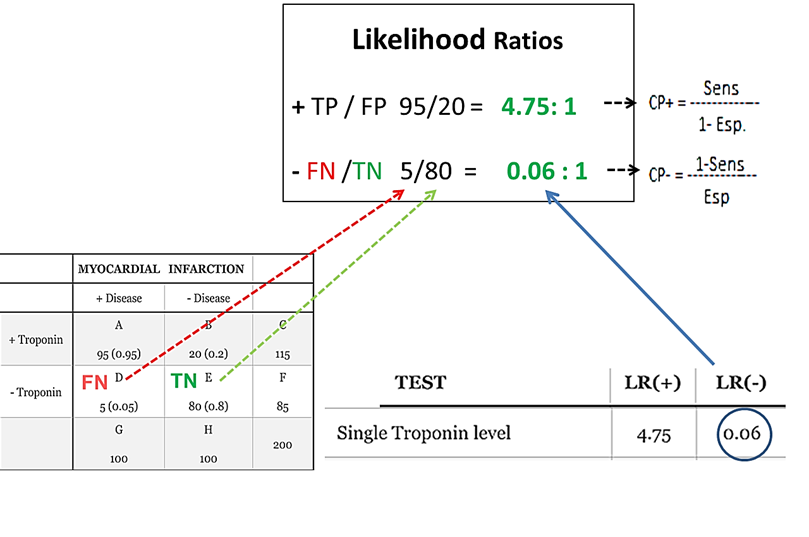
Table 7: Here we use the proportion of false negatives/true negatives, to be able to plot in a single nomogram the predictive value of a positive or negative test.
It has been shown that although there are no precise numbers because every disease has its own particular conditions, the usefulness of lab and imaging studies is larger in patients with intermediate probability of having the disease 7 (Table 8).
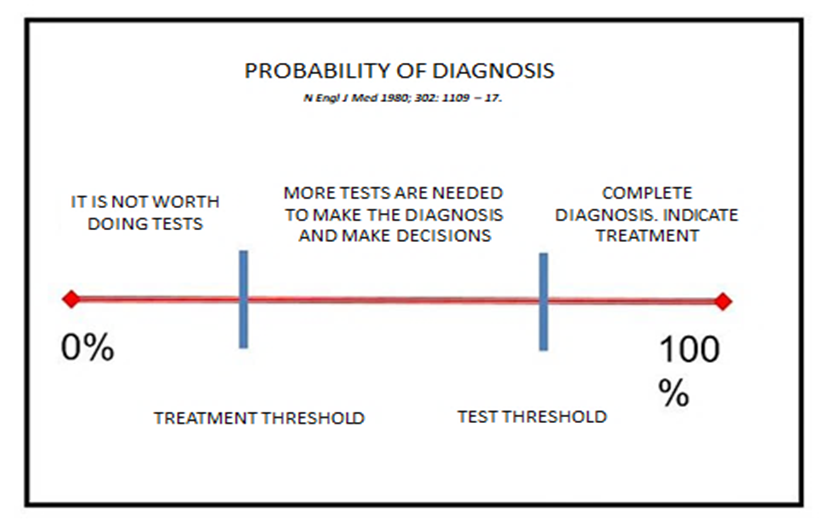
Table 8: Usefulness of lab and imaging tests according with the prior disease probability.
So, the next step as shown in table 9
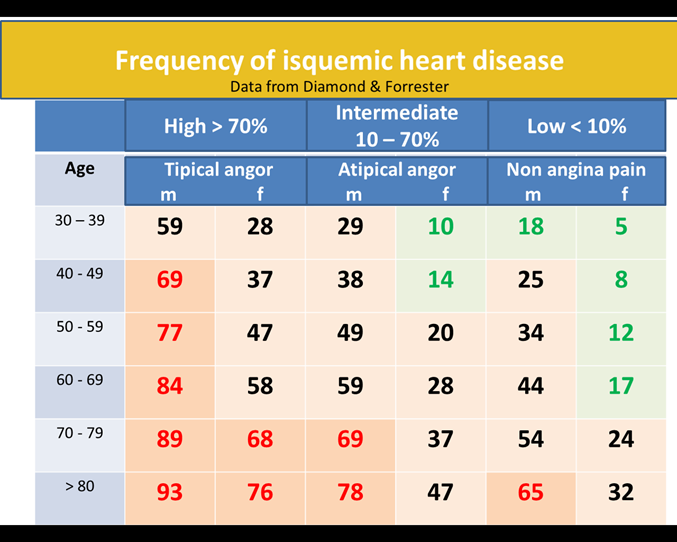
From Diamond & Forrester is to calculate the prior probability of a disease. The score is built by the risk factors gender, age and type of chest pain as published in the ESC guidelines 8,9 . Some critics of Bayes statistics argue that the estimation of pretest prevalence can be inexact, but it is better than doing the test in the general population where the number of false positives and negatives will be high since there is no test with 100
The era of reductionism in medicine has to come to an end. Not only physics is the realm of complexity, but biology has to be studied with many factors where the total results in a larger spectrum and functions than the sum of the individual parts. (figure. 1).

Figure 1: Wikipedia. The blind men and the elephant. John Godfrey Saxe:
Dear Editorial Team, Clinical Medical Reviews and Reports. My experience with the journal was highly positive. The peer-review process was rigorous, constructive, and completed in a timely manner. The reviewers provided valuable comments that helped improve the quality and clarity of our manuscript. The editorial office was professional, responsive, and supportive throughout all stages of the publication process. Communication was clear and efficient, and any questions were addressed promptly. Overall, I found the journal to maintain high scientific standards and an excellent publication workflow. I would be pleased to consider submitting future work to this journal. Best wishes from, Elena Popa.

It was my pleasure to submit my testimonial concerning the Reviewer Board of our Scientific Journal “Brain and Neurological Disorders”. The Reviewers focused on some modifications and their contribution was helpful. The ladies of our Editorial Office were also supported my efforts. It was my honor to have such a co-operation and I am looking forward for more collaboration.

Dear Grace Pierce, Editorial Coordinator of Journal of Clinical Research and Reports, Thank you for the speedy and efficient peer review process. I appreciate the fact that your peer reviewers do not take months to respond like with some other journals. I would also like to thank the editorial office for responding quickly to my questions. It is an excellent journal. I plan to submit more manuscripts in the future. Best wishes from, Robert W. McGee

Dear Grace Pierce, Editorial Coordinator of Journal of Clinical Research and Reports, Working with you and your team on our recent publication in JCRR has been a truly wonderful and enjoyable experience. The responses were prompt, and the reviewers were patient, constructive, and highly professional. One reviewer in particular gave me the feeling that a professor was carefully reading and commenting on my coursework, which was deeply touching. The entire process was straightforward and hassle‑free, with no tedious online forms to complete. I highly recommend this journal. Best wishes from, DR Aibing Rao, Head of R&D

I Appreciate the Opportunity to Share my Experience with the Journal of Clinical Research and Reports. The peer review process was timely and constructive, and the feedback provided helped improve the quality of our manuscript. The editorial office was professional, responsive, and supportive throughout the process, ensuring smooth communication and efficient handling of the submission. Overall, it was a positive experience collaborating with your team.

Dear Mercy Grace, Editorial Coordinator of Obstetrics Gynecology and Reproductive Sciences, We would like to express our gratitude for your help at all stages of publishing and editing the article. The editors of the magazine answer all the necessary questions and help at every stage. We will definitely continue to cooperate and publish other works in the Obstetrics Gynecology and Reproductive Sciences! Best wishes from, Alla Konstantinovna Politova,
