
Research Article | DOI: https://doi.org/10.31579/2693-4779/158
Dokuz Eylül University, Engineering Faculty, Department of Environmental Engineering, Tınaztepe Campus, 35160 Buca/Izmir, Turkey.
*Corresponding Author: Delia Teresa Sponza, Dokuz Eylül University, Engineering Faculty, Department of Environmental Engineering, Tınaztepe Campus, 35160 Buca/Izmir, Turkey.
Citation: Delia T. Sponza, Rukiye Öztekin, (2023), Photocatalytic H2 Production from Hydrazine Monohydrate (N2H4.H2O) using Ni–W–O Nanocomposite, Clinical Research and Clinical Trials, 8(2); DOI:10.31579/2693-4779/158
Copyright: © 2023, Delia Teresa Sponza. This is an open access article distributed under the Creative Commons Attribution License, which permits unrestricted use, distribution, and reproduction in any medium, provided the original work is properly cited.
Received: 16 August 2023 | Accepted: 15 October 2023 | Published: 04 December 2023
Keywords: hydrazine monohydrate (n2h4.h2o); hydrogen [h2(g)] production; ni–w–o nanocomposite; photocatalytic degradation
In this study, H2(g) was produced from hydrazine monohydrate using Ni–W–O nanocomposite. The XRD pattern of the synthesized hydrothermal of Ni–W–O nanocomposite samples exhibited some features of that of NiWO4 with poorly crystallized groups. FTIR spectra of the nanocomposite showed an intense peak at 822 cm−1 corresponding to the stretching vibrations of O–W–O. TEM analysis indicated the reduction of the small NiWO4 crystallites during production process. In the EDS analysis Ni and W elemental distributions was detected. XPS results shows the presence of Ni (II) and W(VI) at high-temperature annealing. For maximum photodegradation of hydrazine monohydrate (N2H4.H2O) to H2(g) (2.670 l) the conditions were as follows: Ni–W–O nanocomposite concentration of 2 mg/l with a Ni/W/O ratio of 0.8/0.5/0.2, 80 min irradiation time, a ligth power of 90 W/m2, a temperature of 60oC and a pH of 8.0.
Hydrogen (H2) is expected to play an essential role as an energy carrier in the future clean energy economy based on renewable energy resources. However, the widespread utilization of hydrogen is hampered by the technical difficulty involved in hydrogen storage and delivery [1]. The materials capable of reversible dehydrogenation have long been sought as possible candidates for high-capacity hydrogen storage [2]. However, none of the existing materials met the requirements for hydrogen capacity (over 6 wt%), kinetics, and operation temperature. Recently, chemical hydrogen storage involving hydrolysis or thermolysis of hydrogen-rich materials and spent-fuel regeneration has emerged as a competitive alternative to a high-pressure hydrogen cylinder for vehicular and portable applications [3]. Among the hydrogen-rich materials of interest, hydrazine monohydrate (N2H4.H2O) is an appealing candidate thanks to its favorable combination of low cost, high hydrogen capacity (8.0 wt%), and good stability at ambient temperatures [4]. In particular, the decomposition reactions of N2H4 yield only gaseous products, which is highly beneficial for the design and practical application of H2-source systems. A series of multicyclic bis(hydrazine) and bis(diazenium) compounds connected by relatively rigid hydrocarbon frameworks were prepared for the study of intramolecular electron transfer. The thermodynamics of electron removal of these compounds was investigated by cyclic voltammetry. The difference between the first and second oxidation potentials for the 4 sigma-bonded species was found to be larger for the bis(hydrazyl) radical systems than for the bis(hydrazines) by ca. 0.2 V (4.6 kcal/mol). This indicates a greater degree of interaction between the two nitrogen moieties for the hydrazyl systems, which is consistent with a greater degree of electronic coupling (H {rm AB}) in these systems [5]. The development of N2H4.H2O as a chemical hydrogen storage material requires highly active and selective catalysts for promoting hydrogen production, and meanwhile suppressing the formation of NH3. In the past decades, a number of transition metals/alloys have been investigated in terms of catalytic properties toward N2H4.H2O decomposition [6]. It was found that alloying is a highly effective approach for boosting the catalytic performance toward HP from N2H4.H2O. The alloying aspect could be understood from two complementary effects: the geometric and electronic modifications of the catalyst surface [6-15]. The bimetallic alloys composed of a combination of precious metals (like Pt and Ir) and nonprecious metals (like Ni, Co, and Fe) generally exhibited favorable performance in both activity and H2(g) selectivity [16-20]. In contrast, the catalytic activity of the noble-metal-free alloys is typically inferior. For instance, the reaction rates of N2H4.H2O decomposition over the representative Ni-based catalysts, such as NiCu/CeO2, NiFe/W. CeO2, NiCo/NiO−CoOx, and NiMo/NiMoO, were 1 or 2 orders of magnitude lower than those of the NiPt and CoPt catalysts [21-27]. Currently, the less favorable modification effects of non-precious metals compared to noble metals are still poorly understood, but from the perspectives of the cost reduction and growth potential, non-precious-metal catalysts represent an important direction for future research of the N2H4.H2O-based HP technology. In general, activity improvement of non-precious-metal catalysts can be pursued via composition/phase tuning and structure optimization.
Therefore, in this study, H2(g) production from N2H4.H2O photodecomposition was studied using Ni−W−O-derived nanocatalyst. Operational conditions such as temperature (20, 30, 40, 50, 60, 70, 80 , 90, 100 and 110oC), nanocomposite concentration (0.5, 1.0, 1.5, 2.0, 2.5, 3.0, 3.5 and 4 mg/l ), illuminating time (20, 30, 40, 50, 60, 70 , 80 and 120 min), ligth power (20, 30, 40, 50, 60, 70, 80, 90, 100 and 110 W/m2), pH (4.0, 7.0, 8.0, 9.0, 10.0, 11.0 and 12.0) and Ni/W/O ratios (0.2 / 0.5 / 0.8, 0.5 / 0.8 / 0.2 and 0.8 / 0.5 / 0.2 ) in the Ni-W-O nanocomposite influencing the H2(g) production was examined. The physicochemical properties of the Ni−W−O- nanocatalyst produced under laboratory conditions was investigated with X-ray diffraction (XRD), transmission electron microscopy (TEM), Fourier transform infrared spectroscopy (FTIR) and X-ray photoelectron spectroscopy (XPS).
Firstly, 2.2 mmol of Na2WO4.2H2O was dissolved into 25 ml of DI water, then 1 g of NiCl2.6H2O was added to the aqueous solution. The mixture was stirred for 30 min. The obtained mixture was transferred to an autoclave and kept at 180°C for 4 h. The sample was collected after cooling to ambient temperature and was sequentially washed with deionized water and C2H5OH and then dried under vakuum at 80°C for 1 h. The samples was annealed at different temperatures (350, 400, and 600 °C) for H2(g) production during 100 min.
The structure of the Ni-W-O nanocomposite were characterized by X-ray diffraction (XRD, 2000 using Cu Kα monochromatized radiation), transmission electron microscopy (TEM, JEOL-2100F), Fourier transform infrared spectroscopy (FTIR, Nicolet IS10), Raman spectroscopy (Thermo Scientific DXR with an excitation wavelength of 532 nm), and X-ray photoelectron spectroscopy (XPS, Thermo Scientific using an Al Kα X-ray source). In the XPS studies, carbon was used for calibration of the binding energy scale.
Hydrazine was measured by ultraviolet–visible spectroscopy at a wave lentgh of 560 nm (UV–vis, 220).
N2H4.H2O solution containing the Ni-W-O nanocomposite catalyst and an alkaline aqueous solution was preheated at the desired temperature under magnetic stirring. The generated gaseous products passed through a 1.0 M hydrochloric acid solution to absorb ammonia, if any, and then were measured by the water-displacement method using an electronic balance with a precision of ±0.01 g. In the test of the catalytic decomposition properties of concentrated N2H4.H2O solution, an online mass flowmeter equipped with a silica drier was used to monitor the volume of the gaseous products. The reaction rate was evaluated at a reactant conversion of 50%, assuming all the Ni atoms take part in the catalytic reaction. The H2(g) was measured with a Dragger H2 gas meter.
The concentrations of Ni-W-O nanocatalyst was increased from 0.5 mg/l up to 4 mg/l. The maximum H2(g) production was ontained with 2 mg/l Ni-W-O concentration as 2.670 l (Table 1). The increase of nanocatalyst concentration to 3 and 4 mg/l did not affect the H2(g) production.
| Ni-W-O nanocatalyst concentration (mg/l) | H2(g) production ( l ) |
| 0.5 | 0.800 |
| 1 | 1.000 |
| 1.5 | 1.870 |
| 2.0 | 2.670 |
| 2.5 | 2.300 |
| 3.0 | 2.200 |
| 3.5 | 2.000 |
| 4.0 | 2.000 |
Table 1. Effect of increasing Ni-W-O nanocatalyst concentration on H2(g) production efficiency
Catalytic properties toward N2H4.H2O photodegradation were studied on the Ni–W–O derived nanocomposite catalysts. According to control experiments, changing the molar ratio of Ni/W precursors caused a variation of catalytic properties toward N2H4.H2O decomposition, and the optimal Ni/W precursors molar ratio was determined. Therefore, the Ni/W/O ratios was adjusted to 0.2 / 0.5 / 0.8, to 0.5 / 0.8 / 0.2 and to 0.8 / 0.5 / 0.2 in the 2 mg/l Ni-W-O nanocomposite (Table 2). Among these ratios the maximum H2(g) production was detected with a Ni/W/O ratio of 0.8/ 0.5/ 0.2.
| Ni / W / O ratios | H2(g) production ( l ) |
| 0.2 / 0.5 / 0.8 | 1.450 |
| 0.5 / 0.8 / 0.2 | 1.600 |
| 0.8 / 0.5 / 0.2 | 2.765 |
Table 2. Effect of Ni-W-O ratios in the Ni-W-O nanocatalyst on H2(g) production efficiency
As shown in Table 3, the cumulative H2(g) production was linearly correlated with illumination time. As the time increased from 20 min up to 80 min the H2(g) production increased from 2 l up to 2.5 l. Furher increase of time did not affect the H2(g) production both under solar and visible light irradiation. This behavior is valid in the presence of 2 mg/l Ni-W-O nanocomposite with a Ni / W / O ratio of 0.8 / 0.5 / 0.2.
| Illumination time (min) | H2(g) production ( l ) |
| 20 | 0.800 |
| 30 | 1.000 |
| 40 | 1.870 |
| 50 | 2.000 |
| 60 | 2.300 |
| 70 | 2.500 |
| 80 | 2.670 |
| 120 | 2.000 |
Table 3. Effect of illumination time on H2(g) production efficiency
The efficiency of photocatalytic water splitting can be improved by increasing light intensity with energies more than the activation threshold. The variation of reaction rate as a function of wavelength comes after the adsorption spectrum of the catalyst with a threshold corresponding to the band energy. In this stuy the H2(g) production increased from 1 l up to 2.760 l when the UV ligth intensity was increased from 30 W/ m2 up to 90 W/m2 (Table 4). Further increase of UV power did not affect the H2(g) production. It was recorded that the photocatalytic hydrogen production using Ni-W-O showed 50% improved photoactivity by increasing light light intensity was increased.
| Ligth intensity (W/m2) | H2(g) production ( l ) |
| 20 | 0.800 |
| 30 | 1.000 |
| 40 | 1.870 |
| 50 | 2.000 |
| 60 | 2.300 |
| 70 | 2.500 |
| 80 | 2.600 |
| 90 | 2.760 |
| 100 | 2.000 |
| 110 | 2.000 |
Table 4. Effect of ligth intensity on H2(g) production efficiency
Thermodynamically, temperature cannot induce the photocatalysis activity, since it did not contribute toward the generation of electrons and holes. However, temperature plays a role to enhance desorption of products from the surface of catalyst to increase the photocatalytic activity. The temperature speeds up the reaction rate. The temperature applied differs for different catalyst. Therefore, this factor could quickly be adjusted to increase the photocatalytic activity. In this study as the temperature was increased from 20oC to 60oC the H2(g) production elevated from 0.600 l up to 2.700 l (Table 5). Reduce temperature gives negative effect by slowing the H2(g) production rate as desorption of the products limits the reaction, since it is slower the adsorption of the reactants. High temperature provides higher electron transfers in valance band to higher energy levels. Thus, it facilitates the electrone hole formation that could be utilized in initiating oxidation and reduction reactions, respectively, and helps the reaction to compete more effectively with charge carries recombination. It was reported that H2(g) evolution increased with temperature up to 70oC. Further increasing the temperature, however, seems to deteriorate the reaction rate. It was reported that the catalytic properties of these nanocomposite from the aspects of investigating the intrinsic catalytic properties, the number of active sites and metal–support interactions lpwered at very high temperatures.
| Temperature (oC) | H2(g) production ( l ) |
| 20 | 0.800 |
| 30 | 1.000 |
| 40 | 1.870 |
| 50 | 2.000 |
| 60 | 2.700 |
| 70 | 2.500 |
| 80 | 2.600 |
| 90 | 2.000 |
| 100 | 2.000 |
| 110 | 2.000 |
Table 5. Effect of increasing temperature on H2(g) production efficiency
It can be regarded that the production of H2(g) from water splitting is dependent upon the proton concentration, which is the pH of the solution, since proton reduction by the photogenerated electron is generated throughout water splitting. This specific aspect is particularly importance in the case of photo reforming as the presence of a sacrificial organic species. In this stuy the maximum H2(g) generation was detected at a pH of 8.0 (Table 6). Acidic and basic conditions decrease the H2(g) production. It was reported that Ni-W-O catalyst for H2(g) evolution depends on the pH of the mixture while the optimum pH is close to the zero-point charge. At acidic pH, more Hþ ions are adsorbed on the photo catalyst, so the possibility of the reduction of Hþ to H2 by e-1 will not increased. It was reported that in the photocatalytic reaction in low basic system gives more advantages to enhance H2(g) evolution.
| pH | H2(g) production ( l ) |
| 4 | 0.800 |
| 5 | 1.000 |
| 7 | 1.870 |
| 8 | 2.700 |
| 9 | 2.340 |
| 10 | 2000 |
| 11 | 1.000 |
| 12 | 0.400 |
Table 6. Effect of pH on H2(g) production efficiency
The metal oxide can be introduced to effect oxygen vacancies by catalyst synthesis, reduction and doping. For Ni-W-O nanocomposite the oxygen vacancies are existed along with Ni-W-O. When the oxygen vacancies concentration is higher, more ions are produced, thus causes a defect state, surface disorder and associate oxygen vacancies. Due to missing oxygen atom, the oxygen vacancies defect can trap and prolong the life of electrons. Whereas, the regular lattice of the oxygen atom was taken by electrons and local state was formed by oxygen vacancies in the Ni-W-O nanocatalyst. Then, the valens band holes of Ni-W-O were generated and the electrons excited to the conduction bant of the nanocomposite. As a result the electroneholes recombination enhanced the H2(g) production. In order to detect the effects of O2(g) concentration on H2(g) production via 2 mg/l Ni-W-O nanocomposite the dissolved oxygen concentration was increased from 0.5 mg/l up to 4 mg/l. The maximum H2(g) yields was tetected at 1.8 mg/l dissolved oxygen concentration ( 2.700 l )(Table 7).
| Dissolved oxygen concentration (mg/l) | H2(g) production ( l ) |
| 0 | 0.800 |
| 0.5 | 1.000 |
| 1.0 | 1.870 |
| 1.8 | 2.700 |
| 2.0 | 2.040 |
| 2.5 | 2.000 |
| 3.0 | 1.000 |
| 4.0 | 0.400 |
Table 7. Effect of dissolved oxygen on H2(g) production efficiency
The XRD pattern of the as-synthesized hydrothermal sample (Figure 1) resembles some features of that of NiWO4 but with significant peak broadening and diffuse scattering, indicating the formation of a poorly crystallized product. Further annealing this sample at elevated temperature (over 400°C) in air could help remove possible solvent residue, improve its crystallinity, promote crystallite growth, and result in a well-defined XRD pattern consistent with that of NiWO4 (JCPDS 15–0755). Because of the poor crystallinity nature of the as-synthesized hydrothermal sample, its phase assignment was further corroborated by the spectroscopic analyses. Reductive annealing the hydrothermal sample at various temperatures resulted in the formation of nanocomposite catalysts with varied phase compositions and structures. As shown in Figure 1, the 350°C-reduced sample showed a similar XRD pattern to that of the hydrothermal sample but with a new peak appearing at 2θ = 43.68°, matching well with the (111) peak of the Ni17W3 phase (JCPDS 65–4828). Upon increasing the annealing temperature to 400°C, this peak becomes intensified with a low-angle shift by 0.2°, which corresponds well to the (211) peak of the Ni4W phase (JCPDS 65–2673). Meanwhile, the diffraction peaks from the hydrothermal sample completely disappeared and were replaced by the characteristic peaks from the WO2 phase (JCPDS 32–1393). With further elevation of the annealing temperature to 600°C, WO2 was reduced to metal W (JCPDS 04–0806) but with the Ni4W phase still preserved.
| Temperature (oC) | H2(g) production ( l ) |
| 20 | 0.800 |
| 30 | 1.000 |
| 40 | 1.870 |
| 50 | 2.000 |
| 60 | 2.700 |
| 70 | 2.500 |
| 80 | 2.600 |
| 90 | 2.000 |
| 100 | 2.000 |
| 110 | 2.000 |
Table 5. Effect of increasing temperature on H2(g) production efficiency
It can be regarded that the production of H2(g) from water splitting is dependent upon the proton concentration, which is the pH of the solution, since proton reduction by the photogenerated electron is generated throughout water splitting. This specific aspect is particularly importance in the case of photo reforming as the presence of a sacrificial organic species. In this stuy the maximum H2(g) generation was detected at a pH of 8.0 (Table 6). Acidic and basic conditions decrease the H2(g) production. It was reported that Ni-W-O catalyst for H2(g) evolution depends on the pH of the mixture while the optimum pH is close to the zero-point charge. At acidic pH, more Hþ ions are adsorbed on the photo catalyst, so the possibility of the reduction of Hþ to H2 by e-1 will not increased. It was reported that in the photocatalytic reaction in low basic system gives more advantages to enhance H2(g) evolution.
| pH | H2(g) production ( l ) |
| 4 | 0.800 |
| 5 | 1.000 |
| 7 | 1.870 |
| 8 | 2.700 |
| 9 | 2.340 |
| 10 | 2000 |
| 11 | 1.000 |
| 12 | 0.400 |
Table 6. Effect of pH on H2(g) production efficiency
The metal oxide can be introduced to effect oxygen vacancies by catalyst synthesis, reduction and doping. For Ni-W-O nanocomposite the oxygen vacancies are existed along with Ni-W-O. When the oxygen vacancies concentration is higher, more ions are produced, thus causes a defect state, surface disorder and associate oxygen vacancies. Due to missing oxygen atom, the oxygen vacancies defect can trap and prolong the life of electrons. Whereas, the regular lattice of the oxygen atom was taken by electrons and local state was formed by oxygen vacancies in the Ni-W-O nanocatalyst. Then, the valens band holes of Ni-W-O were generated and the electrons excited to the conduction bant of the nanocomposite. As a result the electroneholes recombination enhanced the H2(g) production. In order to detect the effects of O2(g) concentration on H2(g) production via 2 mg/l Ni-W-O nanocomposite the dissolved oxygen concentration was increased from 0.5 mg/l up to 4 mg/l. The maximum H2(g) yields was tetected at 1.8 mg/l dissolved oxygen concentration ( 2.700 l )(Table 7).
| Dissolved oxygen concentration (mg/l) | H2(g) production ( l ) |
| 0 | 0.800 |
| 0.5 | 1.000 |
| 1.0 | 1.870 |
| 1.8 | 2.700 |
| 2.0 | 2.040 |
| 2.5 | 2.000 |
| 3.0 | 1.000 |
| 4.0 | 0.400 |
Table 7. Effect of dissolved oxygen on H2(g) production efficiency
The XRD pattern of the as-synthesized hydrothermal sample (Figure 1)
resembles some features of that of NiWO4 but with significant peak broadening and diffuse scattering, indicating the formation of a poorly crystallized product. Further annealing this sample at elevated temperature (over 400°C) in air could help remove possible solvent residue, improve its crystallinity, promote crystallite growth, and result in a well-defined XRD pattern consistent with that of NiWO4 (JCPDS 15–0755). Because of the poor crystallinity nature of the as-synthesized hydrothermal sample, its phase assignment was further corroborated by the spectroscopic analyses. Reductive annealing the hydrothermal sample at various temperatures resulted in the formation of nanocomposite catalysts with varied phase compositions and structures. As shown in Figure 1, the 350°C-reduced sample showed a similar XRD pattern to that of the hydrothermal sample but with a new peak appearing at 2θ = 43.68°, matching well with the (111) peak of the Ni17W3 phase (JCPDS 65–4828). Upon increasing the annealing temperature to 400°C, this peak becomes intensified with a low-angle shift by 0.2°, which corresponds well to the (211) peak of the Ni4W phase (JCPDS 65–2673). Meanwhile, the diffraction peaks from the hydrothermal sample completely disappeared and were replaced by the characteristic peaks from the WO2 phase (JCPDS 32–1393). With further elevation of the annealing temperature to 600°C, WO2 was reduced to metal W (JCPDS 04–0806) but with the Ni4W phase still preserved.
| Temperature (oC) | H2(g) production ( l ) |
| 20 | 0.800 |
| 30 | 1.000 |
| 40 | 1.870 |
| 50 | 2.000 |
| 60 | 2.700 |
| 70 | 2.500 |
| 80 | 2.600 |
| 90 | 2.000 |
| 100 | 2.000 |
| 110 | 2.000 |
Table 5. Effect of increasing temperature on H2(g) production efficiency
It can be regarded that the production of H2(g) from water splitting is dependent upon the proton concentration, which is the pH of the solution, since proton reduction by the photogenerated electron is generated throughout water splitting. This specific aspect is particularly importance in the case of photo reforming as the presence of a sacrificial organic species. In this stuy the maximum H2(g) generation was detected at a pH of 8.0 (Table 6). Acidic and basic conditions decrease the H2(g) production. It was reported that Ni-W-O catalyst for H2(g) evolution depends on the pH of the mixture while the optimum pH is close to the zero-point charge. At acidic pH, more Hþ ions are adsorbed on the photo catalyst, so the possibility of the reduction of Hþ to H2 by e-1 will not increased. It was reported that in the photocatalytic reaction in low basic system gives more advantages to enhance H2(g) evolution.
| pH | H2(g) production ( l ) |
| 4 | 0.800 |
| 5 | 1.000 |
| 7 | 1.870 |
| 8 | 2.700 |
| 9 | 2.340 |
| 10 | 2000 |
| 11 | 1.000 |
| 12 | 0.400 |
Table 6. Effect of pH on H2(g) production efficiency
The metal oxide can be introduced to effect oxygen vacancies by catalyst synthesis, reduction and doping. For Ni-W-O nanocomposite the oxygen vacancies are existed along with Ni-W-O. When the oxygen vacancies concentration is higher, more ions are produced, thus causes a defect state, surface disorder and associate oxygen vacancies. Due to missing oxygen atom, the oxygen vacancies defect can trap and prolong the life of electrons. Whereas, the regular lattice of the oxygen atom was taken by electrons and local state was formed by oxygen vacancies in the Ni-W-O nanocatalyst. Then, the valens band holes of Ni-W-O were generated and the electrons excited to the conduction bant of the nanocomposite. As a result the electroneholes recombination enhanced the H2(g) production. In order to detect the effects of O2(g) concentration on H2(g) production via 2 mg/l Ni-W-O nanocomposite the dissolved oxygen concentration was increased from 0.5 mg/l up to 4 mg/l. The maximum H2(g) yields was tetected at 1.8 mg/l dissolved oxygen concentration ( 2.700 l )(Table 7).
| Dissolved oxygen concentration (mg/l) | H2(g) production ( l ) |
| 0 | 0.800 |
| 0.5 | 1.000 |
| 1.0 | 1.870 |
| 1.8 | 2.700 |
| 2.0 | 2.040 |
| 2.5 | 2.000 |
| 3.0 | 1.000 |
| 4.0 | 0.400 |
Table 7. Effect of dissolved oxygen on H2(g) production efficiency
The XRD pattern of the as-synthesized hydrothermal sample (Figure 1) resembles some features of that of NiWO4 but with significant peak broadening and diffuse scattering, indicating the formation of a poorly crystallized product. Further annealing this sample at elevated temperature (over 400°C) in air could help remove possible solvent residue, improve its crystallinity, promote crystallite growth, and result in a well-defined XRD pattern consistent with that of NiWO4 (JCPDS 15–0755). Because of the poor crystallinity nature of the as-synthesized hydrothermal sample, its phase assignment was further corroborated by the spectroscopic analyses. Reductive annealing the hydrothermal sample at various temperatures resulted in the formation of nanocomposite catalysts with varied phase compositions and structures. As shown in Figure 1, the 350°C-reduced sample showed a similar XRD pattern to that of the hydrothermal sample but with a new peak appearing at 2θ = 43.68°, matching well with the (111) peak of the Ni17W3 phase (JCPDS 65–4828). Upon increasing the annealing temperature to 400°C, this peak becomes intensified with a low-angle shift by 0.2°, which corresponds well to the (211) peak of the Ni4W phase (JCPDS 65–2673). Meanwhile, the diffraction peaks from the hydrothermal sample completely disappeared and were replaced by the characteristic peaks from the WO2 phase (JCPDS 32–1393). With further elevation of the annealing temperature to 600°C, WO2 was reduced to metal W (JCPDS 04–0806) but with the Ni4W phase still preserved.

FTIR spectra of Ni-W-O nanocomposite
FTIR spectra of the hydrothermal sample exhibited an intense peak at 822 cm−1 corresponding to the stretching vibrations of Ni–W–O. \

Figure 2: FTIR spectra results
The Raman spectrum clearly showed a strong band at 883 cm−1, which should be ascribed to the stretching vibrational mode of terminal W=O bonds, consistent with the featured assembly of WO6 octahedra in the NiWO4 structure (Figure 3). IR bands at around 1650 and 3400 cm−1 in Figure 3 should be assigned to the OH bending and stretching vibrations of the adsorbed water molecules. The phase assignments of the 400- and 600°C-reduced samples were further supported by the Raman spectra (data not shown).

Phase structure evolution of the hydrothermal samples upon reductive annealing was further investigated by operating TEM in high-resolution and selected-area electron diffraction (SAED) modes. As shown in Figure 4a, 4b and 4c, the SAED patterns discern the evolutionary reduction of the small NiWO4 crystallites in the hydrothermal sample during the reductive annealing process, from the initial precipitation of Ni17W3 to the concurrent
formation of Ni4W and WO2, and further to the metallic Ni4W and W phases. The high-resolution TEM images reveal the microstructure and phase constitution of the reduced samples. In the 350 °C-reduced sample, the lattice fringes with interplanar distances of 0.207 and 0.245 nm could be assigned to the (111) plane of Ni17W3 and the (002) plane of NiWO4, respectively (Figure 4d). Similarly, the characteristic d-spacings from the crystalline Ni4W and WO2 nanoparticles were identified in the 400°C-reduced sample (Figure 4e and 4f).
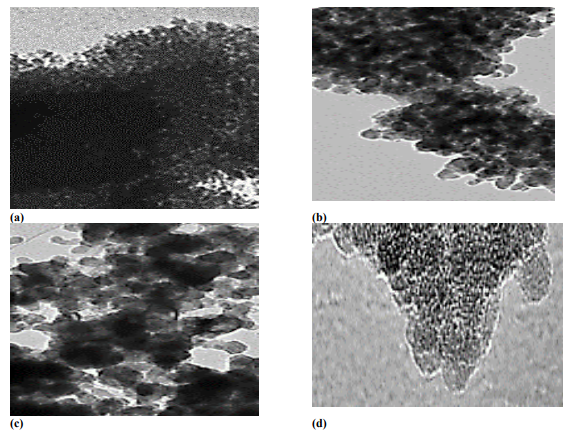
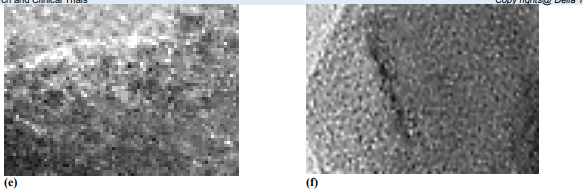
Figure 4: TEM analysis results (TEM images size: 200 nm).
In an effort to determine how the Ni–W alloy phases distribute on the W containing substrates, we examined the reduced samples by high-angle annular dark-field scanning transmission electron microscopy in combination with energy X-ray dispersive spectroscopy (EDS) analysis. The Ni and W elemental distributions gradually change from the atomic dispersion to the segregated nanoclusters with increasing annealing temperature. For the 400°C-reduced sample, the segregation of Ni and W elements became detectable because of the formation of the distinct Ni4W and WO2 phases. Further increasing the annealing temperature to 600°C resulted in aggravated segregation Ni and W, owing to the formation of W and the particle growth and aggregation of Ni4W. A close examination of the samples by EDS line-scanning profile analysis (Figure 5a, 5b and 5c) suggested that the size of the Ni4W nanoparticles increased from around 15 to 30 nm upon elevation of the annealing temperature from 400 to 600°C.

Figure 5: EDS analysis results (EDS images size: 200 nm).
The chemical states of the constituent elements in the hydrothermal and reduced samples were also examined using the surface-sensitive XPS. As presented in Figure 6, the hydrothermal sample exhibited only Ni(II) and W(VI) signals. After the reductive annealing treatment, additional signals of metallic Ni0 were detected, and their intensities increase with increasing annealing temperature. Similarly, the W 4f spectra of the reduced samples clearly manifested the formation of W(IV) and W0 species upon reduction. These results were in accord with XRD, SAED, and HRTEM observations, supporting the evolutionary formation of Ni–W alloys and W-containing substrate phases during the reduction process. A close examination of the XPS spectra further found subtle but significant binding energy shifts of Ni0 and W0. Specifically, the BEs of Ni0 in the reduced samples were observed to negatively shift in comparison with the BE of pristine metal Ni at 853.3 eV. Meanwhile, the W0 in the reduced samples showed positive BE shifts relative to pure W (31.0 eV). These results clearly indicated the electron transfer from W to Ni as a consequence of Ni–W alloys formation. In addition, XPS analysis clearly detected Ni(II) and W(VI) signals throughout the reduced samples but with decreased intensities upon high-temperature annealing. These results, together with the XRD, Raman, and HRTEM characterizations (Figure 6a, and 6b), suggested the presence of NiWO4 and WO3–x amorphous phases in the reduced samples. On the basis of the combination of phase, microstructure, and chemical state analyses, the resulting nanocatalysts from reductive annealing of the NiWO4 precursor at different temperatures were denoted as Ni17W3/NiWO4 (350°C), Ni4W/WO2/NiWO4 (400°C), and Ni4W/W/WO3–x (600 °C), respectively

Figure 6a: XPS analysis in Ni+2 samples

Figure 6b: XPS spectra in W+6 samples
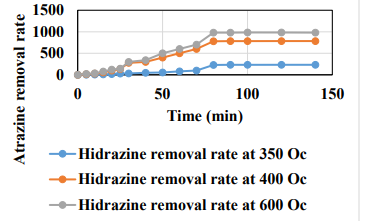
Previous studies illustrated that different initial adsorption conformations of N2H4 over metal surfaces can lead to distinct reaction pathways. In the case of only one N atom of N2H4 bonded to the metal surfaces, N–H bond cleavage of N2H4 molecules is energetically more favorable than N–N bond cleavage, which preferably results in H2(g) production. In contrast, the adsorption conformation with both N atoms of N2H4 bonding to the surfaces dominantly leads to NH3 formation. Hence, the adsorption energy difference between one-N-atom and two-N-atom conformations can serve as an indicator to evaluate the reaction selectivity of N2H4 decomposition. According to the DFT calculation results, the adsorption energy difference on the Ni4W surface is larger than that on the Ni17W3 surface by nearly a factor of 2, implying a significantly higher H2(g) selectivity for Ni4W. This is in good accordance with the experimental results. Therefore, it can be concluded that the improved catalytic performance of the Ni–W–O-derived catalysts upon increasing the annealing temperature from 350 to 400°C should stem from the resultant Ni4W with higher intrinsic activity and H2(g) selectivity than Ni17W3. The reaction rate of the system rapidly reached its maximum [90 ml (N2 + H2) min−1] within ~1 min and maintained at a level of ~80 ml (N2 + H2) min−1 for over 80 min (Figure 7).
The Ni–W–O-derived nanocomposite catalysts can be readily synthesized under laboratory conditions. The prepared catalysts exhibited remarkably distinct catalytic performances toward N2H4.H2O decomposition regarding H2(g) production. Using this noble-metal-free catalyst, decomposition of N2H4.H2O to hydrogen production was performed. For maximum photodegradation of hydrazine monohydrate to H2(g) the optimum operatinal conditions can be summarized as follws: Ni–W–O nanocomposite concentration of 2 mg/l with a Ni/W/O ratio of 0.8 / 0.5 / 0.2, 80 min irradiation time, a ligth power of 90 W/m2, a temperature of 60oC and a pH of 8.0. XRD, FTIR patterns, TEM images and UV−vis spectra of the catalyst exhibited the performances of noble-metal-free catalysts to produce efficiently H2(g) from N2H4.H2O. With this nanocomposite catalyst may produce H2(g) as fuel source.
This research study was undertaken in the Environmental Microbiology Laboratories at Dokuz Eylül University Engineering Faculty Environmental Engineering Department, Izmir, Turkey. The authors would like to thank this body for providing financial support.
Dear Editorial Team, Clinical Medical Reviews and Reports. My experience with the journal was highly positive. The peer-review process was rigorous, constructive, and completed in a timely manner. The reviewers provided valuable comments that helped improve the quality and clarity of our manuscript. The editorial office was professional, responsive, and supportive throughout all stages of the publication process. Communication was clear and efficient, and any questions were addressed promptly. Overall, I found the journal to maintain high scientific standards and an excellent publication workflow. I would be pleased to consider submitting future work to this journal. Best wishes from, Elena Popa.

It was my pleasure to submit my testimonial concerning the Reviewer Board of our Scientific Journal “Brain and Neurological Disorders”. The Reviewers focused on some modifications and their contribution was helpful. The ladies of our Editorial Office were also supported my efforts. It was my honor to have such a co-operation and I am looking forward for more collaboration.

Dear Grace Pierce, Editorial Coordinator of Journal of Clinical Research and Reports, Thank you for the speedy and efficient peer review process. I appreciate the fact that your peer reviewers do not take months to respond like with some other journals. I would also like to thank the editorial office for responding quickly to my questions. It is an excellent journal. I plan to submit more manuscripts in the future. Best wishes from, Robert W. McGee

Dear Grace Pierce, Editorial Coordinator of Journal of Clinical Research and Reports, Working with you and your team on our recent publication in JCRR has been a truly wonderful and enjoyable experience. The responses were prompt, and the reviewers were patient, constructive, and highly professional. One reviewer in particular gave me the feeling that a professor was carefully reading and commenting on my coursework, which was deeply touching. The entire process was straightforward and hassle‑free, with no tedious online forms to complete. I highly recommend this journal. Best wishes from, DR Aibing Rao, Head of R&D

I Appreciate the Opportunity to Share my Experience with the Journal of Clinical Research and Reports. The peer review process was timely and constructive, and the feedback provided helped improve the quality of our manuscript. The editorial office was professional, responsive, and supportive throughout the process, ensuring smooth communication and efficient handling of the submission. Overall, it was a positive experience collaborating with your team.

Dear Mercy Grace, Editorial Coordinator of Obstetrics Gynecology and Reproductive Sciences, We would like to express our gratitude for your help at all stages of publishing and editing the article. The editors of the magazine answer all the necessary questions and help at every stage. We will definitely continue to cooperate and publish other works in the Obstetrics Gynecology and Reproductive Sciences! Best wishes from, Alla Konstantinovna Politova,
