
Review Article | DOI: https://doi.org/10.31579/2690-4861/192
Department of Internal Medicine, Grande International Hospital, Nepal.
*Corresponding Author: Satish Chandra Yadav, Department of Internal Medicine, Grande International Hospital, Nepal.
Citation: Satish C Yadav, Dev S Yadav. (2022). Parameters determining the severity of acute pancreatitis. International Journal of Clinical Case Reports and Reviews. 10(4); DOI:10.31579/2690-4861/192
Copyright: © 2022 Satish Chandra Yadav, This is an open-access article distributed under the terms of the Creative Commons Attribution License, which permits unrestricted use, distribution, and reproduction in any medium, provided the original author and source are credited.
Received: 10 November 2021 | Accepted: 31 January 2022 | Published: 07 February 2022
Keywords: acute pancreatitis, Ranson’s score, APACHE II score, and Balthazar score
Early determination of the severity of pancreatitis can help in guiding the mode of treatment and predicting the disease outcomes. The severity of acute pancreatitis can be determined by history, physical examination, laboratory markers, and radiological examinations. Among these parameters CRP, Ranson, Glasgow are simple and cost-effective test, which is useful in clinical practice. APACHE II score, Balthazar score, BISAP score and cytokines are the best parameters to determine the severity and disease outcomes.
About (15-25) % of AP changed into SAP over time. One study shows that the death rate decreased from 12% to 2% from 1988 to 2003 in the USA but remains high in other place [1]. Determining severity can guide the mode of treatment and prevent death. The severity of pancreatitis are determined by history, physical examination, laboratory, markers, and radiological examinations; these parameters including grading system has been developed to determine the severity of pancreatitis [2], among this grading system few test are specific when done at the time of admission while others are done at (48-72) hours or later. These systems have low specificity together with low prevalence give poor predictive values [3]. For better predictive values biomarkers, genetic polymorphisms and mutations, and proteomic and metabolomic patterns should be included [4].
Amylase and Lipase
Serum lipase rises 4 to 8 hours from the onset of symptoms and normalizes within 7 to 14 days after treatment. Serum amylase may be normal in 10% of cases of acute or chronic pancreatitis due to depleted acinar cell mass and hypertriglyceridemia. False-positive serum amylase is seen in salivary gland disease (elevated salivary amylase), bowel obstruction, infarction, cholecystitis, and a perforated ulcer. If the lipase level is about 2.5 to 3 times that of amylase, it is an indication of pancreatitis due to alcohol, decreased serum calcium, and glycosuria.
C-reactive protein
C-reactive protein (CRP) is an annular, pentameric protein found in blood plasma, whose level rises in response to inflammation. It is an acute-phase protein of hepatic origin that increases following interleukin-6 secretion by macrophages and T cells. Its physiological role is to bind to lysophos-phatidylcholine expressed on the surface of dead or dying cells and some types of bacteria to activate the complement system via the C1Q complex [5]. CRP is synthesized by the liver [6] in response to factors released by macrophages and fat cells [7]. It is a member of the pentraxin family of proteins (6). C-reactive protein was the first pattern recognition receptor (PRR) to be identified [8].
C-reactive protein (CRP) is one of the acute phase reactants made by the liver in response to interleukin-1 and interleukin-6. Levels of CRP above 150 mg/L at 48 hours discriminate severely from mild disease. At 48 hours, CRP above 150 mg/L has a sensitivity, specificity, positive predictive value, and negative predictive value of 80, 76, 67, and 86 percent, respectively, for severe acute pancreatitis [7]. CRP rises steadily with the severity of pancreatitis, is inexpensive to measure, and testing is readily available [8-10]. As a result, it is used to predict the severity of pancreatitis, especially at 48 hours.
Ranson's score
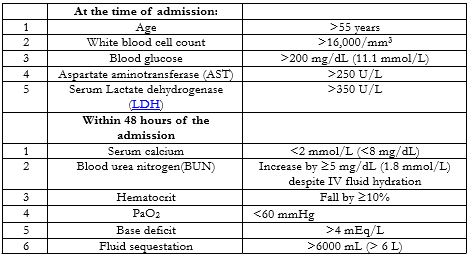
Ranson's criteria are one of the oldest criteria for assessing the severity of acute pancreatitis [11]. It includes 11 factors, 5 factors including Age, WBC count, Blood glucose, Serum AST, and Serum LDH are done at the time of admission while other 6 factors including Serum calcium, Hematocrit fall, PaO2, BUN, Base deficit, Sequestration of fluids are done within 48 hours of admission (Table 1). A Ranson's score of more than 3 is most likely to be severe pancreatitis and a score less than 3 is least likely to be severe pancreatitis [12]. It also predicts the mortality rate, scores less than 3 mortality rate is 0-3%, score more than 3 mortality rate (11-15) %, and score more than 6 mortality rate 40% [13]. One meta-analysis results show it is a poor predictor of severity [14]. However, this scoring system is still continuously being used in clinical practice.
APACHE II
Acute Physiology and Chronic Health Evaluation II (APACHE II) is the severity of the disease classification system. It was developed in 1985 by Knaus et al. for critically ill patients in intensive care units (ICUs) [15]. APACHE II scores are calculated within 24 hours of admission. It is probably the most widely studied severity scoring system in AP and can be performed daily. It has 12 physiologic measures and extra points based upon age and the presence of chronic disease. The following parameters are calculated in APACHE II: AaDO2 or PaO2 (depending on FiO2), Temperature (rectal),Mean arterial pressure, pH arterial, Heart rate, Respiratory rate, Sodium (serum), Potassium (serum), Creatinine, Hematocrit, White blood cell count, and Glasgow Coma Scale.
APACHE II was designed to measure the severity of disease for adult patients admitted to intensive care units. It has not been validated for use in children or young people aged less than 16. This scoring system helps in many ways these includes:
Some procedures or some medicines are only given to patients with a certain APACHE II score
APACHE II score helps to determine the morbidity of a patient when comparing the outcome with other patients.
Predicted mortalities are averaged for groups of patients to specify the group's morbidity.
APACHE II scores vary from 0 to 71. The different parameters and scores are shown in (fig.1). Decreasing values during the first 48 hours suggest a mild attack while increasing values suggest a severe attack. Studies show that mortality is less than 4 % with a score <8>8 [16, 17].
The first APACHE model was presented by Knaus et al. in 1981 [18]. Later it was modified in 1985 by Knaus and named as APACHE II. Some limitations of the APACHE II score are that; it is complex and cumbersome to use, it does not differentiate between interstitial and necrotizing pancreatitis, and it does not differentiate between sterile and infected necrosis. Finally, it has a poor predictive value at 24 hours [17].
Several additional variables were added to APACHE II to improve its accuracy leading to the development of APACHE III in 1991 [19]. Both APACHE II and III scores use physiology, age, and chronic health to calculate prognosis; they differ in total score, the number of physiologic variables (12 for APACHE II versus 17 for APACHE III), and the assessment of chronic health status. However, the APACHE III system does not appear to be as useful as APACHE II for distinguishing mild from severe attack [20]. APACHE III scores range from 0 to 299(19). Even though newer scoring systems, such as SAPS II, APACHE III developed, APACHE II continues to be used extensively.
Balthazar score
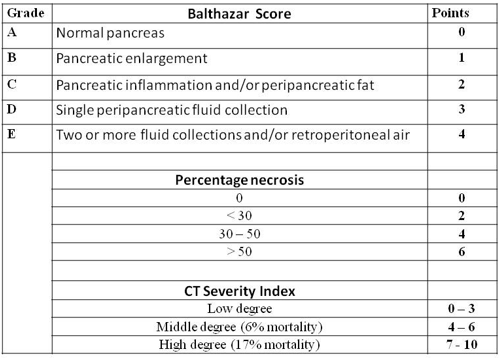
In the early 1990s, the Balthazar score was developed by Emil J. Balthazar et al [21]; it is a Computed Tomography Severity Index (CTSI) grading system used to determine the severity of acute pancreatitis. It is based upon the degree of necrosis, inflammation, and the presence of fluid collections [21]. The numerical CTSI has a maximum of ten points, the sum of the Balthazar grade points and pancreatic necrosis grade points are shown in (TABLE 2.).

Each of the two sections has a different grading of CT that is awarded a different number of points, increasing proportionally with the severity of AP.
CT severity index = CT grade points + Necrosis points
The maximum score obtainable, the sum of the maximum Balthazar grade points and pancreatic necrosis points is 10.
There are threescore ranges suggestive of different degrees of AP severity:
0 – 3: score consistent with mild AP;
4 – 6: score consistent with moderate AP;
7 – 10: the score is consistent with severe AP.
In an initial validation study, mortality was 23 % with any degree of pancreatic necrosis and 0 %with no necrosis. In addition, there was a strong association between necrosis >30 % and morbidity and mortality [21]. The finding of necrotizing pancreatitis (or even infected necrosis) does not necessarily predict the occurrence of organ failure, but may alter the therapeutic approach [22]. In a retrospective study of 268 patients with AP assessed by the CT severity index, patients with a CT severity index >5 were 8 times more likely to die, 17 times more likely to have a prolonged hospital course, and 10 times more likely to undergo necrosectomy than the patients with scores <5>[23].
CTSI's staging of acute pancreatitis severity has been shown by many studies to provide a more accurate assessment than APACHE II, Ranson, and C-reactive protein (CRP) level [24-27]. However, a few studies indicate that CTSI is not significantly associated with the prognosis of hospitalization in patients with pancreatic necrosis, nor is it an accurate predictor of AP severity [28, 29].
BISAP score
Development of the bedside index of severity in acute pancreatitis (BISAP) score was based upon 17,922 cases of AP from 2000 to 2001 and validated in 18,256 cases from 2004 to 2005 [30]. Patients are assigned 1 point for each of the following during the first 24 hours: BUN >25 mg/dL, impaired mental status, SIRS, age >60 years, or the presence of a pleural effusion (TABLE 3) [30]. Patients with a score of zero had a mortality of less than one percent, whereas patients with a score of five had a mortality rate of 22 percent. In the validation cohort, the BISAP score had similar test performance characteristics for predicting mortality as the APACHE II score. As is a problem with many of the other scoring systems, the BISAP has not been validated for predicting outcomes such as length of hospital stay, need for ICU care, or need for intervention.

A validation study of the BISAP score that included 185 patients found that its performance was similar to APACHE II, Ranson's criteria, and the CT severity index system [31]. While the BISAP score is meant to be easily calculated at the bedside, it has been noted that to do so is not as simple as was initially reported because four variables need to be considered to determine if SIRS is present [32].
Indications: Evaluation of acute Pancreatitis Prognosis and severity in first 48 hours of admission [33, 34].
Criteria:
Interpretation: More than 3 criteria present within first 48 hours of presentation are likely to be Severe Pancreatitis [33, 34].
Cytokines are a group of proteins involved in the innate and adaptive immune systems. Many types of cells in the body-not only immune system cells-can produce cytokines, and production is generally stimulated by the presence of an antigen. Cytokines carry signals from one cell to another, alter cell behavior in various ways and regulate the body’s immune response to a potential threat — which could be a pathogen, such as a virus, bacterium, or parasite, or a toxin. In some cases, inappropriate cytokine production takes place in response to something harmless, resulting in an allergic reaction. Usually, cytokine proteins are not stored ready-made but are synthesized when needed.
The role of these proteins in the immune response is complex. A single cytokine can influence several different types of cells and can perform more than one function, while several different cytokines can perform the same function. Different types of cells can respond differently to the same cytokine and cytokines can interact with one another in various ways — for example, one might inhibit the effects of another; two together might produce a synergistic effect, and one cytokine may stimulate the production of others. Cytokines can influence the cell that produced them — these are known as autocrine — or they can influence nearby cells — these are known as paracrine. Less commonly, they might influence cells some distance away via the bloodstream — these are known as endocrine.
A number of different cytokines are involved with the innate immune system. Chemokines influence the movement of immune cells by chemotaxis and can attract these cells to sites of injury or infection. Tumor necrosis factor alpha (TNF-α), interleukin 1 (IL-1) and interleukin 6 (IL-6), known collectively as endogenous pyrogens, cause fever and an inflammatory response to infection by influencing temperature control in the hypothalamus and promoting the breakdown of fat and protein to generate heat; they also stimulate the production of chemokines. Interferons have a variety of functions, including preventing viral replication and activating macrophages and NK cells. Interleukin 10 (IL-10), in contrast, has an essentially inhibitory effect on the immune response.
Although these proteins play a vital role in coordinating the immune response to eliminate threats, they can sometimes aggravate conditions caused by pathogens or cause disease themselves. Excessive production of cytokines, perhaps in response to a new and unfamiliar pathogen, can result in what is known as a cytokine storm, which can cause severe and life-threatening inflammation of tissue. It has been suggested that the high mortality rate during the 1918 influenza pandemic was due to this effect rather than the direct effects of the virus itself. Other related problems include toxic shock, allergies and autoimmune diseases. Some cancer cells produce cytokines which help stimulate their growth.
During the initial 24 hours, severe acute pancreatitis (AP) can be predicted using clinical, laboratory, and radiologic parameters, many of which have been incorporated into scoring systems such as the systemic inflammatory response syndrome (SIRS) score, the Acute Physiology and Chronic Health Examination (APACHE) II score, the bedside index of severity in acute pancreatitis score, and the computed tomography (CT) severity index. We favor the SIRS score because it is simple, cheap, readily available, and as accurate as any other complex scoring system, especially persistent SIRS.
We suggest a contrast-enhanced CT be performed in patients considered to have severe AP based upon clinical criteria or possibly the APACHE II score to determine if necrotizing pancreatitis is present. A CT scan is not required on the first day unless other diagnoses are being considered. It takes time for pancreatic necrosis to develop and thus CT may be normal in the first 48 to 72 hours. Although there are some experimental data that ionic contrast may worsen pancreatitis, the association is probably not strong and the information obtained from the CT scan justifies the potential risk.
Magnetic resonance imaging is emerging as a useful imaging tool in pancreatitis, especially to identify stones in the bile duct, visualize pancreatic duct, and to distinguish the contents of fluid collections seen on CT. However, experience remains inadequate in the setting of acute pancreatitis primarily because of its high cost and need for prolonged examination time.
Laboratory tests have an adjunctive role in predicting the severity of acute pancreatitis. We agree with the guidelines issued by the American College of Gastroenterology and International Association of Pancreatology/ American Pancreatic Association, which suggest that advanced age, comorbidities, body mass index >30, pleural effusion or pulmonary infiltrates, hematocrit >44, blood urea nitrogen (BUN) >20, rising BUN, high creatinine, initial SIRS score ≥2, persistent SIRS, and persistent organ failure as predictors of severe disease.
In Summary: CRP, Ranson, Glasgow are simple and cost effective test, which is useful in clinical practice. APACHE II score, Balthazar score, BISAP score and cytokines are the best parameters to determine the severity and disease outcomes.
APACHE: acute physiology and chronic health evaluation;
CRP: C-reactive protein;
SAP: severe acute pancreatitis;
IL: Interleukin
SIRS: Systemic inflammatory response syndrome
TNF-α: Tumor necrosis factor alpha
There is no conflict of interest to declare.
Dear Editorial Team, Clinical Medical Reviews and Reports. My experience with the journal was highly positive. The peer-review process was rigorous, constructive, and completed in a timely manner. The reviewers provided valuable comments that helped improve the quality and clarity of our manuscript. The editorial office was professional, responsive, and supportive throughout all stages of the publication process. Communication was clear and efficient, and any questions were addressed promptly. Overall, I found the journal to maintain high scientific standards and an excellent publication workflow. I would be pleased to consider submitting future work to this journal. Best wishes from, Elena Popa.

It was my pleasure to submit my testimonial concerning the Reviewer Board of our Scientific Journal “Brain and Neurological Disorders”. The Reviewers focused on some modifications and their contribution was helpful. The ladies of our Editorial Office were also supported my efforts. It was my honor to have such a co-operation and I am looking forward for more collaboration.

Dear Grace Pierce, Editorial Coordinator of Journal of Clinical Research and Reports, Thank you for the speedy and efficient peer review process. I appreciate the fact that your peer reviewers do not take months to respond like with some other journals. I would also like to thank the editorial office for responding quickly to my questions. It is an excellent journal. I plan to submit more manuscripts in the future. Best wishes from, Robert W. McGee

Dear Grace Pierce, Editorial Coordinator of Journal of Clinical Research and Reports, Working with you and your team on our recent publication in JCRR has been a truly wonderful and enjoyable experience. The responses were prompt, and the reviewers were patient, constructive, and highly professional. One reviewer in particular gave me the feeling that a professor was carefully reading and commenting on my coursework, which was deeply touching. The entire process was straightforward and hassle‑free, with no tedious online forms to complete. I highly recommend this journal. Best wishes from, DR Aibing Rao, Head of R&D

I Appreciate the Opportunity to Share my Experience with the Journal of Clinical Research and Reports. The peer review process was timely and constructive, and the feedback provided helped improve the quality of our manuscript. The editorial office was professional, responsive, and supportive throughout the process, ensuring smooth communication and efficient handling of the submission. Overall, it was a positive experience collaborating with your team.

Dear Mercy Grace, Editorial Coordinator of Obstetrics Gynecology and Reproductive Sciences, We would like to express our gratitude for your help at all stages of publishing and editing the article. The editors of the magazine answer all the necessary questions and help at every stage. We will definitely continue to cooperate and publish other works in the Obstetrics Gynecology and Reproductive Sciences! Best wishes from, Alla Konstantinovna Politova,
