Review Article | DOI: https://doi.org/10.31579/2690-8794/328
1 Department of Oncology-Pathology, Karolinska Institute, Stockholm, Sweden.
2 Department of Radiation Protection, Saarland University Hospital, Homburg, Germany.
*Corresponding Author: Anders Brahme, Department of Oncology-Pathology, Karolinska Institute, Stockholm, Sweden.
Citation: Anders Brahme, Yvonne Lorat, (2026), On the Optimal Choice of Radiation Modality: Maximizing Light Ion Fractionation and Flash effects, Clinical Medical Reviews and Reports, 8(7); DOI:10.31579/2690-8794/328
Copyright: © 2026, Anders Brahme. This is an open access article distributed under the Creative Commons Attribution License, which permits unrestricted use, distribution, and reproduction in any medium, provided the original work is properly cited.
Received: 11 June 2026 | Accepted: 19 June 2026 | Published: 03 July 2026
Keywords: TP53 damage sensors and modification sites; TP53 mutations; LDRR tumors; light ion radiation therapy; therapy optimization
All radiation types produce d -rays ≈1 keV that can impart MGy doses to 10 nm size volumes of DNA. These events can produce severe Dual Double Strand Breaks (DDSB) at the periphery of nucleosomes in single events particularly in heterochromatic DNA. These DDSBs are the most common multiply damaged sites and their probabilities are determining the biological effectiveness and therapeutic responses of different beams. The recent understanding that most normal tissues with intact TP53 genes generally are low-dose hypersensitive (LDHS) and low-dose apoptotic (LDA), implies that the well-known universal clinical fractionation window at ≈ 2 Gy/Fr defines the optimal tolerance level of normal tissues and not the optimal tumor dose per fraction using IMRT. Interestingly, practically all cancer cells are linked to genomic instability in some DNA repair, cell cycle or growth control genes like TP53 that is affected in 50% of all tumors. Unfortunately, this often gives tumor cells a low dose radiation resistant phenotype (LDRR).
The clinical fractionation window is due to the low-dose and LET initiation of full DNA repair capability after ≈1⁄2 Gy, and we should use this acquired repair advantage and consequent induced radiation resistance in normal tissues to its full extent up to ≈2.3 Gy where the high dose apoptosis (HDA) may start.
Understanding Quantum Biological Cure implies that light ions should truly have the lowest possible LET in normal tissues to retain the classical low LET fractionation window and have a high LET only in the gross tumor region. Furthermore, carbon and heavier ion treatments may ideally require that the last ≈10+ GyE being delivered by low LET (electrons or photons) to minimize normal tissue damage get a steep dose response and maximize complication free cure. In fact, the microscopic heterogeneity of heavier ions suggest the use of the lightest ions with a low LET in normal tissues allowing quantum biology optimized molecular radiation therapy with He-Li-B ions. This results in negligible increase in therapeutic effect in normal tissues and highest possible tumor apoptosis, senescence and cell kill in the tumor! Carbon and heavier ions should therefore be delivered with a 10-15 GyE low LET roundup to really maximize their complication free cure! In fact, it is conceptually wrong to try to eliminate the last few tumor clonogens by ion beams with severe cold spots in the tumor region. Ion therapy is only useful during the first 50 GyE when there is still hundreds or more of viable tumor cells left in the target volume!
The principle of Flash is due to a high dose inverse dose rate effect in the tumor due to Repair Protein Panic (RPP) and a dual gantry arm design is proposed for significantly increased tumor responses not least using ion beam Ultra Fractionation and high dose biologically optimized IMRT-Flash++ or Super Flash where dual simultaneous beams collaborate only in the tumor volume.
Radiation therapy is the most curative treatment method for many cancers and it works through the genomic instability (cf Figure 1) that makes tumor cells more vulnerable to high dose DNA damage (cf Figure 2) than intact normal tissues and can be readably optimized (cf Figure 3). Interestingly, there is genomic instability in practically all cancer cells as some DNA repair, cell cycle or growth control genes are generally mutated, such as TP53 that is affected in more than 50% of all tumors [1-5]. This generally makes tumor cells more vulnerable to high dose DNA damaging agents than intact normal tissues, often due to lack of apoptosis, cell cycle blockade, and impaired high fidelity DNA repair often via their TP53 mutations.
Unfortunately, they are at the same time commonly associated with a low dose radiation resistant phenotype (LDRR, cf Figure 19, [6, 7]), requiring higher tumor doses per fraction for effective cure. The new ideas and findings presented here are largely due to a significantly improved cell survival formulation that allow separation of Non Homologous End Joining (NHEJ) and Homologous Recombination (HR) repair (cf Figures 15-18, 20 [1, 8] and recent clinically relevant experimental data [1-6].
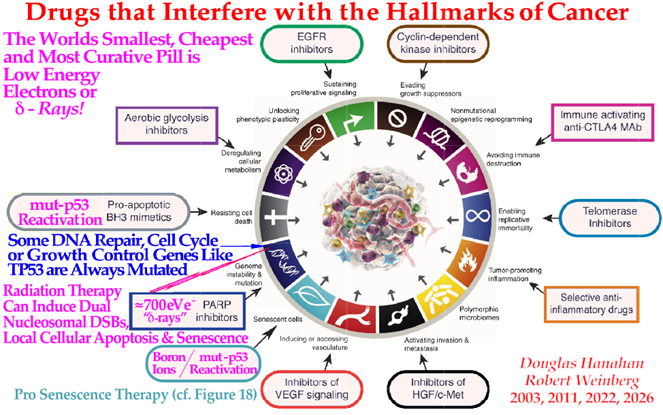
Figure 1: Illustration of some of the different drugs used to interfere with the hallmarks of cancer cells [7, 8, 9] with the addition of the most densely ionizing low energy keV d -rays or d -electrons that can produce dual DSBs (DDSBs) at the periphery of nucleosomes (cf Figures 15, 16) and induce local cellular apoptosis. In fact, these d -rays are our most effective drug for many cancers and the DDSBs are the key effectors of curative radiation therapy
The DDSB damage is very difficult to repair for the principal cellular DNA repair pathways for DSBs Primarily the Non Homologous End Joining (NHEJ) but also Homologous Recombination (HR) repair processes (cf Figures 20, 43 and the Table 1). These d -electrons are probably our most effective actor on tumor cells and therefore often makes radiation therapy the most effective and curative treatment method for many cancers. Interestingly, it also often works through the genomic instability of tumors since some DNA repair, cell cycle and growth control genes are always mutated like TP53 in more than 50% of all cancer cells, making DDSBs especially effective for tumor cure. The interesting reactivating compounds of mutant p53 are also included as TP53 mutant tumor cell may then induce apoptosis, increase tumor cell senescence and augment ROS-effects in LDRR cancers [13].
Furthermore, the major forms of interaction between NHEJ and HR, such as independent homologous and nonhomologous repair, and the homologous repair of nonhomologous misrepair, are accounted for, and so are the probability of inducing apoptosis, and potentially senescence and other cell cycle losses and Bystander-effects [1, 10-13].
Furthermore recent development in nm resolution DNA damage imaging have identified the key effectors of curative radiation therapy as the dual double strand breaks (DDSB, [6]) on nucleosomes by low energy d -rays as shown in Figure 1, in both ion, electron and photon beams (cf also Figures 12-16 for more details [6-11]) and make new improved ways possible to optimize radiation treatments by beam geometry and time dose fractionation selection! One key questions in this paper is therefore: how to deliver these effective d -rays safely mainly to the tumor cells and avoid them in normal tissues by optimal selection of radiation beams and time dose fractionation? One answer is very simple: Use advanced molecular radiation biologically optimized inversely planned electron, photon, and light ion radiation therapy but now we also need to consider dose and LET levels and the fractionation window of normal tissues (2Gy/Fr) and the Quantum Biology of the tumor cure (sμ< 3>molecular radiation therapy with the unique lithium ions be, as they combine a low dose and ionization density or Linear Energy Transfer (LET) with easily repairable damage everywhere except in the tumor where highest possible apoptosis and senescence is only induced in a ≈ 5 mm diameter volume around the Bragg peak as shown in Figure 18 [1, 6, 11, 15-18].
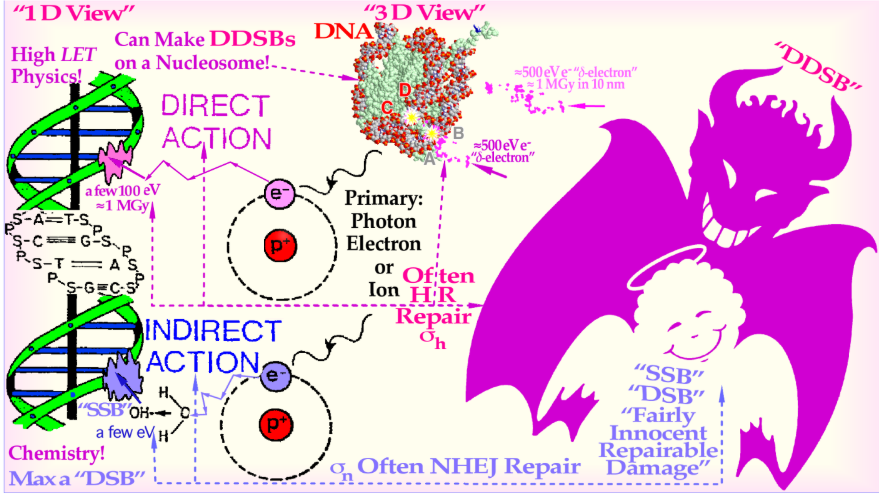
Figure 2: The standard figure of direct and indirect radiation action is largely misleading (left half) since the 1 D view is not describing reality too well as seen to the right in 3 D with the major part of the DNA wound on nucleosomes with significant risk of a dual DSBs (DDSB, cf Figures 12-15).
This cannot happened by radical chemistry reactions except possibly at extreme doses. Furthermore, there is a two order of magnitude difference in the biological effect between a few eV of radical chemistry and a several hundred to a thousand eV of secondary d-electrons that can impart MGy doses and induce DDSB! This is disclosed by the DDSB “devil” trying to hide the white angel that only makes simple DSBs easily repairable damage (cf Figures 5-11)!
The difference is therefore really great between direct and indirect radiation action as will be seen throughout the present publication identifying DDSBs as the key effector of curative radiation therapy (cf Figures 3, 4 and 12-16 for sn& sh or n& h [1, 11, 12, 15, 16]).
Interestingly, due to their low LET in normal tissues they are also saving the unique and important daily fractionation window of classical low LET electron and photon beam therapy at 2 Gy/Fr, well established over some 80 years [6, 18] during the era of parallel opposed beam therapy. As seen in Figures 19, 41 and 45 this is not the optimal tumor dose per fraction using IMRT, rather the opposite, as the effect on the tumor and normal tissues is actually almost the same at 2 Gy/Fr that was largely establish with parallel opposed beams giving equal doses to the tumor and normal tissue. However, now in the era of IMRT, we should try to keep the dose to normal tissues at risk around or below 2 Gy and increase the tumor dose per fraction almost as much as possible, preferably using biologically optimized IMRT [19]. The standard figure of direct and indirect radiation action shown to the left in Figure 2 is largely misleading since a 3 D view of the DNA wound about two turns around the nucleosomes need to be considered with a significant risk of inducing dual DSBs by d-ray track ends! A mechanism that has largely been disregarded by recent cell survival modeling like the dual radiation action model and its offspring’s. We will see below that the two Gy/Fr is minimizing normal tissue damage due to the 1⁄2 Gy needed to start up full NHEJ and HR repair as seen in Figures 19, 40 and 41. Once this 1⁄2 Gy dose is delivered we should use the associated induced radiation repair efficiency and resistance to its full advantage by going up to about two Gy as seen in Figures 19 and 41.
Above 2.3 Gy dual DDSB and HDA sets in and Caspase 3 no longer compensate for the HDA loss but it is commonly the case for LDA (cf Figures 18, 19, 40 and 41). With the lightest ions above protons: He-B, the clinical border region between the gross tumor and the associated internal target volume due to tumor and tissue motion uncertainties in relation to surrounding healthy normal tissues can be set as narrow as afew100 eV ≈1 MGy physically possible as shown in Figure 3 [17-19]. In addition, the optimal number of treatment fractions can be substantially reduced, and the initial curative gain factor on massive radiation-resistant hypoxic tumors can often be more than doubled compared to low ionization density photons, electrons, and protons not least when high resolution molecular tumor imaging are available [6, 10, 16]. Figure 3 applies directly to the most advanced treatment units with scanned electron, photon or ion beams and/or dynamic multileaf collimation [20, 21]. But it also shows for more simple units, how the optimal selection of therapeutic beams can be arranged and the intensity and energy modulation be shaped to maximize the complication-free cure probability for the patient with minimal risk for side effects in normal tissues [6, 13, 17, 19]. The present paper is also kind of introduction to the open access book on Fundamental Molecular Understanding of Quantum Biology Optimized Curative Radiation Oncology [13] where many of the new ideas presented here are discussed and illustrated in much further detail according to many of the present key references. During the last week of conventional curative treatment, only a hand full of viable tumor clonogens remains in the target volume, as indicated in Figures 3, 22-24, 44 and they need to be treated with the uttermost care as most of the initial internal target volume is almost inactivated and the much more microscopically uniform and homogeneous electron or photon beams largely without microscopic cold spots are a necessity to optimize then final treatment outcome (cf. Figures 8-10, 32-35, [13]: Figures 68-
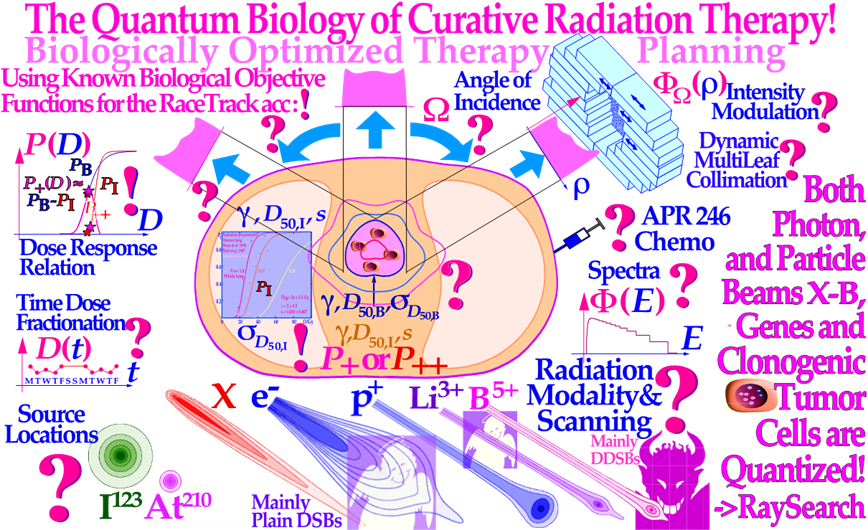
Figure 3a: There is a fantastic power of curability available by employing biologically optimized inversely planned radiation therapy, where the intensity of each pencil beam can be directed and modulated to maximize the complication-free cure probability for the patient with minimal risk for severe side effects in normal tissues [6, 15, 17, 19].
If the approximate sensitivity of the tumor can be determined from its response the first week or two of therapy and the normal tissue responses are generally quite well know from historical data (! ; cf. [13]: Figures 113, 123–128, [14, 16, 20-23]), it is possible to derive the biologically optimal beam directions and their intensity modulation by dynamic multi leaf collimation or scanning pencil beams (? ; [18, 19]). It is even possible to find the optimal combination of low and high ionization density radiations (cf. Figures 18-19 [13]: Figures 103-108, 118) and their incident energy spectra as well as the ideal time dose fractionation pattern (as dicussed in Figures 40-44, [1, 6, 16], [13]: Figures 78-84) using the biologically optimized complication free cure (P+) or the more advanced treatment optimization strategies (P++: P+ followed by concomitant constrained injury minimization [16, 17, 19]). The Quantum Biology is the key dominating process that effect curability the last week of therapy when few clonogens remain (cf Figures 18, 19, 37-39). It is important to use the full flexibility of ions with low LET in the entrance channel and high in the Bragg peak with carbon and heavier ion this differential control is partly lost by a mean LET in the plateau region and a real loss of the low LET fractionation window as well as the Super Flash capability (cf Figure 23-28, 41, 42, 44, 46).
Especially ion beams but also the tumor cells are quantized, and thus, some tumor clonogens may be protected from lethal hits by the inevitable Poissonian cold spots between the ion paths during the last few and generally most curative therapeutic dose fractions, but generally not so with ion beams due to their microscopic heterogeneity (cf Figures 8-10, 12-14, 22-24, [13]: sec 5, Figures 71-74 [1, 6, 13, 15, 16, 19])! Electron and photon beams have the steepest possible dose response and simultaneously less normal tissue damage, and can thus make a true maximization of the complication-free cure, as clearly demonstrated below in Figures 37, 38, 46.
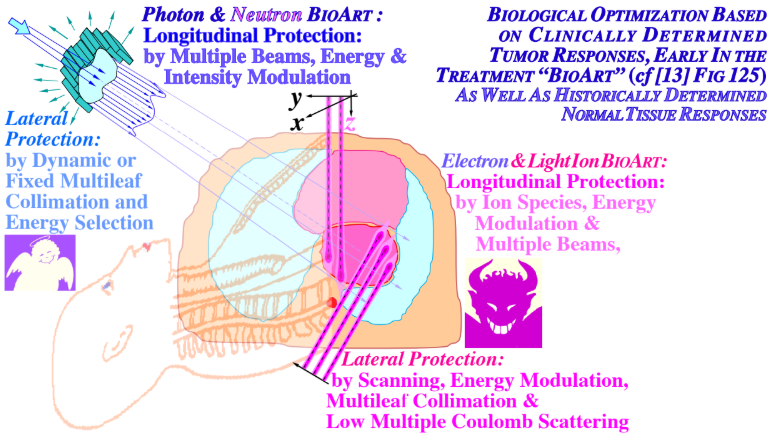
Figure 3b: Illustration of the differences and similarities between biological optimization with neutral (photons and neutrons: exponentially attenuated) and charged (electrons and light ions: finite ranges) particle beams. Biologically optimized radiation therapy using the in vivo predictive-assay based BIOART approach: (BIologically Optimized 3D in vivo predictive Assay based Radiation Therapy) is explained further in [121]. The light ions have advantages both with regard to attenuation, low multiple scattering penumbras and sharp practical ranges (cf Figures 21-25 [13, 23]).
Photon and neutron beams can mainly handle longitudinal protection by intensity modulation, whereas electrons and, in particular, light ions have finite practical ranges and the sharpest possible penumbras. To keep the energy deposition as low as possible in normal tissues, it is essential that the LET and attenuation be as low as possible in the entrance and plateau region of the beam generally dominated by low dose radiation hypersensitive normal tissues. This calls for the lightest ions, as also seen in Figures 18, 37-39 [6, 23]. Unfortunately, these facts have largely been neglected in modern carbon ion therapy losing the advantageous classical clinical fractionation window (cf Figures 20, 40-44, 46, 51, [13]: 45, 50, 80-84, 92, 119 [1, 6, 11-13]).
At least 80% of the local-energy deposition of all high-energy particle beams such as electrons, photons, neutrons and ions is deposited by secondary electrons. The very high energy deposition density by the resulting low-energy secondary-electron slowing-down spectra (cf Figure 5), in the region below one keV approximately down to 200 eV, is especially severe in terms of their radiation biological effects as seen in Figures 4 - 5.
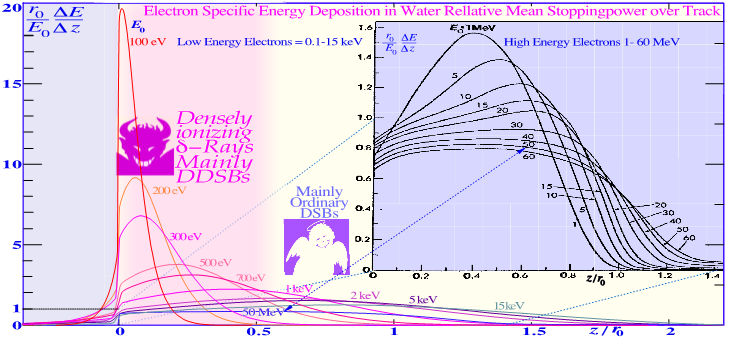
Figure 4: The Mean Energy Deposition in plane parallel electron beams and typical Individual Electron Tracks (cf Figure 5 insert), scaled by the continuous slowing down range r0 and the mean stopping power E0 /r0 over the continuous slowing down range (cf [24]: Figure 2.21-2.22).
The vertical dose scale is magnified almost 10 times for the high energy electrons blue right insert in Figure 4, that have an almost constant effective stopping power of ≈ 2 MeV/gcm-2 ≈0.2 eV/nm. Therefore, with minimal damage to DNA, something only their sub keV secondary trackends can do, as seen to the left in magenta in the present figure (modified from [13, 24-26]).
The most efficient source of such “high LET d -electrons” are the light ions as seen by their slowing down spectra (cf [16]: Figures 14 and 15). Interestingly, the underlying physical interaction mechanism behind the high RBE of the d - electrons as well as “twice” for the light ion Bragg peaks (cf Figures 4, 5) is that they both are due to velocity resonances with the orbital electrons in the body tissues. Because when they have similar speed they can travel longer distances together and therefore get a chance to transfer lots of extra energy as seen in Figures 4, 5 and the resulting probability of producing DDSBs is very high (cf Figures 12-16).
Considering their high local doses and an effective LET (≈50 eV/nm [1, 12, 13], cf also upper right corner of Figures 7 and 10) of these δ-electrons, it is not surprising that these low energy electrons will have a relative biological effectiveness (RBE) of around 3, as seen in Figures 4 and 5 and indirectly also in Figure 1, (cf also [13]: Figures 15-18). High energy photons and electrons above a few hundred keV have a reduced fluence per unit dose of low-energy δ-electrons, and their RBE is by definition =1, whereas low-energy ions mainly generate low-keV δ-electrons and obtain an effective RBE of approximately 3 near their Bragg peaks as seen in Figures 4 -7. To really understand the full clinical significance of the sub keV d - rays we need to look at what happens in electron beams as shown in Figures 4 and 5. The classical plot of high energy electrons by Berger from ICRU report 35 [24] show the continuous shift in curve shape as the scattering power increase with decreasing energy (blue insert in Figure 4). As the electrons penetrate deeper in water their scattering angels increases and so does the absorbed dose as they travel longer pathlengths at a certain depth interval and thus their practical range is also reduced in units of r0 but their scaled lateral transport is very similar. This continues more and more and when the energy drops below ≈ 2 keV a drastic change takes place as seen to the left in Figure 4 and 5 due to the low energy d -electron interactions. For 100 eV d -electrons the scaled energy deposition distributions is increased ≈ 20 fold mainly due to multiple Coulomb scattering, multiple scattering detours [21], secondary electron production and their theoretical peak LET (≈25 eV/nm [10]: Figure 18, [13, 24]) but due to these processes their effective LET reaches 50 eV/nm and more as seen in the upper right corner of Figures 7 and 10 [6, 10, 13, 25]. A recent analysis based on nanometer resolution electron microscopic imaging of DNA damage, using gold nanoparticle tracers of phosphorylated Ku70/80, DNApkcs and 53BP1 have identified the key effectors of curative radiation therapy for both carbon ions, electrons and photons to be the Dual DSBs often at the periphery of nucleosomes (DDSBs, [6]) as initially proposed some 30 years ago [14]. With this new method the DDSBs are clearly visualized as 4 closely located pKu70 or pKu80 sites in specific configurations and they are commonly generated by sub keV d -rays (cf Figures 7, 11-15 [6, 11-14]). Ordinary DSBs are also seen as tight pairs of pKu70/80 sites, but as clearly shown in Figure 9 more than 99 % of them are effectively repaired within a few hours (cf [13]: Figures 51, 83)! Interestingly, the few d -electrons from 150 eV-1 keV as shown in Figures 2, 4, 5 are the real effectors of lethal cell kill and there are between 0 - 4 of them per cell nucleus at 2 Gy as seen in Figures 12, 13 (in average 1.5 cf Figure 12 [11, 13]. According to Figure 9 the mean lethal hit number is ≈0.69 so in average 1.5/0.69≈2.2 d - rays are needed (≈3 Gy cf Figure 12) to induce a low LET induced DDSB based cell kill (as derived in [13] cf Figures 9, 12) truly making the DDSBs and d - electrons the key effectors of curative radiation therapy [6, 10-14]! So the scientific question is then: how to deliver these d - rays safely only to the tumor cells? This is partly what this paper and also the book [13] is about. And one answer is very simple: Use advanced molecular radiation biologically optimized inversely planned electron, photon, and light ion radiation therapy as described in Figure 3a. Thus they are largely saving the unique and important daily fractionation window characteristics of classical low LET electron and photon beam therapy (cf Figure 45 [6, 13, 16, 17].
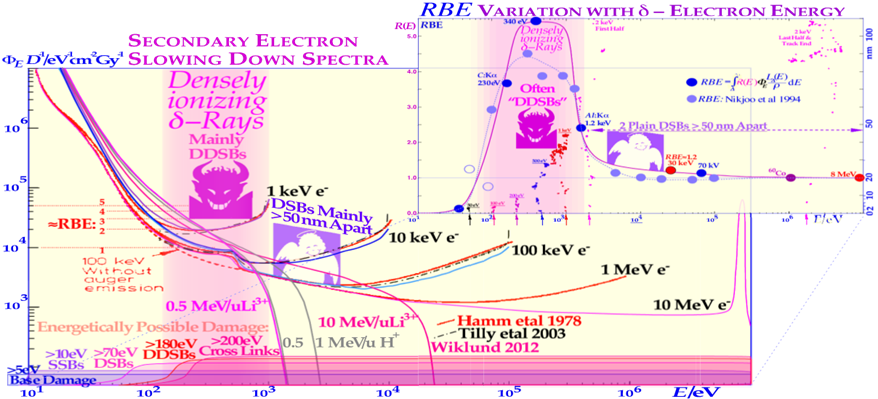
Figure 5: The high Relative Biological Effectiveness (RBE) of secondary electron slowing down spectra of sub keV and higher energy electrons and photons in water. The magenta regions show where biologically active d - rays are generated in low keV electron and photon beams (cf [13]: Figures 15-19). The high scattering power, with multiple scatter detours, secondary electron production and basically medium- high LET (25 eV/nm, [13]: Figures 15-19) makes the low energy δ-rays truly high LET like as seen by their inserted RBE diagram (Effective LET ≈50 eV/nm cf Figures 7 upper right corner, 10 and the associated text, [13, 25-41])!
Interestingly, as the distance between the dual DSBs increases they become easier for the DNApk to reach and they become more repairable as seen to the right and demonstrated in Figures 11, 14 and 15 for simple and Dual DSBs!! The approximate energy range possible for different types of DNA damage are also indicated above the horizontal energy axis in Figure 5.
As will be seen below, many other fundamental phenomena are involved on the way, such as LDA, HDA and not least the quantum biology optimization of curative radiation therapy as recently reviewed and discussed in detail in sec 6 below [6, 10, 13]! The variation of the relative biological effectiveness (RBE) with the ionization density (LET) of different ions is equally well described by their mean d - ray multiplicity along the track as shown in more detail in Figure 7 [13]. The dashed curves in Figure 7 are taken from [32] and describe the average response of the multiple experimental data sets (modified from [33]) very well as the d - electron multiplicity increases along the ion tracks towards the Bragg peak [6, 11, 13]. The ion beam RBE peak at approximately an LET of 120-200 eV/nm thus corresponds to an average d - electron trackend multiplicity along the ion track of ≈ 3 and higher and consequently an RBE ≈ 3. Ion radiation therapy beyond an RBE of 3 is too extreme for clinical use with plenty of unnecessary overkill (cf Figures 50, 51 [13]: Figures 62-65, [11]) rapidly reducing the therapeutic effect as also seen in Figures 5, 13-16, 31. The ion beam RBE peak at approximately an LET of 120-200 eV/nm thus corresponds to an average d - electron trackend multiplicity along the ion track of ≈ 3 and higher and consequently an RBE ≈ 3. Ion radiation therapy beyond an RBE of 3 is too extreme for clinical use with plenty of unnecessary overkill (cf Figures 50, 51 [13]: Figures 62-65, [11]) rapidly reducing the therapeutic effect as also seen in Figures 5, 13-16, 31. A single or a couple of DDSBs, is generally sufficient [12], often making boron ions a better choice than carbon (cf Figure 23, [13]: Figures 94, 97, 98, 106 [32, 33])! This is also seen in Figure 6 were the peak cross section is seen earlier at lower LET values and it is not too good to unnecessarily expose normal tissues to it, but as it is moving geometrically closer to the Bragg peak with lower mass and LET ions (cf Figure 49 [13]) making them much more suitable for treating localized cancers.
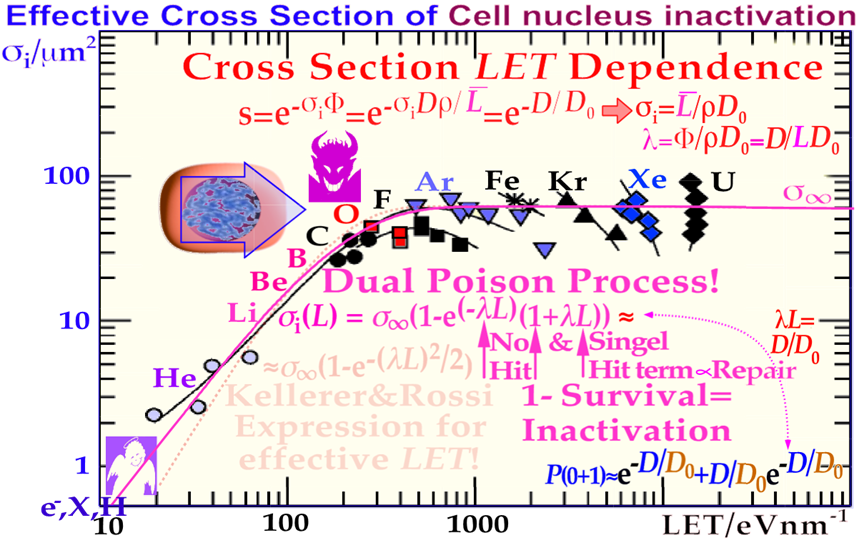
Figure 6: The cell kill as expressed by the cellular inactivation cross-section saturates at high LET beyond carbon and oxygen ions (data modified from [42]). At lower ionization densities and LETs, the ion track is not dense enough to inactivate the cell with high degree of probability after passage through the nucleus.
Since the inactivation cross- section is quasi-constant >200 eV/nm, the fluence density of ions determines the survival in that region. As the cross-section saturates, the peak biological effectiveness appears and at higher LETs, the biological effectiveness decreases because of a quasi-constant cross-section diminishing radial width and increasing probability of radical–radical recombination as secondary electrons are generated more and more closely together and a so-called overkill effect sets in (cf Figure 21b). The solid and dashed curves are taken from 1- Survival and its approximation at high LETs, respectively, and describe the average response of the multiple experimental data sets very well. Interestingly, the single hit expression dominates the total repair term as seen by the solid magenta line and the Dual Poisson exp. ([13]: Eq (5), [32]).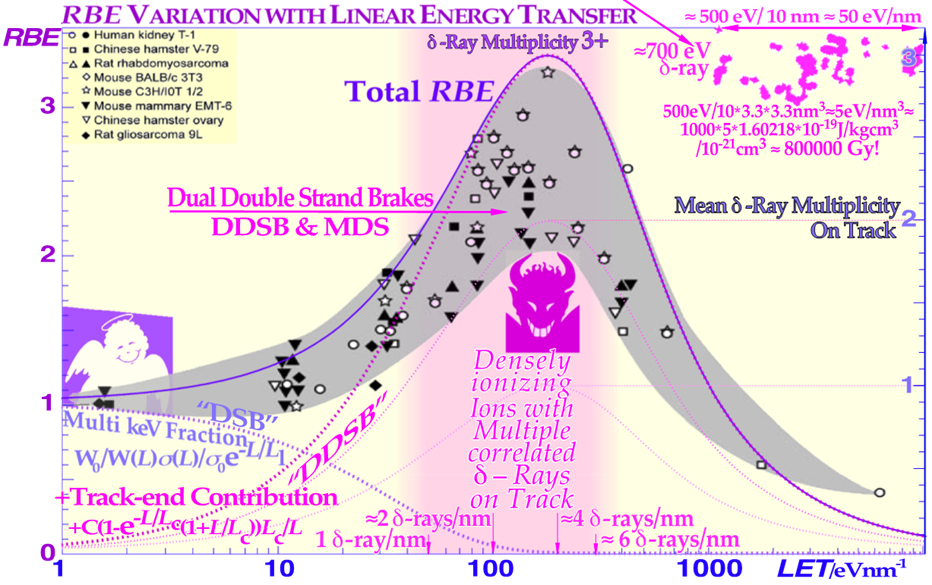
Figure 7: As the inactivation cross-section in Figure 6 saturates, the peak rellative biological effectiveness or RBE appears since the cross-section cannot increase with the LET any more, and at higher LETs the biological effectiveness decreases because of a quasi-constant cross-section an increasing probability of radical–radical recombination as secondary electrons are generated more and more closely together at narrow radii so recombination and these “overkill” effects sets in (cf [13]: Figures 91, 92, 97).
The dashed curves are taken from [32] and describe the average dual Poissonian response of the multiple experimental data sets very well (cf [13]: Figure 94, modified from [32, 33]). Interestingly, the ion RBE peak at approximately an LET of 120-200 eV/nm thus corresponds to a - electron trackend multiplicity on the ion track of ≈ 3 and higher (cf [13]: Figures 62, 63 and 65; [10]), and an RBE ≈ 3, which generally is too much overkill as a single or a couple of local DDSBs, is generally sufficient, again making boron ions a better alternative than carbon (cf [12, 13]: Figures 97, 107 and [10])! To be able to interpret the biological effectiveness in terms of the effective-electron multiplicity along the ion track is remarkable as seen in the 12C track closeup of Figure 11, and that the higher energy Delta electrons are not too important as they are few and most of their energy depositions are of low LET (cf Figures 4, 5).
Interestingly, the imparted energy by DDSBs exerts a cell damage event, which is equal for high and low LET (cf Figure 13) since all sparsely ionizing electron, photon and proton beams also mainly work via Delta - electrons, making them fairly common cell kill events even if they are ≈3 fold more common in high LET beams. Furthermore, radiation types with a high fluence of such low energy secondary electrons [6, 10-13] are known to have a high Relative Biological Effectiveness (RBE) as seen in Figures 4, 5, 7. The lightest ions from Helium to Boron are known to generate high densities of such Delta -electrons mainly at the end of their tracks with RBEs in the 2-4 range. Protons also do, but over such a small range interwall (Less-than sign 50 μm) that it is almost totally diluted by their range straggling (≈2-4 mm cf [13]: Figure 29).
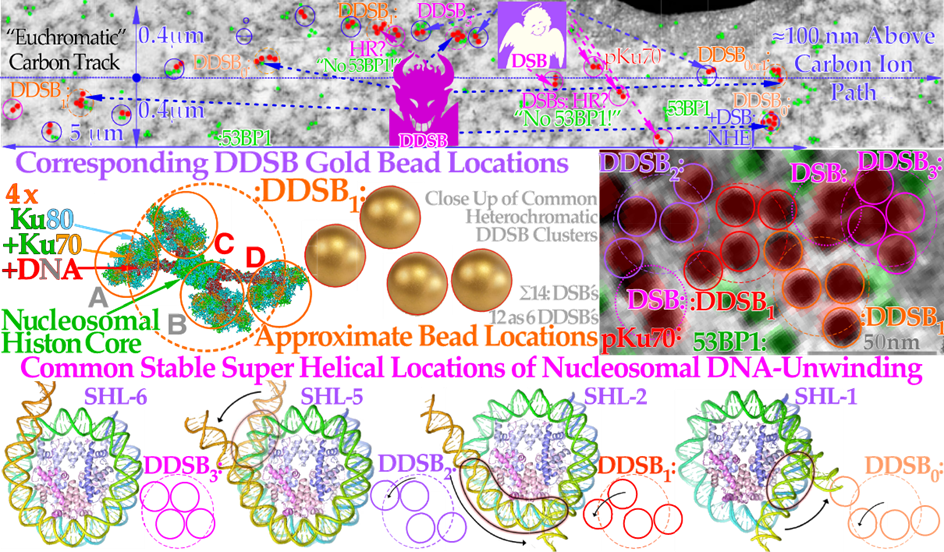
Figure 8: The first clear demonstration of a real DSBs (2 red dots) and DDSBs (4 red dots). Four key DDSB event types generated by carbon ion δ-electron clusters on eu- (top lane) and hetero-chromatin (middle lane).
A carbon ion track through euchromatic DNA shown in the top row with DSBs and DDSBs along a 5μm path only visualized by pKu70-bound gold beads on both sides of each DNA break (red dot pairs, cf Figures 12, 15). 53BP1 may also be recruited as a sign of NHEJ repair (green dots) whereas its absence may indicate an unreached location, a microtomic cut out, or even a switch to HR repair recruiting BRCA1 (not shown) [cf 4, 6, 46, 47]. This switch would probably be more common if it was not for the present dominance of G0 cells. There are typically four types of DDSBs observed, as shown in the lowest lane where the pair of DSB configurations seems to be linked to the different amounts of DNA unwinding necessary, depending on where the hit took place to allow suitable mounting of the Ku70/80 heterodimers needed for closing the breaks by DNApkcs dimers. This is shown in more detail in the middle row for a DDSB1- type hit before the DNApkcs dimer has arrived as seen 3 times along the upper track and twice in the middle right heterochromatic DNA DSB-DDSB cluster close up. It should also be pointed out that the dotted approximate ion path is not inside the upper 70 nm thick TEM slice, as that would have overloaded the picture with DSBs events more than, e.g., in Figures 11, 15. The maximum range of ion-generated δ-electrons is ≈0.4 μm. (top lane: modified from [46]: part of Figure 2, middle lane: modified from [47], bottom lane: modified close-up from [48]).
Therefore, the average RBE in an ordinary plain and spread out proton beam is only around 1.1 (cf Figures 24, 30b). Also, low energy photons and electrons in the low keV energy range have the same elevated RBE property but it is difficult to use clinically (except possibly through Auger emitters) due to their miniscule penetration in tissues. Light ion paths are aligned by a dense core of d -electrons, and a surrounding penumbra region of higher energy d -electrons characterizing the maximum hit range of an ion (cf Figures 4, 5, 7, 8, 11, 33 [13]: Figure 23). Owing to their higher keV energies their biological effects are fairly low as seen in Figures 4-5 and contribute mainly to the hit probability kernel and not to the inactivation kernel even if they too may contribute with 3D diluted d -electrons [33].
Double Strand Breaks (DSBs) on the DNA of the cell nucleus are often assumed to be the principal lethal event for the cell. Today we know that at normal therapeutic doses of radiation therapy (about 2 Gy) and ionization densities below ≈100 eV/nm about 75 DSBs are generated in each cell nucleus as seen in Figure 9 (cf [13]: Figure 83). However, less than 1 % of them are on average lethal (≈0.9% [16, 34, 35]), at least for sparsely ionizing electrons and photons (and ≈ protons) in normal tissues as illustrated in Figure 11.
At higher ionization densities the number of DSBs increases partly due to the more concentrated ionizations along the ion track. But also the number of DSB per repairosome increases as more and more local DSBs can be handled by the same repairosomes ([12]: Figure 1 inserted). One may therefore ask: what is really killing the cells? The answer has been known for quite some time, and it is linked to more complex damage such as at multiply damaged sites [36, 37]. The most common such event is the Dual DSBs (DDSBs) at the periphery of a nucleosome as seen in Figures 12-15 [11-13, 16]. About 40 % of the ion track DSBs are of this more severe type that is often unrepairable by NHEJ due to the short full turn of DNA about 35 nm and does not allow two DNApk repair dimers to work on them simultaneously as can be understood from Figures 14, 15 and [6, 11, 13]. Interestingly, the DNA seems to prefer staying in contact with the nucleosome as a kind of precaution to keep the right order of DNA fragments as seen indirectly in Figure 8 by the four major DDSB types defined there (cf also Figures 12, 13, 15, 49 [6])! The clinical effects of Microscopic Heterogeneity and Random Poissonian misses which reduces the tumor cure at high doses by microscopic cold spots as described in important detail in Figures 8-10, 32, 33 in sec 5 and particularly in [13]. Compared to DSBs, the much more severe Dual DSBs (DDSBs) at the periphery of nucleosomes are truly the most common multiply damaged sites (cf [37]), as seen in Figures 12-15, the lower right of Figure 18 and [13]: Figures 56-60, and are much more lethal [1, 6, 10, 16, 36-41]. In fact, the mean cellular potential lethal hit number of 0.69 at 2 Gy (Figure 9) is most likely related to the ≈1.5 δ-electron trackends (Figures 12, 13) produced in the cell nucleus on average at that dose level and indicates that on average approximately half of them may hit nucleosomal DNA as pointed out above. Interestingly, this key effector of cell death: the δ-electron track ends, of between 1 and 0.2 keV can deliver ≈ 0.3-1 MGy to hundred nm3 size volumes in the cell nucleus. This is mainly due to multiple Coulomb scattering [21, 39-41], multiple scatter detours [24], secondary electron production and their intrinsic low to medium LET (≈10-25 eV/nm [31]) but their effective LET reaches ≈50 eV/nm and more as shown to the upper right corner in Figure 5 (cf [13]: Figures 18, 19). Importantly, the 75 DSBs in each cell nucleus may partly be of this DDSB type but with the methods used until now e.g. to the right in Figure 9, it is hard to see them as Dual DSBs as the Gamma H2AX phosphorylation for example is spread out on mega base pair sizes on each side of the DNA brake and it is probably impossible to see if there are two separate DSBs 80 base pair apart with these methods. The new unique method of Figure 8 is really needed so even if they were proposed about 30 years ago it is not until recently they have been verified as real Dual DSBs even though they were indirectly observed in DNA fragmentation measurements such as Figures 13 and 14 in the 1990ies. At the common low LET therapeutic dose of ≈ 2 Gy there is only ≈1-2 such track ends per cell nucleus as shown in Figure 12. Importantly, this is also the key effector of therapeutic light ion beams, but due to their higher secondary δ- electron production [6, 10, 23, 33, 43-47] of approximately 3-5 per cell nucleus at 2 Gy, or approximately 3 times more than that for plain high energy photon and electron beams (cf [13]: Figure 15). This is truly the main reason for their higher RBE, even though they too, only make ≈ 75 DSBs just like electrons and photons, at that dose level as seen in [12]: Figure 1. However, now about 3 are DDSBs (≈ 6 DSBs) with higher biological effectiveness; thus ≈ 68-70 are ordinary plain DSBs (cf Figures 43 and 50). The true DSB number is thus more like 78 assuming 3 DDSBs were counted as plain DSBs and even higher for high LET beams with 3 times more DDSBs may have as many as 84 true DSBs so slightly more than true low LET beams.
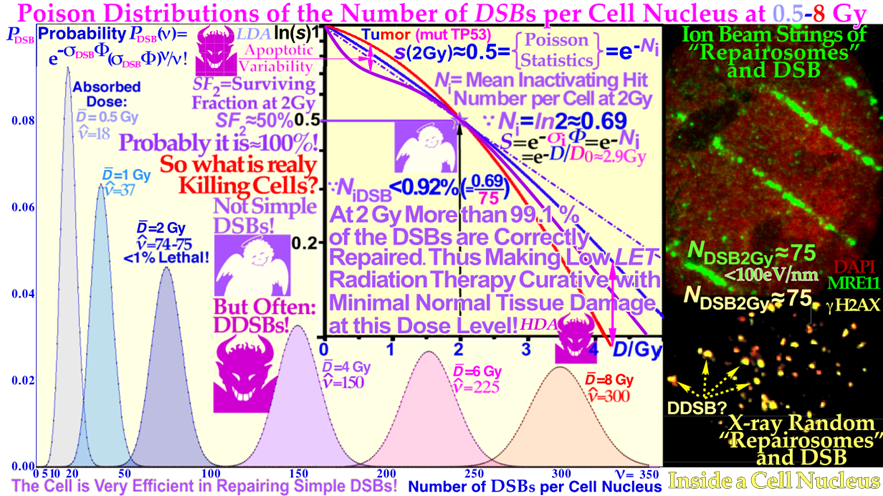
Figure 9: The induction of DSBs and Repairosomes as a function of dose and LET will largely follow Poisson statistics at least up to some 5-10 Gy and 100 eV/nm. Around 2 Gy, less than 1 % of the DSBs are lethal, as calculated in the middle insert (modified from [12]: Figures 1 and 2).
The right inserts show the structure of high LET ion and photon induced cellular Repairosomes or repair foci at a few Gy, and a cell nuclear width ≈10μm. Interestingly, 2 Gy low LET radiation is almost at the limit of producing a lethal event in normal tissues so it is a dose at the upper border of the fractionation window of normal tissues and higher should be reserved only for tumor tissue as seen in Figures 18, 19, 37, 45 and 49 [13]: Figures 47-53, 58, 78, 140. Figure 12 show that the 0.34+0.25+0.12≈0.7 potential killing events at 2 Gy are most likely due to the much more severe but fewer d -electron trackend generated DDSBs as discussed here and in more detail in [10, 11] and [13]: sec. 4.9-4.11.
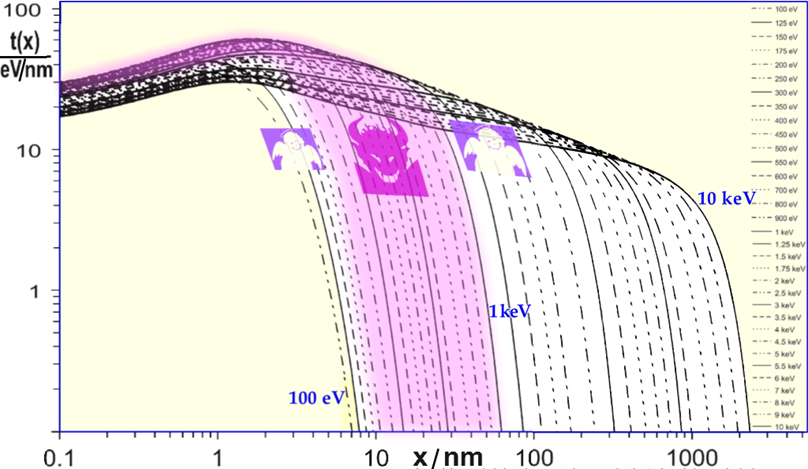
Figure 10: The Proximity function of 100 eV-10 keV monoenergetic electrons showing an almost constant maximum around 2 nm with a peak “effective LET” of about 50-60 eV/nm for 300-800 eV electrons as calculated in Figures 5 and 7, here indicated with similar shaded regions (modified from [45]). After an energy deposition at x=0 this figure shows the associated linear energy deposition density surrounding at distance x!
The early rice towards the maximum in Figure 10 is due to the extremely high multiple Coulomb scattering of these low energy electrons as shown in [12]: Figure 6 and [13]: Figure 18. Interestingly, this means that if a Delta- electron hits one of the DNA strands there is maximum probability that the other strand, 2 nm away, is also hit, making the likelihood for a DSB rather high. Consequently, making the need for efficient cellular repair of simple DSBs paramount, as has been developed by NHEJ and HR repair mechanisms over billions of years as demonstrated in Figure 47 and discussed in further detail in sec 4. The reduction beyond 2 nm is due to the fact that these low energy electrons have already reached their full diffusion ( ≈ 1.5 radians2 due to the high scattering power [50-52]) and are rapidly attenuated even if their stopping power may still increase (cf [13]: Figure 18 and the red forward d -electron point source kernel in the right most panel of its Figure 24). The local absorbed dose at the maximum may thus reach up to a MGy for sub keV d - electrons as explained in the upper right corner of Figures 7, 12 and lower right corner of 18.
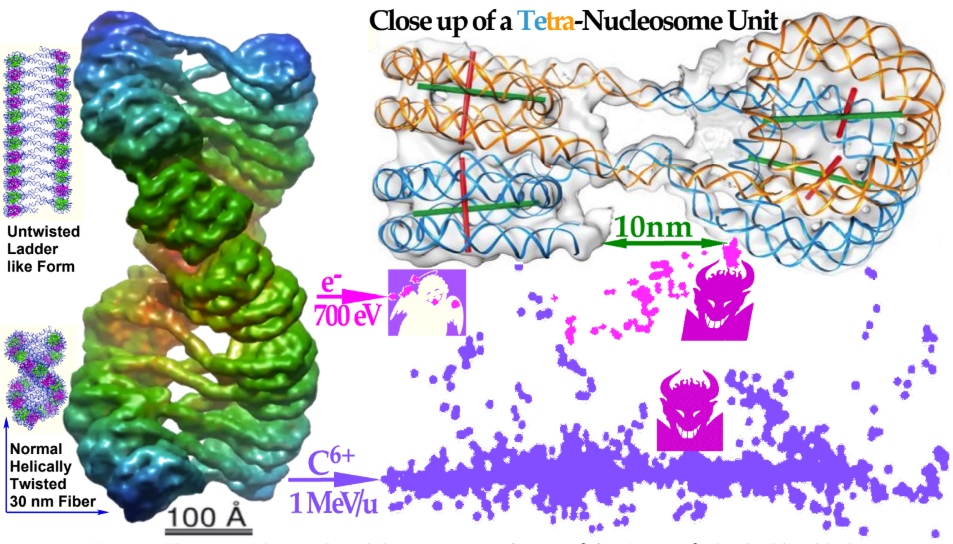
Figure 11: The tetra-nucleosomal modular unit structure (upper right) making up the key building block of the 30 nm twisted DNA fiber in its natural form to the left. Each tetra-nucleosomal unit cell consists of two dinucleosomes interconnected by 4 DNA strings
Two of these DNA strings continue to the next neighboring tetra- nucleosomal molecular subunit as may be seen to the left in the 30 nm fiber. A 700 eV δ-ray and a section of a carbon ion track approximately to scale is also shown mainly with its many secondary d-rays. Clearly, the individual nucleosomes are the key structural component of DNA damage as shown in further detail in Figures 12-15. Modified from [53-56] so the tetra-nucleosomal DNA fiber can continue to its next neighbors up and down the ladder to the left as indicated by the oblique 10 nm arrow (cf with the real resultant “DNA fragment ladder formation” in Figures 12 and 13).
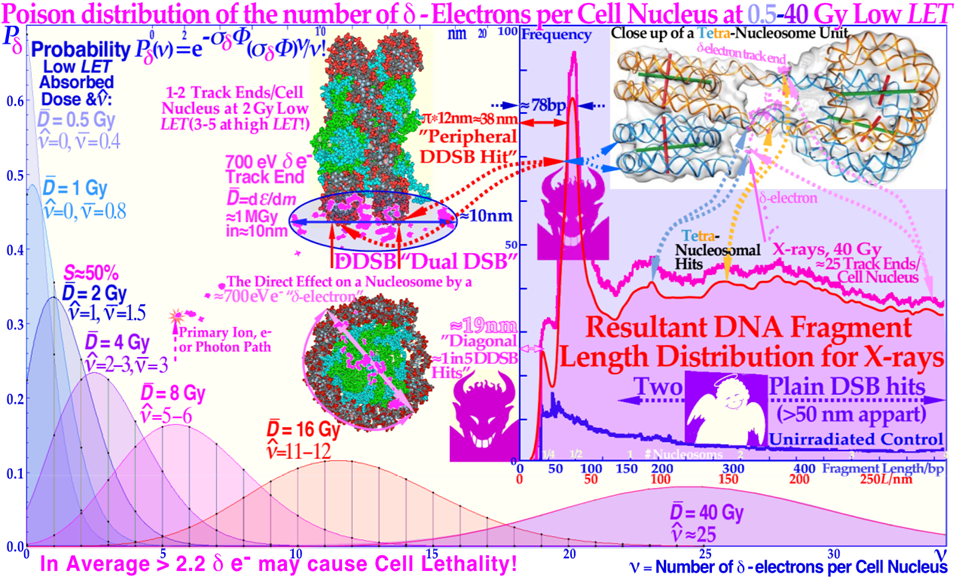
Figure 12: The Poisson distribution of the number of δ-electrons per cell nucleus at doses of 0.5–40 Gy of low LET. A likely DDSB event by a δ-electron is also shown to deliver approximately 1 MGy in a few hundred nm3 local volume at the periphery (cf. [13]: Figure 58) or diagonally at the side of a nucleosome resulting in the two shortest peaks in the DNA fragmentation insert, with a full turn fragment of DNA around the nucleosome. The ≈180, ≈300 and ≈400 base pair bumps are mainly due to the more complex nucleosomal tetramer structure here and in Figure 13 in the crossing middle region between two dinucleosomes causing less sharp peaks since the fragment length depends more on the exact location of the δ-electron hit sites. This is not the case for the peripheral hits that produce a full turn of DNA almost independent of where the hit took place around the nucleosome and thus maximizing its probability as seen for ≈35 nm or ≈78 base pair fragments. Modified from [10-13, 36] cf also Figure 13 for higher doses in X-ray and ion beams with a refined measurement technique.
In Figure 13 it is also seen that the widening of the principal DDSB peak for the nitrogen and helium fragmentation curves relative to photons that are always produced by a single d - electron. This all clearly explain that the DDSBs are the common therapeutic entity of low as well as high LET radiations [11-14].
The figures near the small peaks in Figure 13 indicate the approximate relative volume of DNA at risk for the different types of d-electron hits as indicated by their dual arrows of damage (mainly in the straight paths between the pair of di nucleosomes and the peak is slightly sharper with photons that lack d - electron multiplicity up to at least 50 MGy) whereas practically both the dinucleosome volumes contribute to the single high DDSB peak. By comparing the red Nitrogen curves at 80 and 200 Gy it is seen that when they are normalized at the DDSB peak height, the absorbed dose dependency is largely removed (cf Figures 12-13) and the small random variations may partly be due to the ≈5 % uncertainties in the background subtraction process.
Clearly, the individual nucleosomes are the key structural component of DNA damage as shown in further detail in [12, 13]. The tetra nucleosomal contributions is largely reduced by their rather high background levels [6, 13, 16] as seen in Figure 12 and [36, 46].
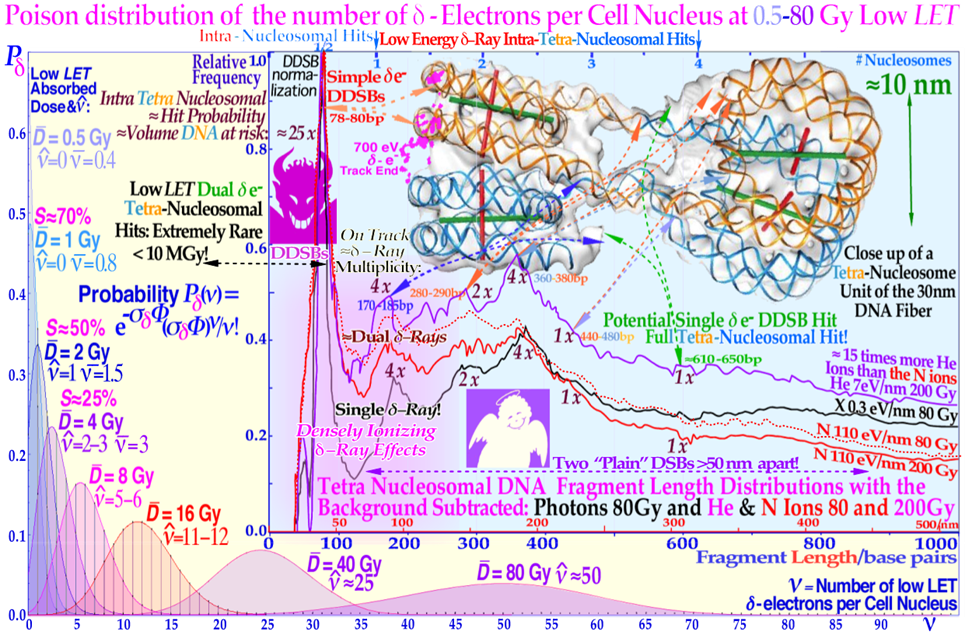
Figure 13: The Poisson distribution of the number of d -electrons per cell nucleus at doses around 0.5-80 Gy low LET and resultant induced DDSBs (at ≈80bp or 35 nm) and the associated DNA fragment length distributions produced inserted. A common DDSB event by a single d -electron is also shown delivering about 1⁄2-1 MGy in a few hundred nm3 local volume at the periphery of a nucleosome (cf Figure 12)
The risk is even higher in the di- or tetra-nucleosomal configuration [36] found in heterochromatin in Figure 13. The insert give an overview of the d-electron production and resultant induced DDSBs (at ≈80bp or 35 nm) and DNA fragment length distributions generated after irradiation with photons and light ions and show the great similarity between them when the spontaneous background distribution have been subtracted [57]. Interestingly, the DNA fragment distribution reminds of the ladder formation during apoptosis of nucleosomal DNA but is here largely produced by the short reach of the most severe sub keV d - electron track ends ≈10 nm (cf Figure 7 upper right corner) that are sure to be always all alone in the 30 nm tetra nucleosome unit volume at doses below 50 MGy with low LET radiation (black curve, cf [10-14]). This is not the case for light ions where the wide bushy d-electron tracks (cf Figures 11 and 15 lower right [13]) may increase the probability for dual local events and more, as seen by their higher event probability at low fragment lengths (red and violet N and He curves seen here) as also seen by the widening of the DDSB peak after normalization! The small bump at ≈620 bp is almost lost here it was believed to be an artifact [57] but is just the sign of a whole tetra nucleosome DNA piece as seen here unknown until [53] but more clearly in Figure 12 were the background was almost constant!
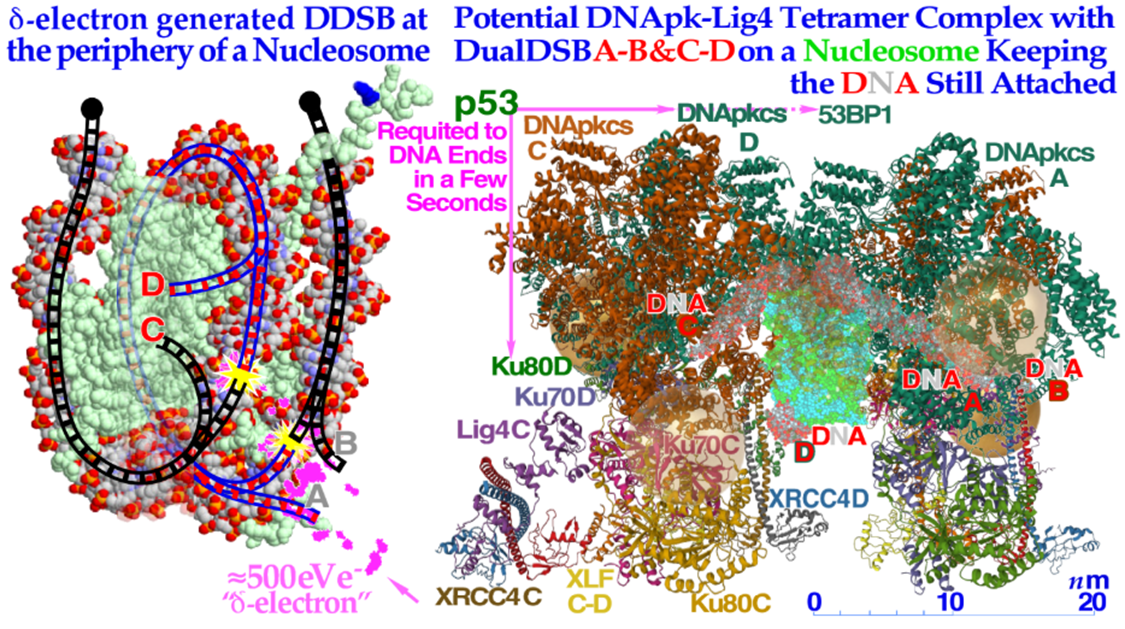
Figure 14: To the left, a δ-electron track end (pink) is producing a dual DSB at the periphery of a nucleosome. Interestingly, the A and D breaks are connected by a ≈35nm or ≈78 base pair DNA-strand (blue, cf Figures 2, 12, 13) whereas the B and C breaks continue to the surrounding DNA fiber (black dots) of the 30 nm string (cf Figure 11).
To the right in Figure 14, a DNApk-Lig4 tetramer complex tries to work on the dual DSBs A–B and C–D at the periphery of a nucleosome, keeping the DNA attached to the nucleosome. The partially translucent DNApk-Lig4 dimer complex (modified from 7NFC [58]), partially showing the nucleosome and at its periphery one of the DSBs with associated damaged DNA ends A and B to the right working in front of the nucleosome to repair them back together. For successful repair with a DDSB (cf Figures 7-9), both DNA strings on the nucleosome periphery are damaged at almost the same site, just a few nm apart, so a second mirror-imaged DNApk- Lig4 dimer complex should be working on the left to also repair and rejoin DNA ends C and D mirror-imaged behind (cf [12]: Figure 9). Potentially bound Ku 80 gold nanoparticles are shown (anterior translucent, posteriors partly hidden with DNA D not yet at its final position at Ku 80 D behind C) to indicate their likely associated assembled configuration (cf Figure 15). Often the distance A->D is too short to allow two DNApk dimers to work simultaneously on the DDSB and one of them may need a takeover by MRN dimer complex [60]!
This will most likely force the normal second Ku-DNApk dimer complex sometimes needing to be replaced by the MRN dimer complex where the Rad50s coiled coils gives higher geometrical flexibility (≈2x100 nm) using the HR repair system for correct repair if at all possible as discussed in more detail in [12, 13]. The MRN dimer complex is also commonly recruited to the DSB but probably a little later than the Kus and DNApkcs dimers and can sit behind them ready to take over if the DNApkcs get into repair problems as often happens with ion damage as seen here [1, 12, 13, 60]!
It is furthermore interesting to note, that of all copy number changes (CNC) sites of advanced breast cancer genomes that are caused by their high genetic instability, as many as 62% of them are collocated with common radiation induced chromosomal breakage sites (RIBS) on the human genome. These RIBS are often induced by DDSBs at genetically inferior DNA repair regions on the genome but only ≈40% of the CNCs are collocated at the more well-known common and rare fragile sites (FS [13, 61]).
To the right in Figure 15 a nm resolution view of a DDSB imaged using 6 and 10 nm gold nano particles to indicate pDNApkcs and pKu 80 respectively. Interestingly, the molecular view to the left describes half the DDSB (anterior part of the nucleosome) quite well enlarged about 4 times in the Transmission Electron Microscopy image to the right! The repair problem arises as the A and B ends can’t be brought together without dismantling the nucleosome at the same time as D on the posterior half of the DDSB is connected to A by a ≈35 nm DNA string (cf Figure 5, 9, 15) which can’t harbor two pDNApk dimers simultaneously as seen to the left in Figure 14.
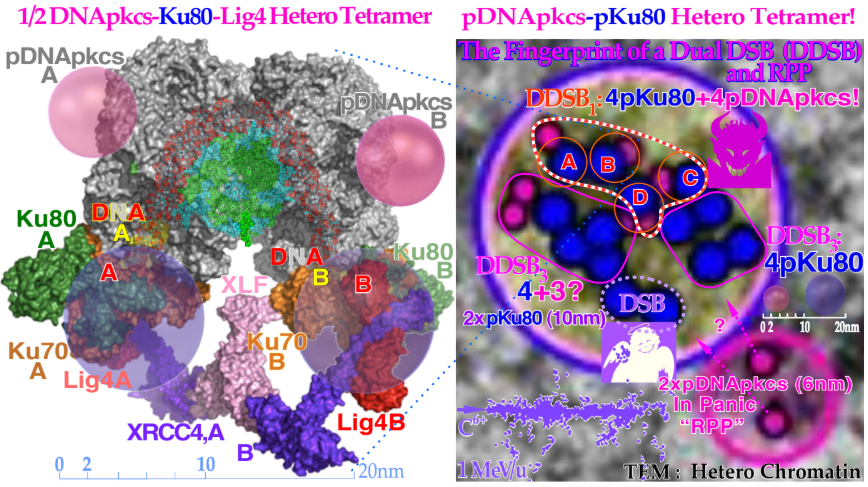
Figure 15: Left: Molecular view of a d-electron track end produced Dual DSB at the periphery of a nucleosome and the A and D breaks are connected by a ≈35 nm or ≈78 base pair DNA strand and whereas the B and C breaks continue to surrounding DNA as seen in Figures 12-14 [11-13]. Right: a close up view of a dense heterochromatin (dark gray) clusters with 7 DSB ́s and 3 most likely in the form of DDSB ́s.
The partially translucent DNApk-Ku dimer complex (modified from 7NFC [54]) working in front of the anterior DSB of the DDSB at the periphery of a partially opened nucleosome semi-translucently visible through the DNApk ́s trying to repair the damaged DNA ends A and B back together by recruiting the lower parts of the DNApk-Lig4 dimer complex with its associated big bluish Ku80 nano particles ([12] Figure 15). Right: A single d- electron may have produced them all. Interestingly, the DDSB with 4x pKu80 (dark blue labeled A,B,C,D) and 4x pDNApkcs (smaller 6 nm dark magenta beads inside black circles) is seen inside the red dashed curve in the upper DDSB cluster almost as expected from two of the left 1⁄2 DDSB1 [11-13]. It is not unlikely that a fourth DNApk molecule is hiding behind the left DDSB3 cluster whereas the right one is not reached yet. A short section of a carbon ion track to scale is also shown with its many secondary d - rays [25] and the ongoing recruitment of a pDNApk dimer to the repair site. The right TEM image indicate some problems on the C-D side that may require HR help as indicated to the right in Figure 14 and it should be available as MRN dimer complex may already bridge the DSB behind the DNApk dimer ([60] cf also Figures 8, 42 for DDSB1 shape and 43 indicating some 20-30 % of the 75 % of the DSBs produced in HR interactions are DDSBs and may be HR repaired after ≈48 hrs.). It is no wonder such damage clusters can generate severe local “Repair Protein Panic” (RPP) phenomena in cells first time proven here by nm resolution molecular imaging. The lower DNApk dimer arriving too late to a severe DNA damage site in reality needing 4 more dimers (cf also Figures 21b, 27, 49 and 50) showing that it regularly happens in ion beams of high M Gy ionization density cores at psec time scales.
Table 1 summarizes some of the key mechanisms making DDSBs and how important they are in eliminating malignant tumor cells during radiation therapy but also how to use them with maximum therapeutic advantage staying below 2.3 Gy in normal tissues (≈3 Gy Flash cf Fig 27) and elevating tumor doses by Super Flash preferably using 5+ Gy.
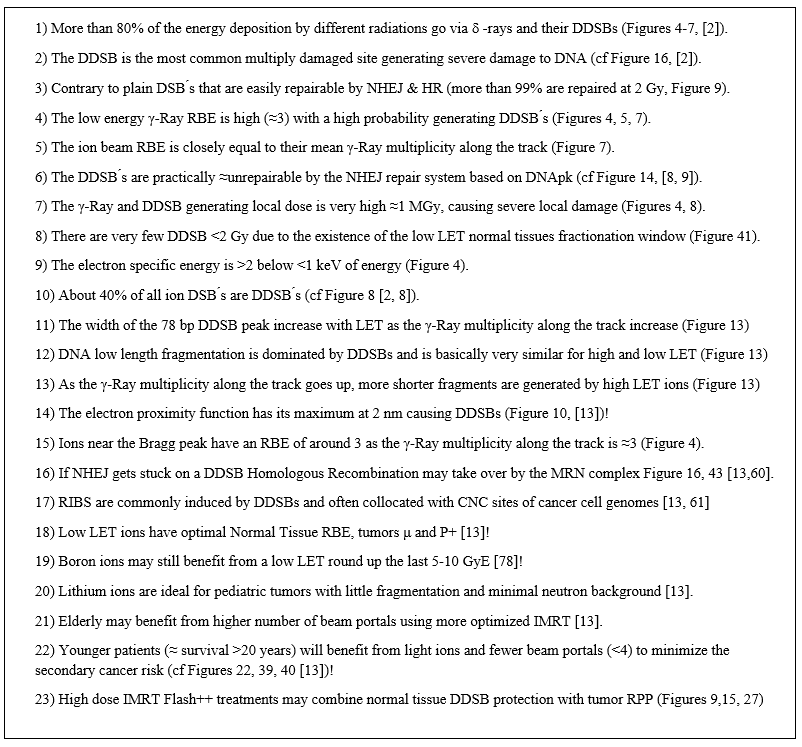
Table 1: The Principal reasons making cf Fig27Ray generated DDSB the Key Effectors of Radiation Therapy.
The new increased flexibility to describe the cell survival curve shape has resulted in a significantly improved description of low and high dose and LET radiation cell survival in mutant, wild type and repair gene knockout cells. It is well known that the Non-Homologues End Joining (NHEJ, [1, 14]) is the dominating DNA repair process of low LET and it is very fast, the Ku70, Ku80 and a DNApk dimer binds together the broken DNA ends in a few seconds and simultaneously recruits p53 [98], such that high dose and LET local damage also can be correctly repaired. This process is probably the first step of all DSB repair and really essential at high LET when the more flexible MRN dimer complex often replaces the Ku- DNApkcs hetero dimer if in trouble and the cell is in S or G2 phases of the cell cycle and may need the higher Rad50 flexibility and homology searching mechanism of Homologues Recombination (HR) for high fidelity repair [7, 59, 90]. This makes HR about 3 times more important than NHEJ at high LET ́s, partly also since less low LET type damage are induced as seen in Figure 20, 43. It has been suggested that most TP53-intact normal tissues are generally low-dose hyper sensitive (LDHS, see lower left insert of Figures 18 and 19 [6, 10, 11, 13]) and that the inherent microscopic heterogeneity of higher linear energy transfer (LET) ion treatments the last week of treatment would benefit substantially from a low LET round up, as shown in Figures 37 and 38 [6, 10, 11]. The possibility to quantify apoptosis [1] has helped identify the early low-dose hypersensitivity (LDHS) and low-dose apoptosis (LDA) of most normal tissues and tumors with intact TP53 and ATM genes [1, 6, 10, 11]. This mechanism has probably been developed early on by nature’s natural process of preferential survival advantage selection, to ensure minimal risk for severe mutations to the genome, before the DNA repair system is fully functional after a dose of ≈½ Gy [1-4, 6, 10, 16].
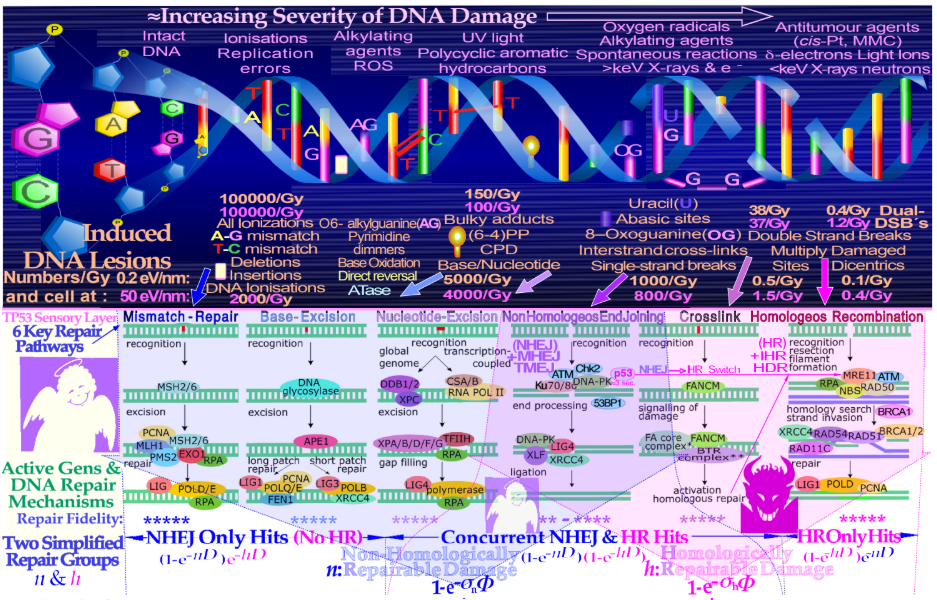
Figure 16: Different parts of the DNA damage spectrum induce a number of associated repair pathways that determine the probability that the cell is repairing its DNA and recovering from the damage. The current theory, for simplicity, splits the damage and repair into two main groups, depending on whether it was mild and easily and rapidly repaired or more complex, requiring the application of the slower high- fidelity homologous recombination (HR) machinery (cf Figure 43). This HR contribution is needed to clear possible misrepaired DSBs likely to be produced by non-homologous end-joining (NHEJ) at local high doses or LETs. The non-homologically repairable damage includes plain NHEJ and all the mechanisms to the left of it in the lower half of the figure. The TP53 sensory layer between damage and repair is shown in more detail in Figure 18 describing the wide range of sensory proteins and cellular response mechanisms. The speed of the Ku-DNApk heterodimer complex and TP53 recruitment to a DNA DSB, a few seconds, makes it the most likely starting point of practically all DSB repair absolutely necessary not to lose the right order in which the DNA ends belong together (as indicated by the horizontal pink arrow NHEJ->HR “switch” when the p53 sensory layer (see Figure 18 for further details) detects repair problems as seen in Figures 14 and 15 [previously such as HR assistance if a key NHEJ repair gene is knocked out or trapped and vice versa and HR may clear some NHEJ misrepair (see Figure 17 for all a little more complex and more simplified repair terms [1, 12, 34]).1, 4, 12, 20, 34]). There are also a number of other connections between NHEJ and HR as indicated in the figure.
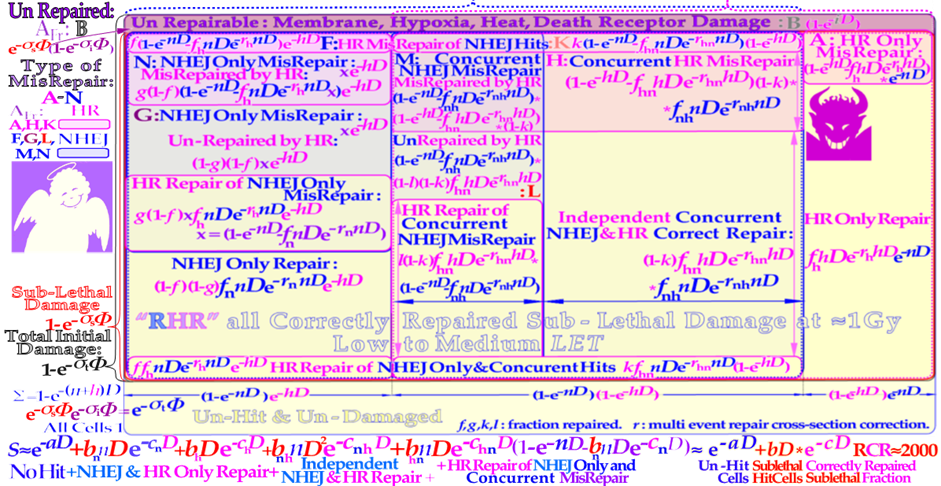
Figure 17: A vertical continuation of Figure 16 (upper half) showing the two main groups of DNA damage: non-homologically repairable damage (n) and the group requiring the homologous recombination (HR) machinery (h, cf lower part of Figure 16). A single cell can have n- or h-type damage or both resulting in different probabilities of repair (yellow areas) and misrepair (upper shaded areas). Interestingly, the new repair formulation is consistent with a fair probability of HR repair of NHEJ only and concurrent misrepair [1, 12]. The letters A-N are the fraction of each misrepair process that may lead to apoptosis; see [1, 34] for further details. The lower line show useful simplifications of the many correct repair terms in the yellow boxes above [1]!
The need for this mechanism was already pointed out in Figure 10 where it was shown that if one DNA strand was hit by a γ-electron the probability that also the other strand may get damaged was maximal due to the intrinsic property of the so called proximity function and its association with the scattering properties of low energy γ -electrons below ≈1 keV, since this function has a maximum at a distance 2 nm (cf Figure 14). As a compensating measure for the induced apoptosis, the apoptosis-inducing caspase 3 gene product (Figure 18 lower right [62]) remarkably “remembers” this protectively induced low dose apoptotic (LDA) cell loss and starts cellular repopulation to reestablish homeostasis in the tissues after they are being irradiated. With a too high LET from carbon and beyond, apoptosis and senescence will instead be high in the normal tissues in front of and behind the tumor, which definitely is undesirable from a complication-free cure point of view, even if hypoxic tumors may marginally benefit from a higher LET (cf [11]: Figure 22, [13]: Figures 112, 114 and 117).
It is well known that the nonhomologous end-joining (NHEJ, [1-3]) pathway is the dominating DNA repair process at low LET, and it is very fast. Ku70, Ku80, and a DNApk dimer try to bind together the broken DNA ends in a few seconds and simultaneously recruit p53 [3, 63], such that the multiple DNA strand ends at high-dose and LET local damage can be repaired together in the right order except possibly for the γ-electron generated Dual DSB (DDSB) produced within a picosecond [11]. This process is essential especially at high LET levels when the MRN dimer complex often replaces Ku-DNApk heterodimers not least if the cell is in the S or G2 phase of the cell cycle, and the homology-searching mechanism and higher flexibility of Rad50 of the MRN dimer and HR is needed for high-fidelity repair [11-13, 60]. The new HR and NHEJ DNA repair and misrepair terms seen in Figures 16 and 17 make it possible to describe cellular repair far beyond the conventional linear quadratic model (LQ) such as apoptosis (see Figures 19, 20) and senescence and LQ model (cf Figure 21) is clearly unsuitable for describing normal tissue responses [1, 8, 10].
Interestingly, the new DNA repair-based formulation inherently describes LDHS and LDA as they are linked to the DNA repair system of most, if not all, normal tissues, as described in further detail in Figures 18 - 20 [1, 11, 13]. These figures illustrates how the TP53 gene works as a complex cellular mastermind and controller by determining how depending the structure of DNA damage it should best be repaired and whether senescence and apoptosis are needed [1, 2, 13, 60, 64, 65]. As seen from the lower left insert in Figure 18 (cf also Figure 32 and [13]: Figures 48, 49, 140), after a total of 1⁄2 Gy or 18 DSBs, CHK2 is also phosphorylated and so is the serine 20 site on p53 which results in a gradual switch in normal tissue sensitivity from an initial LDHS stage to a more radiation-tolerant almost LDRR like state. In fact, the well-known experimental demonstration that the LDHS property can be eliminated by low-dose preirradiation is a clear indication that the first 1⁄2 Gy is needed to start up efficient DNA repair and get a more LDRR like state which is ideal for opening the classical 2Gy/Fr fractionation window (cf Figures 40, 43)!
Interestingly, after that, the cellular repair system is fully activated at least for wt and functional p53 tissues, with reduced cell loss and almost a survival plateau towards 2 Gy [1, 3, 10, 66-71]. It is clear from the Figure 18 insert and Figures 19 and 32 that doses well above 2 GyE are truly needed for significant tumor cure, but the dose to normal tissues should be just above 2 Gy or close below to ensure optimal radiation recovery, as seen in Figure 25 (more in detail explained in [13]: Figures 49, 50 and 81-84). The LDA and LDHS of normal tissues are caused by 5–15?ute low-dose apoptosis (cf Figure 20, [13]: Figures 47-49 and [1, 4-6]), but interestingly, most likely, due to the compensating measure of caspase-3-induced cellular repopulation [59], late effects are therefore few as it try to compensate the apoptotic cell loss. This will re-establish homeostasis in normal tissues and thus minimize late normal tissue damage. Furthermore, it helps generate a fractionation window in normal tissues (cf Figures 18, 19, 25, 27, 32, cf [13]: sec 5.4-5.7), but it may sometimes also repopulate malignant tumor clonogens if they are not eradicated by the treatment [59].
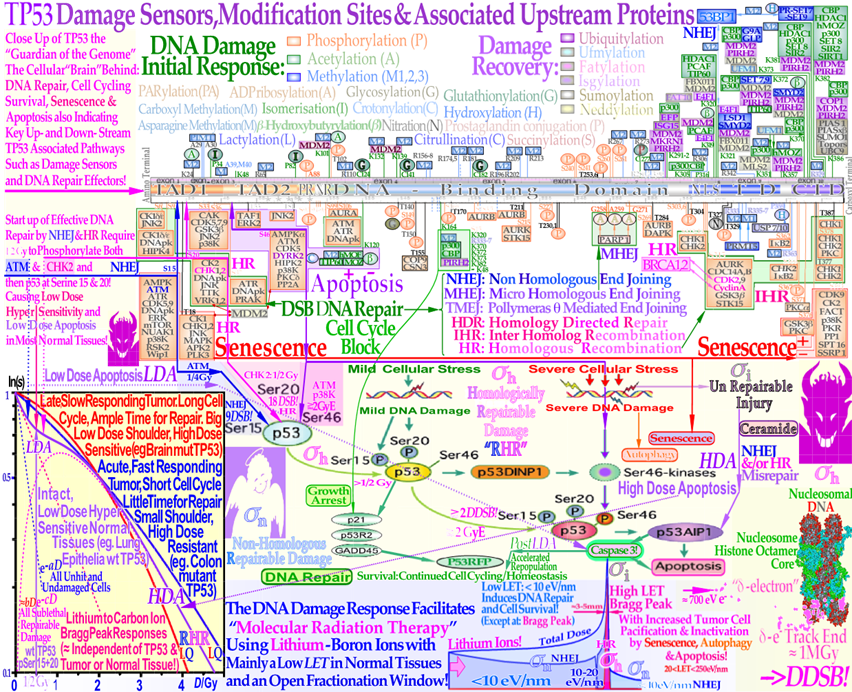
Figure 18: Close up of the TP53 sensory layer in Figure 16 which largely determine the cellular response to different types of DNA damage such as that produced by radiation beams [1-8, 13]. Mild stress as seen in the low middle of the Figure phosphorylates the Serine 15 and 20 sites on p53 by ATM and CHK2, resulting in cell cycle block and initiation of full NHEJ and HR DNA repair.
This results in normal tissues LDHS but generally not in tumors that often suffers from a mutant TP53 gene, as seen in the cell survival insert here and in Figures 18-25 and 52. Local high doses and high ionization densities (LET) are resulting in DDSBs (Dual Double Strand Breaks as seen in the lower right corner [1, 6, 10, 16]) that increase the severity of the damage as seen in Figures 11-15. With a couple of DDSBs, ATM and e.g. p38K are capable of phosphorylating p53 on its Serine 46 site, and a high-dose apoptotic (HDA) response may get triggered as seen here and in Figures 20 and 32. DDSBs are the most common multiply damaged site and their probabilities are determining the biological effectiveness of different types of radiation as seen in Figures 3-5, 7, 13 [1]: sec 6 [11, 13]. For further downstream pathway details (cf [68]: Figure 1) and for the influence of nucleosomes and histones on repair see [44, 69, 70]. The lower panel indicate that Lithium-Boron ions allow a unique therapeutic use by inducing massive apoptotic-senescent tumor cell response mainly within the Bragg peak and not in normal tissues (σh, σi: cf [1, 13]: Figures 26, 27). In front of and beyond the Bragg peak, the LET is low, and non-homologically fast and easily repairable damage is mainly induced (σn: [1]). This unique property of the lightest ions can best be characterized as allowing molecular radiation therapy since the highest possible apoptosis and senescence can mainly be induced in a 5 mm size spot, with mainly low dose and especially low LET in the surrounding normal tissues with predominantly a low level of milder type DNA damage [1,6,10,13].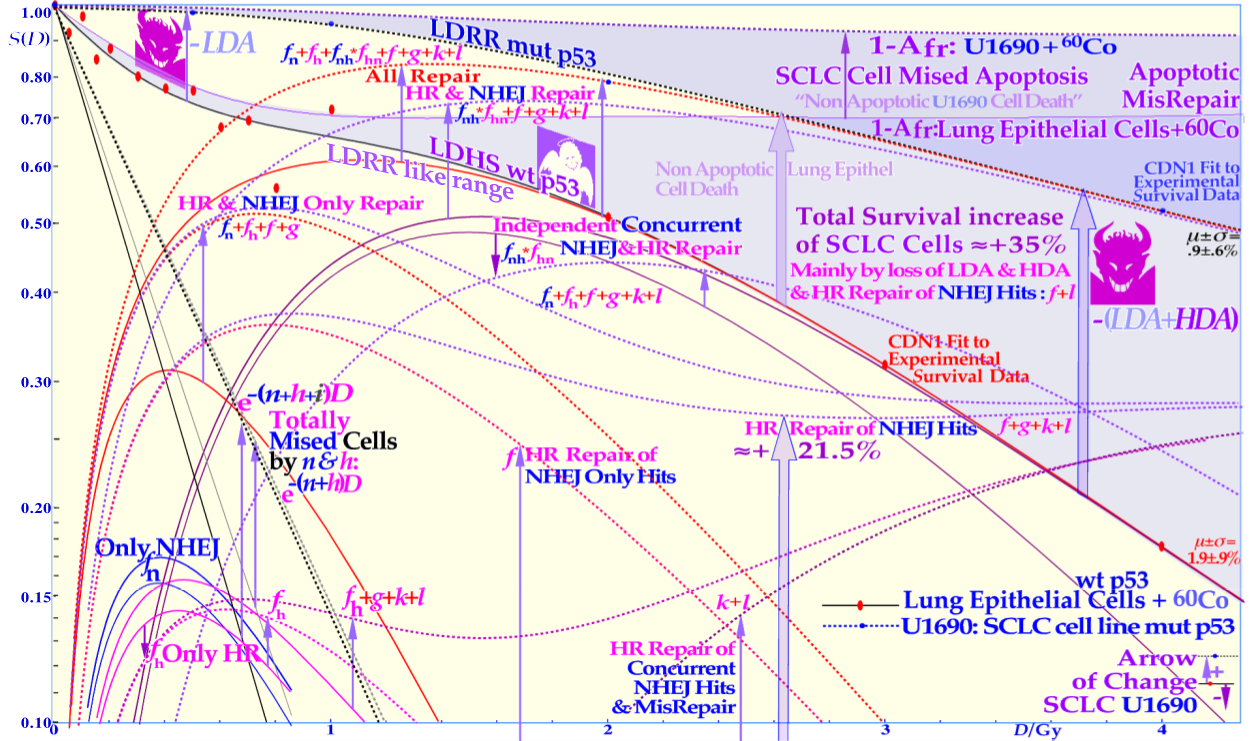
Figure 19: The normal lung epithelia (solid lines, red dots) compared with a small cell lung cancer (SCLC) cell line (dashed lines, blue dots) showing a substantially increased survival due to its low dose radiation resistant (LDRR) phenotype likely to be caused by its TP53 mutation. It is seen that practically all the LDA is lost and most of the HDA too without a well-functioning TP53 pathway.
The SCLC cells were irradiated without hypoxia so in a clinical hypoxic tumor its response may look even worse (cf [13]: Figures 126, 127).
This figure also shows a number of the underlying repair phenomena [1, 11]. The normalizing effect of reactivating this TP53 mutant cell line by PRIMA 1 was shown to make some apoptotic normalization (+15%) and simultaneously improving the therapeutic effect of reactive oxygen species at high doses (cf [13]: Figures 41, 120 and 121 [1]).
This means that LDA and LDHS truly protect normal tissues from potential low-dose mutations before NHEJ and HR are fully functional and can address the damage (cf. [13]: Section 4.7). So now as we start to understand the magic function and therapeutic property of the 2 Gy/Fr classic low LET optimal fractionation window and we can summarize how to best use it clinically:
1) Don't surpass the two Gy/Fr Low LET dose level to avoid undesirable DDSBs in Normal Tissues (cf Figure 9 and sec. 2)
2) Use the acquired Radiation Resistance and efficient DNA repair in Normal Tissues induced after 1⁄2 Gy Low LET dose as far as possible up to ≈2.3 Gy or 3 Gy <50>3) Don't surpass the 2.3 Gy/Fr to avoid High Dose Apoptosis (HDA) in Normal Tissues (cf [13]: sec 5.6-5.7)
4) Accept the Low Dose Apoptosis (LDA) in Normal Tissues to get “2)” since caspase 3 reestablishes homeostasis by accelerated repopulation when they no longer are irradiated (cf [13, 62])
5) In fact, ≈2 Gy/Fr minimizes Normal Tissues Apoptosis since we have to accept at least 1⁄2 Gy to be able to treat at all and thus LDA and Caspase 3 repopulation, but no HDA and late damage [6, 13, 62]!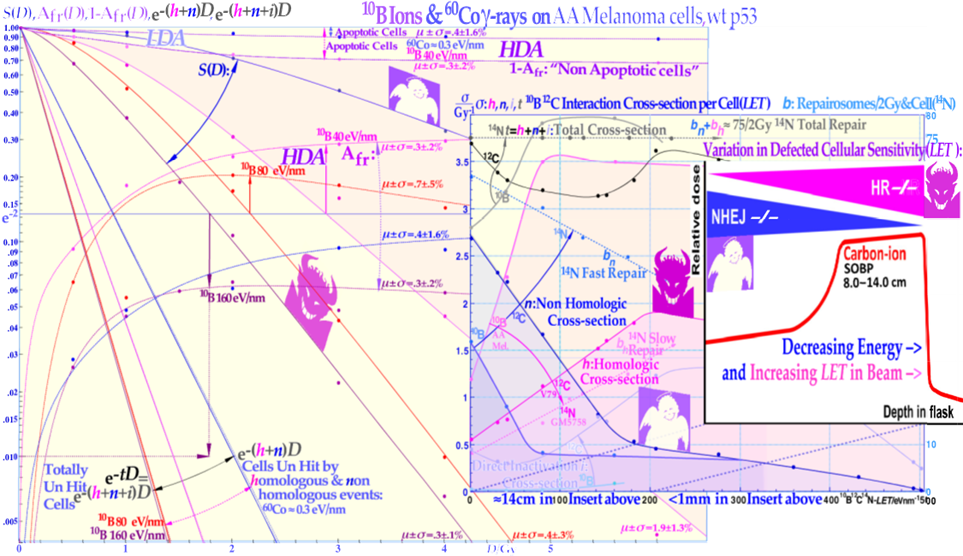
Figure 20: The cell survival, the cell fractions that are totally un-hit by the beams and the apoptotic and non-apoptotic death over the LET range 0.3-40-80-160 eV/nm by 60Co to Boron ions. The cell survival shows a gradual increase in steepness with increasing LET whereas the Afr has maximum near a dose causing around 13.5 ?ll survival (D≈2D0) as indicated by the arrows.
For the two lowest LETs, the non-apoptotic cells, upper dashed curves, and the clonogenic survival are practically tangential at low doses indicating apoptosis is the preferred way of cell death before p53 is phosphorylated at its serine 15 and 20 sites at > 1⁄2 Gy as expected by LDA (cf Figure 18). The shaded area is due to non-apoptotic cell death fraction for 40 eV/nm boron ions. The first right insert shows the LET variation of the non-homological and homological interaction cross-sections n and h for DNA repair after 10B irradiation but also 12C ion data (as determined in [8]: using its Eq (34a)). The homological cross-sections h increases very fast with the LET for 10B ions due to rapidly narrowing -electron cores and the associated reduction of the n cross-sections. The recent carbon ion insert (far right, modified from [43, cf also 44, 45]) show the change in sensitivity of NHEJ and HR deficient cell lines as a function of depth (and thus LET for C) and it is in total agreement with the LET dependency of n and h 12C cross-sections (follow the fine dashed lines), 3, years previously derived in the lower insert now with similar pink and blue shading (cf [1]: Figure 8, [8]: Figure 18)! The similar curves from Carbon and Boron ions are also consistent with the slow and fast repair of Nitrogen ions as the homologous repair is known to take significantly longer time (cf Figure 42, [1, 12]).
It is fascinating that today, after 125 years of curative radiation therapy, we start to understand how the molecular mechanisms behind an intact TP53 gene makes 2 Gy/Fr so useful in the clinic, and when it is commonly mutated in the tumor, we may need biologically optimized IMRT, IMRT-Flash++, light ions and even p53 reactivation, to achieve the best ever complication free cure for the quite common and problematic LDRR tumors (see Figures 19, 20, 27, 28 [11, 13]). To fully understand the underlying repair processes (as seen in Figure 19, 20, 27) the original publications are really needed [1, 11, 13, 17, 92].
As shown in Figures 34, 37 and 44 when there is only a few viable clonogenic cell left in the tumor during the last week of a curative treatment it is unsuitable to try to use high LET ions to hit them. Even if ions generally are our sharpest tool available to treat malignant tumors, but only if we know exactly where the clonogens are located and where to aim the beam to hit all the clonogenic cell nuclei! In fact, if we know precisely where e.g. 2n cells are located, we need just n ions as each ion can hit at least 2 cells in one shot when we know where they are! Obviously, the n ions we will need may have to come from rather strange directions depending on the exact locations of the 2n cells. If we don't know where they are, according to Heisenberg’s Uncertainty Principle applied to ion-beam radiation therapy on this simple case, we need a beam at least as large as the tumor if we wish to be sure to hit them all. In fact, the beam actually need to be a little bit bigger than the tumor, as there are also uncertainties in the beam patient set up and alignment [69-71]. But not least, we need also to consider the quantum biology of curative radiation therapy, so we don't get a microscopic ion beam cold spots on some of the clonogens as seen in Figures 34, 37, 38.
However, at the beginning of a treatment with millions of hypoxic tumor cells, ion beams are the most effective treatment as independent of where we aim the ions, we will hit thousands of cells. If you have an ion path through millions of cells its effect on the tissue is well described by the dose average pencil beam kernel as it is the average response that counts which is given by taking the average effect on the millions of cells around the beam which is exactly the definition of the mean dose distribution of the beam over cell nuclear sizes (cf Figure 24).
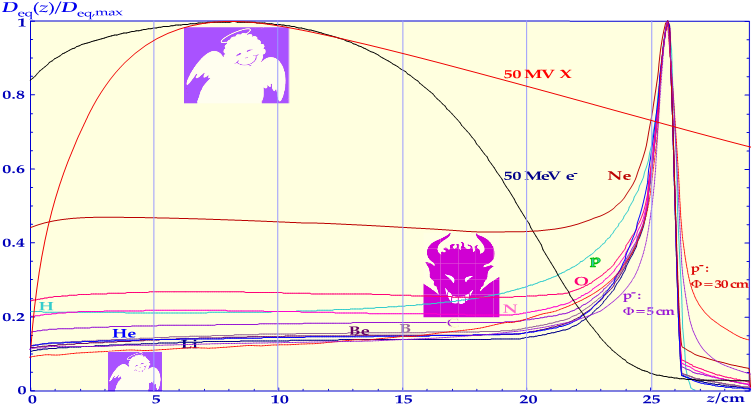
Figure 21a: The biological advantages of lithium to boron ions are illustrated more clearly here by combining the energy deposition in Figure 22 with the biological effectiveness in Figure 7 and normalizing to the obtained mean biologically effective dose at the Bragg peak. For a given dose in the tumor and Bragg peak, the lowest biological effect in the plateau region with normal tissues is obtained by helium, lithium, beryllium and boron ions. Neon, oxygen, nitrogen and anti-protons cannot be recommended for human use due to excessive normal tissue damage. The anti-proton annihilation energy is 2000+ MeV and even if most are stopped in the walls of the room, it makes a lot of local damage in broad beams (cf Figure 2). 50 MeV positrons (anti-electrons) may be a little more useful clinically but almost equally awkward to make.
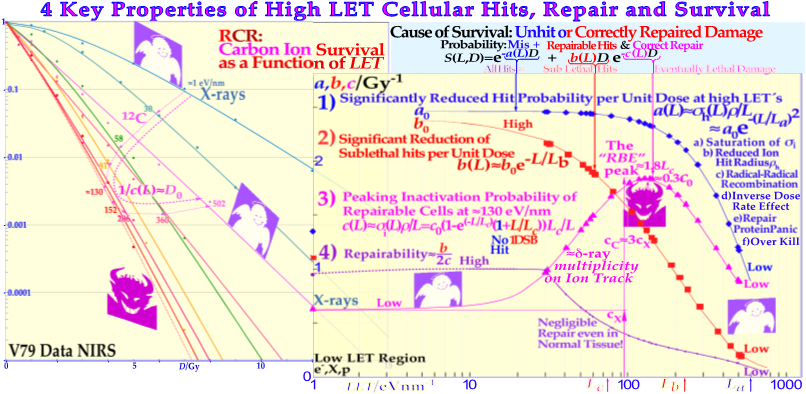
Figure 21b: The LET dependence of the RCR parameters a, b, and c for the V79 cell line and 12C survival curves to the left. It is interesting to note that the curves describe the four key properties of light ions: (1) the total hit probability a(L) is almost constant at low LETs and decreases as the cross-section saturates (cf. Figure 6), whereas, (2) the sublethal repair potential b(L) is exponentially decreasing with LET, and (3) c(L) express the LET dependence of the RBE peak near 130 eV/nm. The LET dependent parameters a, b, and c to the right reproduce the survival curves connecting the experimental data points to the left almost perfectly and (4) the reparability ≈b/2c. (modified from [72, 73]).
To be able to interpret the biological effectiveness in terms of the effective multiplicity of Delta-electron along the ion track is remarkable as explained above (cf Figure 7). This is probably the best way to explain the steep reduction of a, b, c at the highest ionization densities and LETs as the electron energies are reduced (cf Figure 5) and the ion hit and kill radii are severely reduced even if the multiplicity is very high but so is radical-radical recombination (cf a(L))! The biological effectiveness is almost equal to the effective Delta-electron multiplicity along the ion track (100 eV – 1 keV, cf Figure 7) is remarkable and that the higher energy Delta-electrons (>1.5 keV) are not too important as they are few and most of their energy depositions are low LET as seen in more detail in Figures 5 above. The good fit is based on the underlying experimental survival data to the left and [35]! It is quite interesting to see that the fast Bragg peak of ion beams for obvious reasons have very similar survival problems as ultra-short pulses of electrons and x-rays as clearly seen here and in Figures 15, 27 resulting in “Repair Protein Panic” (RPP) as the Kus and DNApk dimers don't reach damage sites in time.
If there is only a few clonogens left such a mean deposition kernel is too crude, and we have to look at the probability that at least one of the remaining clonogens is missed by the beam and may repopulate the tumor! And today we know very well that this may happen since caspase 3 is likely to step in after the treatment (see sec 4.7), trying to recover normal tissue homeostasis by accelerated repopulation of remaining tissues. Thus it is truly a necessity to eliminate the very last tumor clonogen simultaneously avoiding its accelerated repopulation. Interestingly, if we instead could produce a new type of “deterministic truly microscopically quantum uniform ion beam” where all ions were exactly known to travel in parallel but also on a precise hexagonal grid as illustrated in Figures 32, 33, we could improve the curability substantially! With a fixed separation of for example 7μm.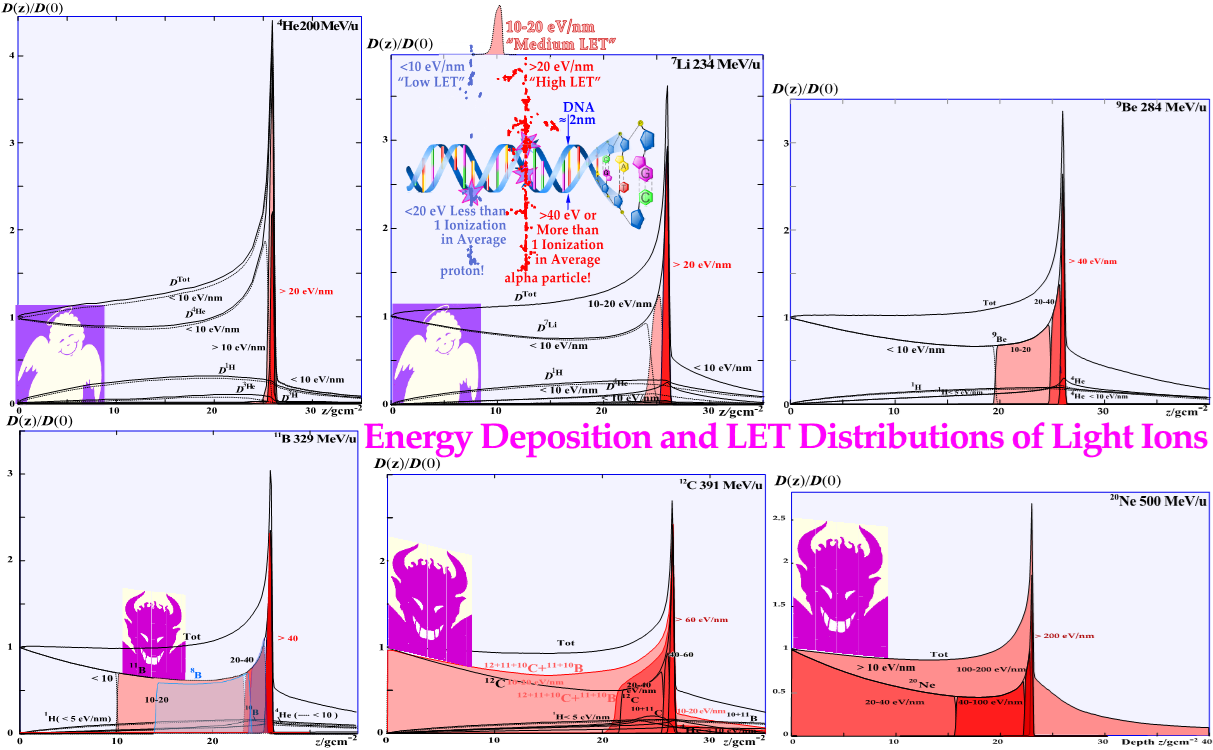
Figure 22: Depth dose and LET distributions for the 5 lightest ions after protons: helium, lithium, beryllium, boron, carbon and neon that were carefully tested at Berkeley. The dose fraction delivered at an ionization density below 10 eV/nm is unshaded because when an ion passes, a 2 nm DNA string less than 20 eV is on average deposited, so no local ionization is generally obtained on average, as seen inserted in the upper middle Li panel. It is clearly seen that lithium ions has a high ionization density only in the Bragg peak, whereas carbon has it 5 cm in front and ≈10 cm behind the Bragg peak. Lithium is therefore the most conformal radiation modality, only providing significant apoptosis and senescence in the few mm Bragg peak, which is perfect for inducing programmed cell death only by its peak ionization in target tissues (cf Figure 4 [1, 6, 14]). The high LET component increases rapidly from only a few percent for protons and 50% for helium and 80% for lithium. Beryllium and not least boron 8 ions are located between lithium and carbon and are of interest for medium to large size tumors see Figure 23. Beryllium is likely to oxidize in the tumor (BeO) which is highly toxic but could defuse out of the tumor region and make problems for the patient at least as the last tumor fragments are decomposed for elimination out of the body.
From the interesting cell survival curves in Figures 19, 20 and dose response relations for photons and light ions in Figures 36 and 37 one can naturally ask which beams are most suitable for radiation treatments to minimize adverse reactions in normal tissues and maximize the complication-free cure. This question was recently discussed in some detail [1, 6, 11-13, 77- 79], and many of the new biological ideas discussed here may need renewed consideration for treatment planning and optimization. To look closer up on what is probably the most interesting ion for radiation therapy of bulky tumors: boron 8, and to compare it with the presently dominating carbon 12 ions, their dose and LET distributions are assembled together in Figure 23. Most interesting is that we can see a significant reduction in the plateau region ionization density with boron 8 ions (and B11 cf Figure 22). Not only is all the medium LET region of carbon replaced by lower LET boron ions, but the ≈5 cm wide high LET region in front of the carbon ion Bragg peak is only 2 cm with boron 8 ions, and the fragmentation tail is practically all low LET. Interestingly, this will increase boron apoptosis and senescence in the tumor and simultaneously reduce it in normal tissues, as recently demonstrated experimentally (cf Figures 39, 40 [13]: Figures 45, 46, 101, 102, [1, 6, 14, 23]).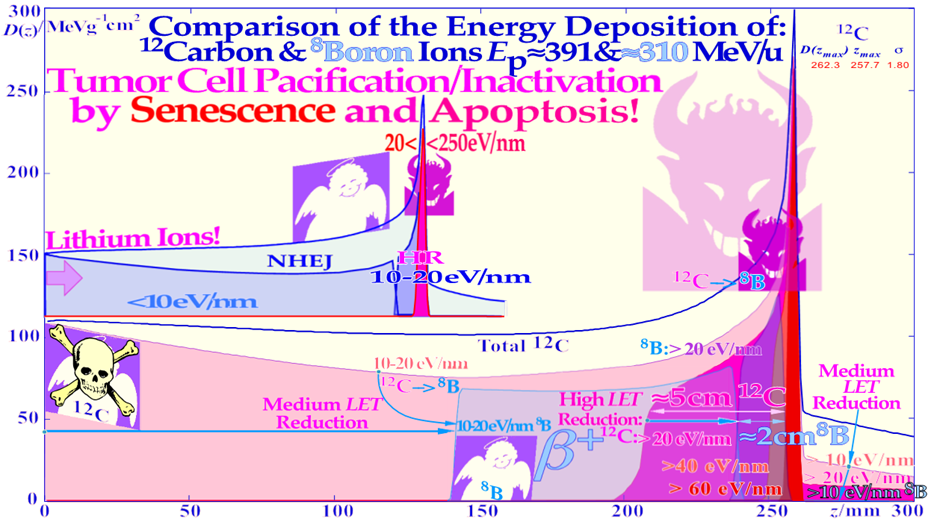
Figure 23: Carbon ion with superimposed boron ion beam depth dose and energy deposition density distributions (LET) for biological effect comparison (cf Figure 18). The adverse biological effects of carbon ions in the entrance and fragmentation tail regions are significantly reduced by boron ions (pail blue shading). With sensitive organs at risk in front of and behind the tumor volume, the high LET reduction will also be a further important advantage of boron ions, as they will generate more apoptosis and senescence in the tumor than carbon ions, as recently demonstrated [1, 6, 14]. Interestingly, this is also likely to partly reestablish the important low LET fractionation window of photons and electrons in normal tissues with boron ions (cf Figures 20, 22, 24, [78])! Unfortunately, the carbon ions also get far too dense DDSB clusters toward the Bragg peak, as shown recently (Figures 13, 31 and 50 [6, 10]), again indicating the need for lighter ions reducing the apoptosis and senescence in normal tissues (cf Figure 6). For pediatric tumors lithium ions is even more advantageous as seen in reduced scale above and so may the new Super Flash++ approach be assuming not too massive malignant disease (cf Figures 15, 25, 27, 29c)!
The only drawback is that Boron 8 is unfortunately a little difficult to produce since it is our lightest Beta+ emitter with a half-life of just under a second. Interestingly, this has the advantage to make it possible to visualize the dose delivery in real time during treatment by whole-body PET-CT imaging. This is possible since the acceleration is fast (msec) and as the ion comes to rest in the tumor, it will emit its positron within a second or two so it has to be imaged during treatment unless the treatment is done in a fraction of a second and the patient can instantly be moved to the PET-CT camera (20% is left after ≈1.8 s) or vice versa.
It is possible to produce boron 8 in flight in a boron 10 beam on a liquid deuterium target, but the yield is quite low (less than 0.001 [78] as two neutrons need to be knocked out). It may be more efficient to use a beryllium 9 beam on a liquid hydrogen target to knock out a single proton and use the filtration techniques developed at Karolinska for C11 [80-83, cf also 84, 85], or the interesting method developed at CERN may even be the most optimal approach [86]. The SOBP method generates strong variations in ionization density and absorbed dose. The variation is a factor of approximately two over the whole target volume for carbon ions, with a too low LET at the anterior end and too low dose and too high LET at the distal part of target volume, as seen in Figure 24. An even clearer comparison of the advantages of different radiation modalities in Figure 21 is given in Figure 25 where they are compared in a parallel opposed beam geometry which may be a bit suboptimal at least for IMRT treatments as seen in Figure 29b lower left insert.
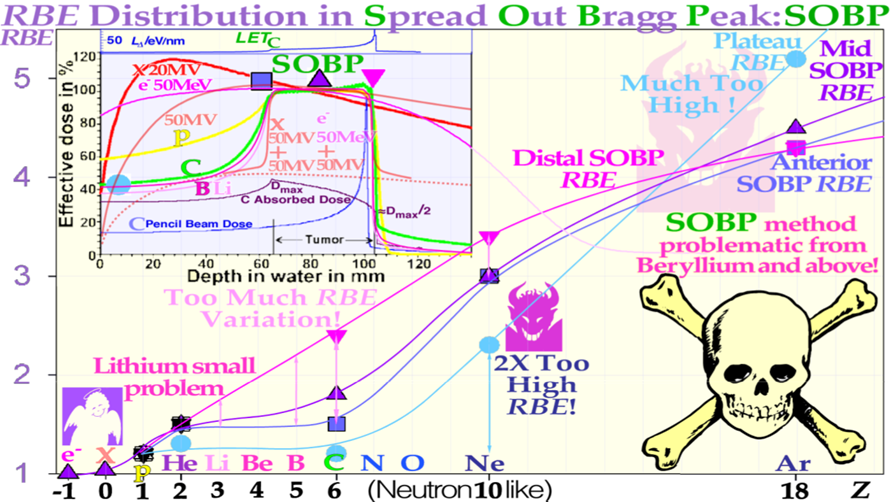
Figure 24: The relative biological effectiveness varies substantially over the SOBP of carbon ions. This will make the dose at the distal target volume low and LET very high, making the risk for microscopic cold spots high and increasing the risk for a recurrent tumor [6]. Two perpendicular high-energy electrons and photons, beams make a sharper and better high-dose dose distribution than a proton SOBP even if the dose behind the tumor is lower with p (but accompanied with more neutrons than any other ion beam see [13]: sec 6.9 and Figure 98), making He, Li, B, and C ions most interesting from a therapeutic point of view. With B or C ions and He or Li ions, the method with two different intensity modulated beams will eliminate the single beam SOBP problem clarified here, and shown in more detail in [13]: Figures 106-109.
It is seen in Figure 25 that you have to go all the way to 50 MV photons to get good dose delivery but 40-50 MeV electrons are much more superior with low entrance and exit doses almost as good as light ions at least if we compare the probability for normal tissue damage. However, if we also consider the risk for secondary cancers the lithium ions may be more optimal (cf Figures 25 and 40). In figures 26 -28 different mixed beam delivery techniques are compared and it is seen in Figure 26 that the combination of X rays and neon or nitrogen ions and neutrons can produce interesting synergistic effects in particular if they are delivered nearly simultaneously as summarized in Figure 28. They have to be delivered within a few seconds and preferably at high doses to get 20 to 40 % increase in effect and if the time interval is more than 30 seconds we can lose 20 % of the efficacy! Equally interesting is the high dose effect at ultrahigh dose rates observed by Todd 1968 [91] and Brahme 1979 [92] as shown in Figure 27 and have passed largely un noticed by the Flash community. The effect was largely understood at the time [92, 1977] but it was before the IMRT era so a bit difficult to use clinically but today it may be useful with advanced IMRT technology to deliver more than 10 Gy with nsec pulses practically simultaneously without delivering more than 2.3 Gy to max 3 Gy to normal tissue of high dose rate lower effectivity dose as seen in Figures 15, 27 and explained in the Figure text. This method would be able to inject new life in the Flash community that probably has lived on a weak non-understood reverse high dose rate effect in the tumor as seen twice in Figure 27 and may have influenced some experiments much more than the low dose protection which ought to be similar in the tumor and normal tissue (ion-ion recombination chemistry cf Figure 21b).
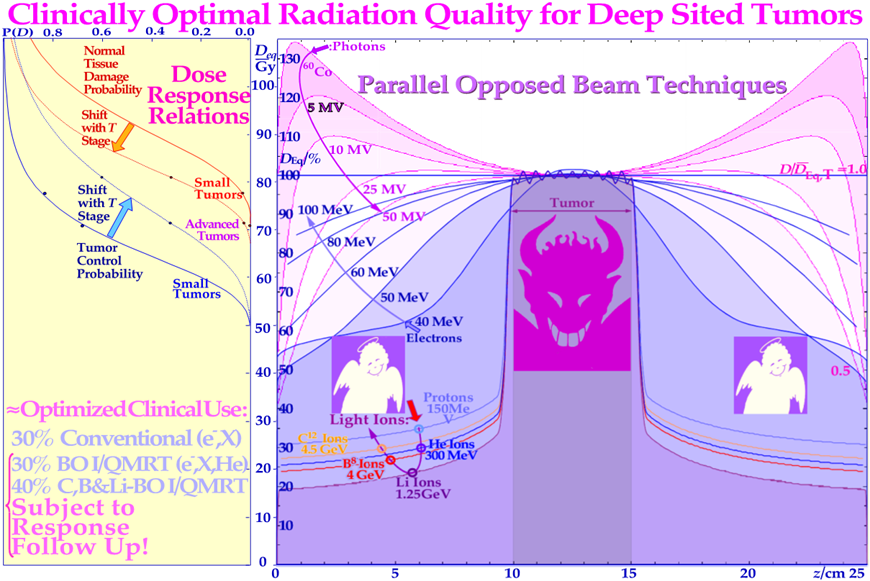
Figure 25: Comparison of the biologically effective dose distributions when irradiating a deep-seated tumor using parallel opposed photon, electron, and light ion beams is shown. This is probably the best geometry for a serious comparison of the therapeutic properties and quality of different radiation modalities even if it is suboptimal for photons! It is clearly seen that the normal tissues surrounding the tumor are considerably less damaged with the lightest ions around lithium (cf. Figure 21 and [13]: Figure 117). For hypoxic radiation-resistant tumors, the clinical advantage is even larger for the light ions beyond helium. For well-oxygenated tumors, the difference is less significant and protons and electrons can be used with rather small differences in clinical response since both generally deliver doses that are below the threshold for significant normal tissue damage as shown by the common clinical dose-equivalent–response curves in the left panel. In both panels, a vertical effective dose scale is used in Gray-equivalent and percentage, respectively indicating almost negligible damage both with high energy electrons and protons. In addition to the longitudinal dose distribution shown here, the lateral penumbra (cf [13]: Figures 88 and 109), the biological effectiveness, and the degree of hypoxia or radiation resistance (cf Figure 7 and [13]: Figures 114, 115) should be considered when selecting the optimal treatment energy and modality. It is seen in Figure 25 that quite high photon or electron beam energies are generally needed for optimal results with deep-seated tumors as also seen in [13]: Figure 117a for a hypoxic tumor. According to the interaction displayed in Figure 28 the most optimal technique would be to deliver the two parallel opposed beams simultaneously or within a few seconds, or nano seconds for Super Flash effects, see Figure 27, 28 and text below Figures 24, 27! potentially resulting in a true therapeutic advantage much higher and efficient than ever with the current over popular but generally at best marginally beneficial and risk prone flash method (cf Figures 26-28c for further potential clinical improvements!).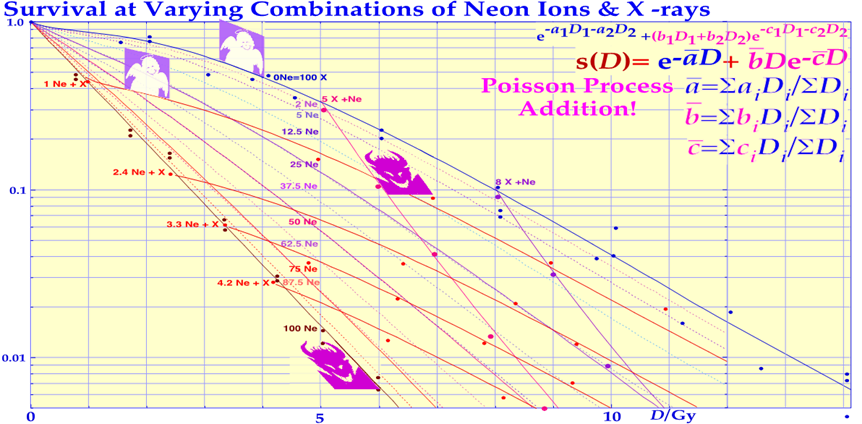
Figure 26: V 79 cell survival after varying combinations of Sequential treatments with Neon ions and X- rays, where solid lines represent RCR model [70] and dots represent original experimental data [84]. The formula included in the figure show how the dose weighted mean values of a, b, and c of the different radiations, i, combine to give the total effect [70, 89] and it is probably the very best fit to this very valuable but complex data set.
In Figure 28 all these data points are integrated almost as a single effective survival line. The soft low dose hyper sensitivity for X-rays is importantly considered in these fits, and with multiple beam simultaneous dose delivery is generally most effective and advantageous as seen in further detail in the text and Figures 27- 29abc and text below Figure 24, 27!
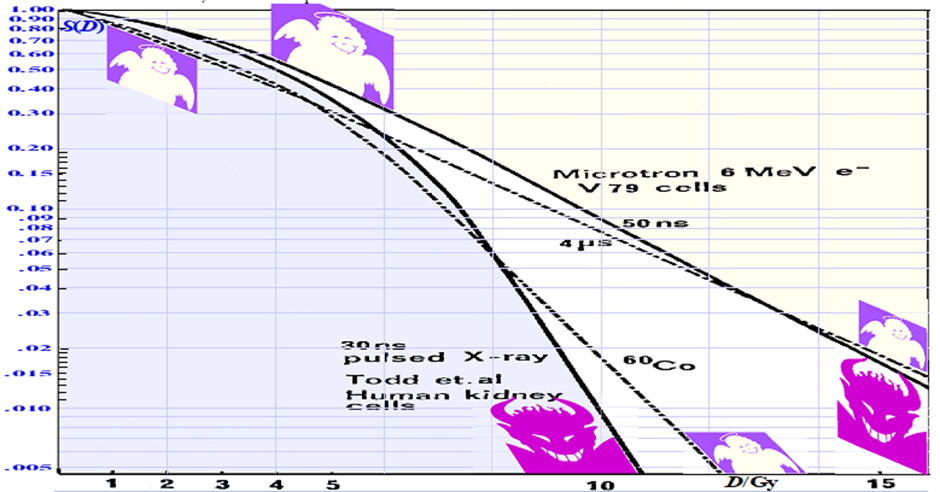
Figure 27: The survival after low and very high dose and dose rate irradiation of human and hamster tumor like cell lines (big shoulders most likely TP53 mutant cells). Interestingly, both cell lines show less low dose damage at very high dose rates when radical - radical recombination can take place during the short irradiation time (single 30-50 nsec pulse, cf also Figure 21b) as all ions are almost simultaneously present (solid lines).
Unfortunately, for Flash enthusiasts this protective effect should be rather similar for tumors and normal tissues but all normal tissues suffers much more LDA so don't cross the fractionation window at 2.3/3 Gy! At very high doses and dose-rates (nsec pulses) the high ionization density instead makes the DNA repair less effective, almost like a high LET effect, but now as a high Volume Energy Transfer (VET) as it takes place not just along the photon or electron paths but in the whole volume (cf Figure 34 right panel), and thus NHEJ misrepair is likely to increase due to the high quasi simultaneous high VET situation!
At the low dose-rate, repair can instead take place (dash dotted lines in Figure 27) during the long irradiation time making the Kus, DNApk, and TP53 recruitment happen within seconds after each new DSB site is produced [101] as is also seen in Figures 37, 38. At high dose and dose-rates there is panic in the Ku-DNApk dimer and p53 recruitments “Repair Protein Panic” (RPP, see Fig 15) and some high dose sites may have to wait too long for NHEJ to function appropriately at high VETs causing an inverse high dose rate effect [92, 13].
Depending on the TP53 mutations of these cell-lines, it may also partly be due to a shift in the Low and High dose apoptotic fractions (LDA and HDA) as seen in Figures 18, 52. As a consequence the NHEJ and HR choice may depend on increased NHEJ misrepair at high VETs and local damage densities leading to more HR activity and High Dose Apoptosis (HDA) a real case for RHR cell survival [13]: Eq (7-8) since LQ is mishandling normal tissue responses! Thus, to make a Flash like approach truly functional it is important, like in ordinary radiation therapy, to ensure a high tumor dose per fraction as seen here and Figures 18, 52, (cf also [13]: secs 5.7, 10.5-10.6) but also to avoid split dose repair by delivering all beam portals simultaneously in the tumor as can be seen in Figures 28, 29abcd indirectly promoted by Zvi Fuks at MSKCC by a single 23 Gy treatment fraction [88]! To really get a strong/Super Flash advantage it is imperative to use an effective IMRT- technique to really get the high dose effect advantage (>10 Gy) in the tumor volume (devil signs), a fact that is not generally understood or discussed in the literature but clearly explained here and by the HDA effect (cf [4,91,92])! The Flash effect can best be optimized by light ion IMRT see sec 5 and Figures 25-29d, 46.
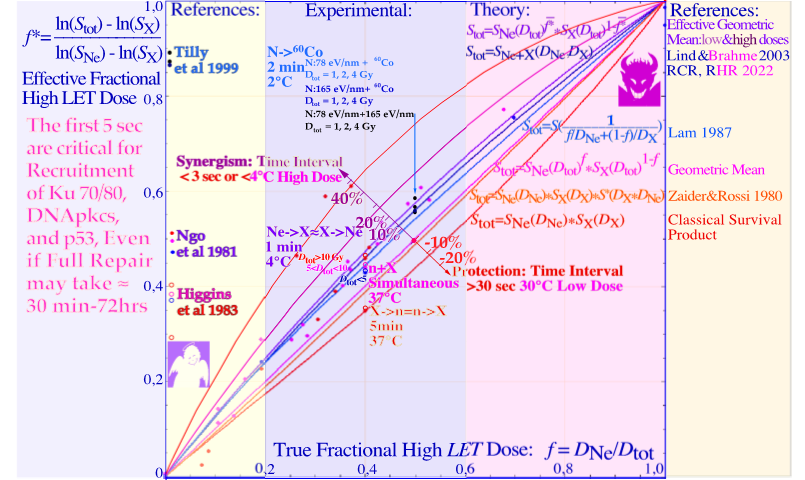
Figure 28: Comparison of different methods to calculate the biological effect when combining low- and high-LET radiations. The classical product formula is only valid with long time interval between irradiations. For simultaneous irradiation, the synergistic effect is significant and largest around f=0.5 [70]. The straight diagonal corresponds to the pure geometrical averaging. It is interesting to see that 1 min at 4° C or 2 min at 2° C and simultaneous irradiation at 37° C are almost equivalent [86, 91, 92], whereas 5 min at 37° C results in an effect which is totally independent of the sequence of irradiations and most low-LET sublethal damage is already primed by the Kus and DNApk to get fully repaired and at least without further synergism. To maximize the synergistic effect with scanned beams the scanning time should be less than a few seconds between high and low LET dose delivery (cf [95]: Figure 8.38 j)! To really benefit from it one have to compare the effect it may have on the target tissues in relation to the lower LET fractions delivered in normal tissues that may benefit by longer time intervals. Interestingly, some early clinical data indicate that a ridge filter may be more optimal unless the scanning layer by layer is ultra-fast (not yet available unfortunately!), as can be seen in the clinical data (cf [13]: lower right panel of Figure 75). Near f ≈ 0.5 the data in Figure 26 correspond to a synergistic effect of about 15 % but high dose data were ≈40%.
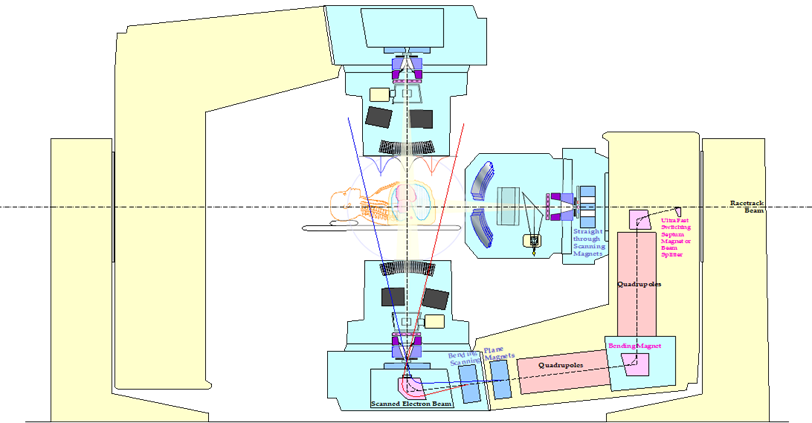
Figure 29a: 2 ordinary gantry units can be placed parallel opposed in one room capable of delivering two beams practically simultaneously by synchronization on one and the same patient for an effective segmental Flash treatment. It is even possible to do IMRT MULTI Flash++ treatments by delivering segmental multi leaf collimated treatments where each segment is synchronized between the two units so in 20-50 nsec pulses >6 Gy simultaneously is delivered also with intensity modulation between segments in the tumor and only 3 Gy in 20-50 nsec ≈2.3 Gy in one minute to normal tissues . To reach all the way to 10-12 Gy in the tumor 3 low LET beam portals are needed as shown in Figure 29c with scanning beams or 29d with Lithium ions that can reach even further with single and dual beams due to their elevated Bragg peak biological effects (cf Figures 23, 25).
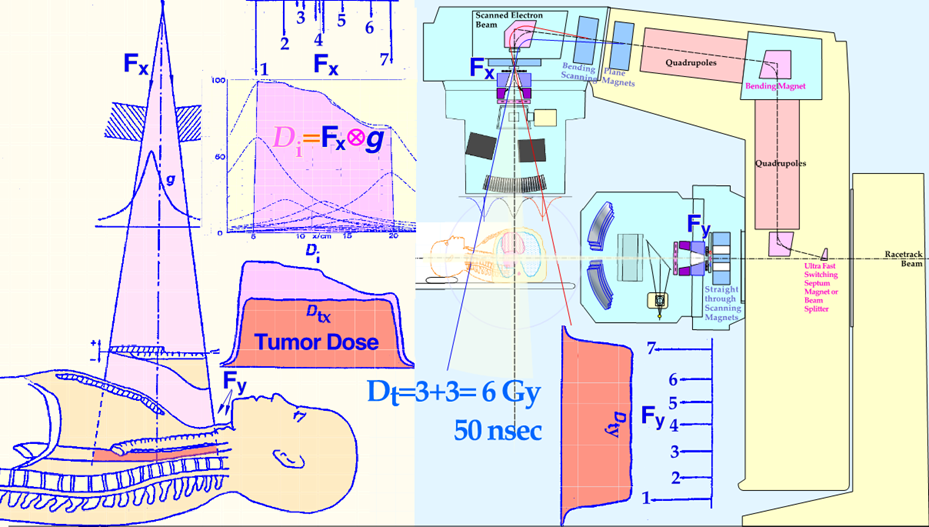
Figure 29b: The design of a gantry capable of delivering two intensity modulated beams simultaneously to get the extra advantage with synergistic therapeutic effects by negligible DNA repair between the two beam dose deliveries and simultaneous intensity modulation so that each pair of accelerator pulses always coincide in the tumor at around 6 to 8 Gy but passes alone through normal tissue at a dose of about 3 Gy and a pulse length of 30-50 nsec corresponding to 2.3 Gy at normal pulse lengths (cf Figures 19, 27, 28). In this case it was sufficient to use 7 Macro pulses of 50 nsec synchronized as given by the pulse numbers 1 to 7. The whole treatment is done in a fraction of a second with no moving parts except for the scanned pencil photon beam locations as shown by the inverse convolution equation that rapidly converges to the optimal low number of pencil beam locations [19, 22]. The tumor suffers from Repair Protein Panic (RPP) producing an inverse dose rate effect with almost 50 % higher cell kill effect then in normal tissue by the high doses ≈5 Gy whereas all normal tissues stay at 2.3 Gy equivalent dose at 50 MV photons anteriorly (Fx) and laterally (Fy) 50 MeV electrons. With the three gantry system in Figure 29b the 10-12 Gy tumor dose level can be reached with a further 50% higher tumor cell kill and still about 25 % normal tissue sparing below 3 Gy (cf Figure 27)!
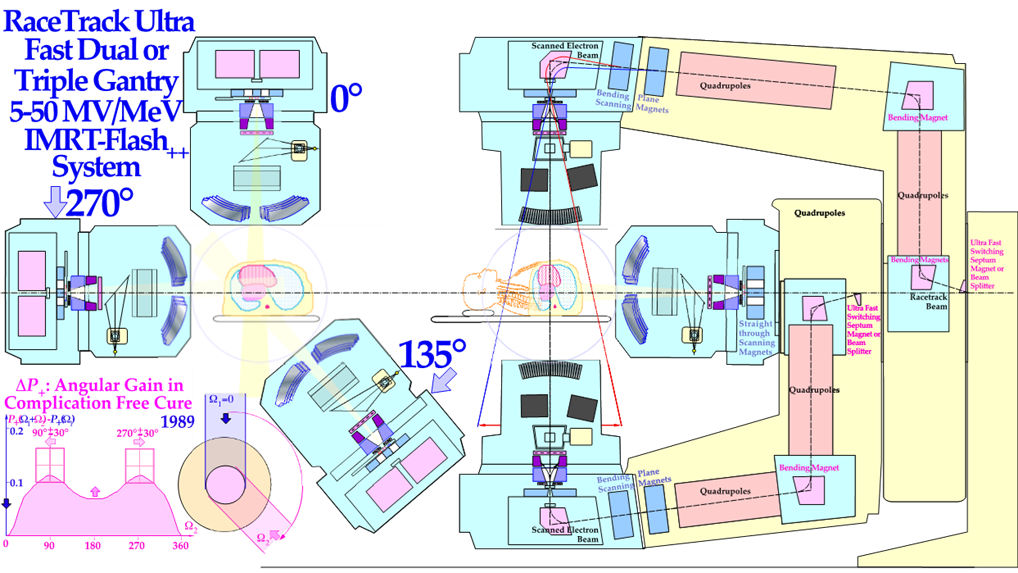
Figure 29c: It is possible to make a Triple gantry where all three beams are delivered simultaneously in the tumor, in this unit the whole treatment can be delivered in a few seconds by one fixed gantry set up! A higher modulator repetition rate or current may compensate for the beam splitting or increased switching rate delivering to multiple treatment heads and gantry arms.
A good IMRT technique will reduce the slightly increased damage to normal tissues. But a gain of 30-50 ?fect on the tumor should be possible far beyond what the much more complex and risky flash method can ever make! Interestingly, the present gantry allow the 3 beams of each accelerator pulse to coincide in the tumor at 9-12 Gy at the same time as the normal tissue only receive 2.3 GyE (cf Figure 46). The whole treatment takes a few seconds but each volume element in the tumor get ≈85 % of its dose in a single 30-50 nsec pulse. There by it is possible to intensity modulate by step vice moving the 30 or 15 mm FWHM photon or electron pencil beam (cf Figure 29b). This method would be even more advantageous with Lithium ions where the increased Bragg peak dose delivery would further improved therapeutic ratio with just two beams and 15 GyE in the tumor (cf Figure 25) and it would be ideal for pediatric patients and youngsters with good survival probabilities and minimal risk of secondary cancers (cf Figures 29d and 40).
However, IMRT-Flash++ or Super Flash instead results in much higher tumor doses resulting in an inverse dose rate effect killing more tumor cells as seen twice in Figure 27. Figure 27 also show how this effect can be maximized at high tumor doses and Figure 29a-d show how dual and multi beam gantries should be made to revolutionize the flash arena by focusing on a well optimized therapeutic inverse dose rate effects as explained in detail in the text of Figures 27 and by its devil and angel signs, and 28! Optimizing the Flash effect means trying to raise the tumor dose as high as possible using inverse biologically optimized IMRT planning to maximize the Repair Protein Panic (RPP) in the tumor as demonstrated in Figures 15 and 27 thus generating the high dose inverse dose rate effect, without crossing the optimal 2.3/3 Gy low LET fractionation barrier in normal tissues. The dual beam procedure may thus be termed IMRT-Flash++ to indicate the increased tumor dose and RPP optimization, or just Super Flash for short. This is much more important than the 25 % normal tissue effect savings making 3 GyE at 30 nsec ≈ 2.3 Gy as seen in Figures 27 and 46 for 30 nsec pulses.
Furthermore, in Figure 29c at 11 Gy the tumor survival is reduced to ≈50 % further and is likely to revolutionize radiation therapy by this new Super-Flash technique! With the electrons and especially lithium ions a much better therapeutic ratio is possible as seen in Figures 25 and 29d. For 5 cm tumors it is possible to deliver 5 times higher doses with lithium in parallel opposed configuration and it is even possible to reach 12-15 GyE with the two beam technique in Figure 29d without exciding 3 Gy low LET in normal tissues. This more than doubles the tumor kill for 30 nsec pulses which is really the optimal ion technique for patients with high survival probability and with minimal risk of getting a secondary cancer as shown in Figure 40.
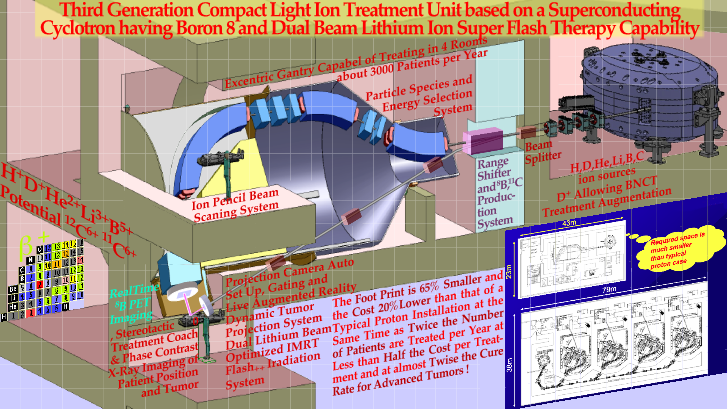
Figure 29d: The design of a compact 4 treatment room light ion installation using a single excentric-gantry for isocentric treatments in all 4 rooms with Lithium ions for optimized IMRT Flash++treatments and allowing PET-CT-PC dose delivery imaging (cf [34, 35]: Figures 28, 36-38 a-l) in real time during a 8 B ion treatment in all rooms as well.
In fact, if any tumor cold spots are detected after a treatment according to Figure 29d, e.g. due to internal organ motions it would be possible to add extra beam pulses to ensure fully completed dose delivery either right away or at the proceeding adoptive treatment fractions [19]. Interestingly, a dispersion-free accelerator and storage ring with effective electron and laser beam cooling in [13]: sec 5.1, Figures 32, 33, may truly be the most optimal beam type minimizing transversal momentum spread from the ion source. But perfectly crystalized beams may not be out of reach as discussed in detail since they does not seem to come into conflict with Heisenberg’s Uncertainty Relation but will still need an advanced physical design trying to remove Poissonian randomness often originating from thermal ion source noise! With lithium ions we can reach 15-20 GyE in a 2-5 cm tumor with close to sure cure using the IMRT-Flash++ method thanks to the inverse repair effect due to RPP (cf Figures 15, 25 and 27), without crossing the 3 GyE dose limit to normal tissues as discussed above (cf Figure 25 and the text below Figures 24 and 27 and Figures 20-29)!
As seen above Figure 25, lithium is one of the most optimal ions for radiation therapy not least using the optimized IMRT-Flash++ method proposed for the first time here making an unrepairable beating Figures on the tumor cells as their repair proteins are totally consumed beyond 8 Gy see Figure 27 at the crossing over points corresponding to some 100 DSBs and thus ≈200 DNApk molecules often existing in the cell nuclei!
When there is only one or a few single viable clonogenic cells left in the tumor during the last week of a curative treatment (cf Figures 3, 32, 37, 38, 44, 51a) it is unsuitable to try to use high LET ions to hit them. Even if they generally are our sharpest tool available to treat malignant tumors, but only if we know exactly where the clonogens are and where to aim the beam to hit the cell nuclei! In fact, if we know precisely where e.g. 2n cells are located we need just n ions as each ion can hit at least 2 cells in one shot when we know where they are! If we don't, according to Heisenberg’s wonderful thinking, applied on this simplistic case, we need a beam at least as large as the tumor if we wish to be sure to hit them all (actually a little bit bigger if there is also uncertainties in the beam patient set up [77, 98-101]) and not least we need also to consider the quantum biology of curative radiation therapy so we don't get microscopic ion beam cold spots on some of the remaining clonogens as seen in Figure 34. Figure 30a illustrate the microdosimetric uncertainty in its full detail whereas Figure 30b describe further how the range straggling of different ions influences the local mean value of the LET by affecting the range straggling of each ion (blue dots) and for example totally eliminates the RBE peak of an ordinary proton beam (solid lines).
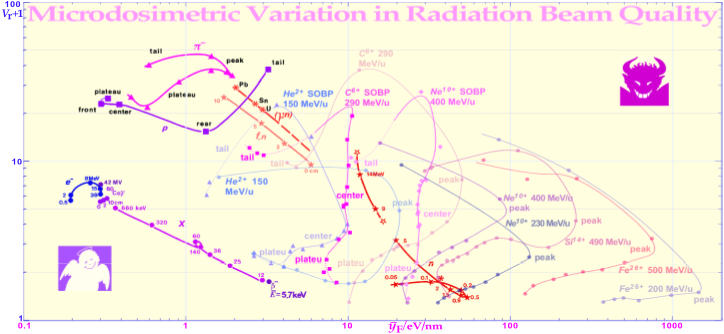
Figure 30a: The variation of the microscopic relative variance for different radiation modalities. The variance of the energy deposition (Vr + 1 = = /, where is the dose mean lineal energy value) as a function of the frequency mean lineal energy or ≈ mean LET at different locations on the depth dose curve. Interestingly, the SOBP has low variance except near the distal edge, where range straggling and very high LET Bragg peak values combine to make Vr high. For the SOBP, the frequency mean lineal energy is fairly constant for both carbon and neon ions, but the plateau in front of it and tail has only marginally lower -values. The unmodulated carbon beam has a much higher peak -value at its Bragg peak. MeV-electrons, neutrons (50 MV photonuclear, fission, and high-energy monochromatic), p-meson, proton and all SOBP ion beams have a rather high variance in energy deposition. Except for high LET ions and low energy neutrons this has the advantage that the region of lowest energy deposition is not too low (few microscopic cold spots) but instead the mean LET is rather low and so is the biological effectiveness. Interestingly, Vr is related to the (sD/)2 and thus sμ of Figures 36, 37 (cf. [77], updated with more recent He, C, Ne, Si and Fe data from NIRS).
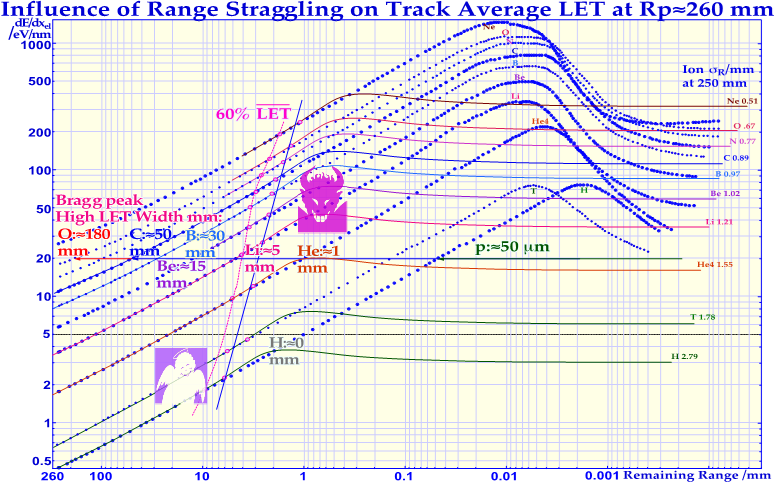
Figure 30b: Description of how the high primary ion Bragg peak LET (and RBE; here on LogLog scales) of a single low-energy proton (cf Figure 21a) over the last 50 mm is above 20 eV/nm (blue dots) but it is high RBE is completely erased by its range straggling of almost 3 mm in a high-energy beam of many particles (lowest solid line curve). The dotted curves correspond to the mean value along a single ion track, whereas the solid lines account for range straggling in a beam with many ions. The smaller range straggling and higher peak LET and wider high LET width of heavier light ions make their Bragg peaks have true high LET properties beyond helium. Interestingly, the peak mean LET is about 1 mm upstream of the practical range independent of ion, whereas the region with an LET >20 eV/nm increases rapidly with ion charge from 50 mm with protons to 50 mm with carbon ions, while the region >60% of the peak track average LET slowly decreases with ion charge. Neon and oxygen ions have a high LET (>20 eV/nm) already at the skin surface!
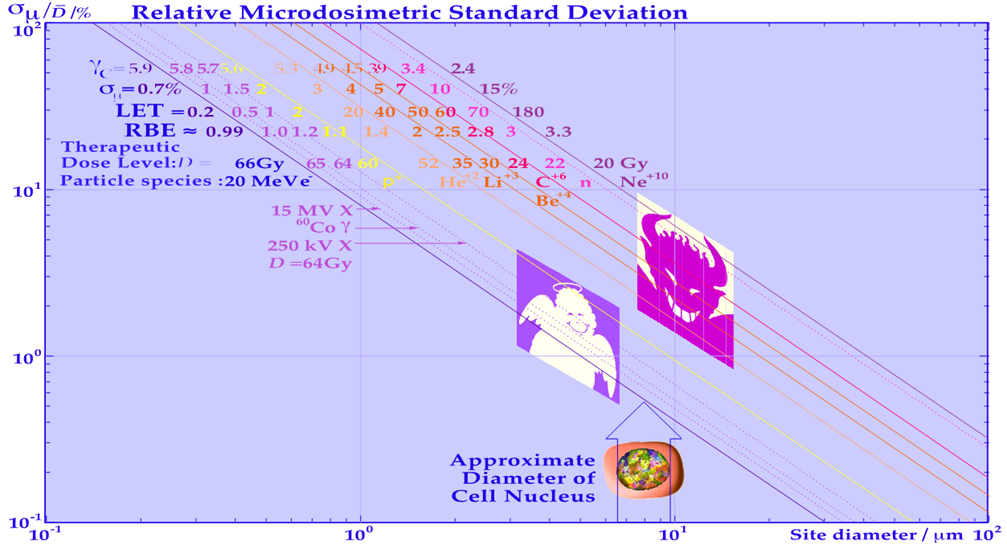
Figure 31: The increase of the relative microscopic standard deviation of the mean energy imparted, at the local absorbed dose level required for tumor cure, with decreasing object size and increasing LET or RBE of the ions starting from high energy electrons and photons through protons, helium, lithium, carbon, neutrons, and neon ions is shown.
Finally, Figure 31 gives the mean value of the microscopic relative standard deviation in different objects sizes with typical mean values for cell nuclear sizes which determine the effect on cellular responses varying from less than one percent for electrons up to about 15 % for Neon ions!
With the highest LET beams like neutrons and neon ions, the microscopic heterogeneity sμ is so high that microscopic cold spots may leave some tumor clonogens unhit at otherwise normally curative dose levels. This explains the problem with neutron therapy where the increase in dose beyond the low dose RBE to cure the tumor resulted in a severely increased level of normal tissue damage as also may be seen in high LET ion beams from ≈ Carbon and above. The resultant loss in clinical g value and RBE is shown in Figures 36 and 37 and it can be substantial!
As a consequence the Dose Response Gradient in clinical irradiations will vary between steepness γC ≈ 6 down to about 2.5 for Ne which describe the variation of the uncertainty to control the tumor as described in further detail below (cf Figures 30-38). Interestingly, the DNA seems to prefer staying in contact with the nucleosome as a kind of precaution to keep the right order of DNA fragments as seen indirectly in Figure 8 by the four major DDSBs types defined there (cf also Figure 51a and [6])! The clinical effects of Microscopic Heterogeneity and Random Poissonian misses which reduces the tumor cure at high doses by microscopic cold spots as described in important detail in Figures 8, 34, 35, 37, 38 and particularly in [6, 13]. Compared to DSBs, the much more severe Dual DSBs (DDSBs) at the periphery of nucleosomes are truly the most common multiply damaged sites (cf [37]), as seen in Figures 12-15, the lower right of Figure 18 and are much more lethal [1, 6, 10, 13, 36-41]. In fact, the mean cellular potential lethal hit number of 0.69 at 2 Gy (cf Figure 9) is most likely related to the ≈1.5 δ-electron trackends (Figures 12, 13) produced in the cell nucleus on average at that dose level and indicates that on average approximately half of them may hit nucleosomal DNA as pointed out above. Interestingly, this key effector of cell death: the δ-electron track ends, of between 0.2 and 1 keV (cf Figure 5) can deliver ≈ 0.3-1 MGy to hundred nm3 size volumes in the cell nucleus. This is mainly due to multiple Coulomb scattering [24, 50-52], multiple scatter detours [24, 51], secondary electron production and their intrinsic low to medium LET (≈10-25 eV/nm [31]) but their effective LET reaches ≈50 eV/nm and more as shown to the upper right corner in Figures 7 and 10 (cf also [13]: Figures 18)
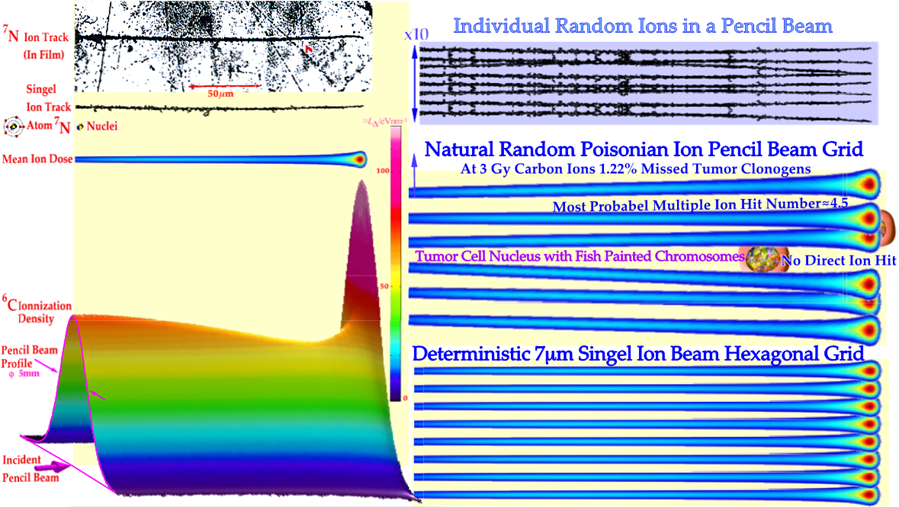
Figure 32: The left panels shows single ion tracks (7 N) and pencil beam dose and ionization density distributions (6 C) whereas to the right all normally available Poissonian random beams are illustrated in detail sometimes with multiple hits but also by totally missed cell nuclei (cf Figure 35, 36). The Bragg peak is not seen on an individual ion track in film but shows up by the much elevated dose and biological effect as seen to the left.
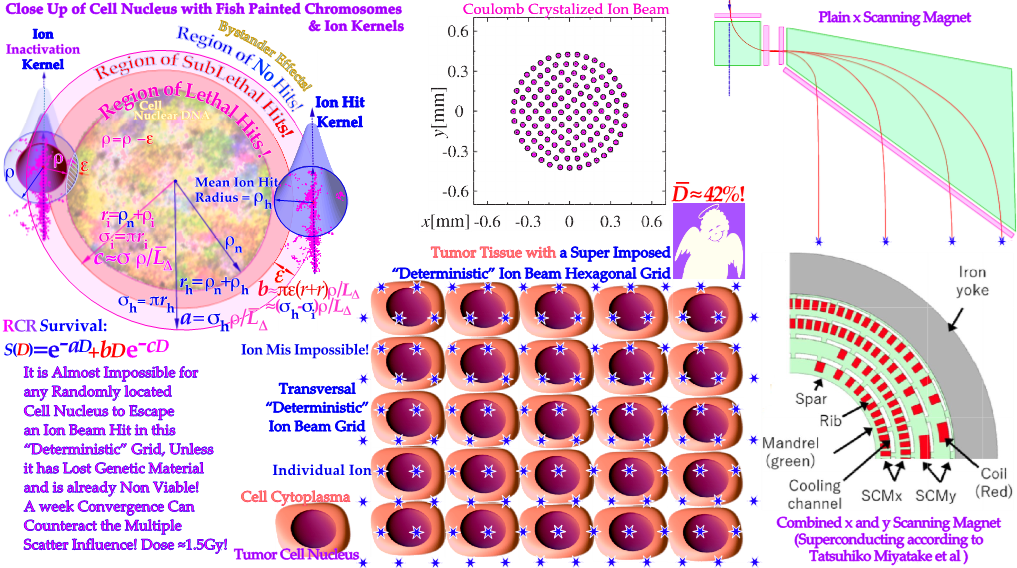
Figure 33: The Energy Deposition of a truly “deterministic ion beam” (blue stars, lower middle panel, compare also Figure 32) is transversally microscopically quantum uniform eliminating the therapeutic cure problem due to microscopic cold spots as seen in Figures 32, 37 and 38. Above, an almost perfectly Coulomb crystalized circular beam consisting of 130 ion locations over the circular beam cross section in a storage ring [102].The left close up show the regions of lethal and sublethal hits around the DNA of a cell nuclei (cf Figure 31, [12]). The right panel show a simplistic parallel beam and an x-y scanning system potentially capable of producing such beams [13, 103].
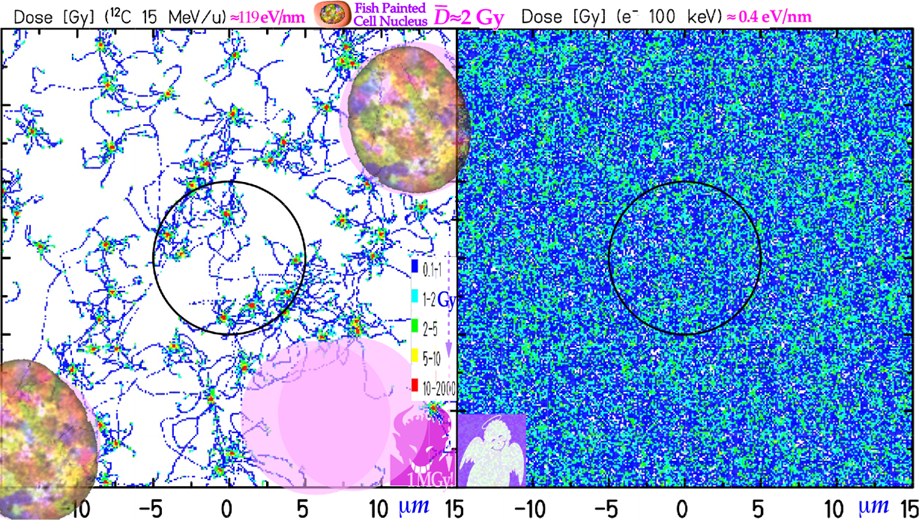
Figure 34: The Energy Deposition in a 30μm square peace of tissue at 2 Gy mean dose showing pink random regions where a potential cell nucleus (2 of which fish painted) may have been missed by direct carbon ion hits see also Figure 6 and 8 (Modified from [104]). This risk is minimal for electron and photon beams even if 6 Gy may be needed for similar biological effects at high cell densities. It is also clear that at a resolution where a MGy dose ends up as a 10-2000 Gy red voxel may not be sufficiently accurate to calculate the potential biological effects not least since there are also MGy doses to the right, most likely at≈17 spots (cf Figures 12-15 and [13]: Figure 56), but they show up almost invisible as 5-10 Gy yellow spots due to too much averaging as can be inferred from the d -electron kernel in Figures 4-7, 12, [13]: Figures 23- 25, 77, 94, 95. This Poissonian Randomness is a severe problem when aiming for high cure probabilities with light ion therapy as seen to the left and in Figures 8-13, 32-36 and discussed in much further detail in [13]. Unfortunately, it has been seen as a clinical problem, erroneously leading to a tendency to develop even heavier ions which are sure to aggravate the problem even further as shown in Figure 22 and already seen clinically with Ne ions [13]: Figures 90, 95, 98! For accurate biological analyses 10 nm and MGy resolution is needed as seen in Figures 7, 12, 13, 15 and indirectly in Figures 2-5. Interestingly, at 2 Gy the most probable hit number is 3.5 and about 20 % of the cell nuclei have that, about 2 % are totally missed, 10% have one hit 5% have 5 hits and 1% have as many as 9 hits as seen in Figure 35.
However, at the beginning of a treatment with millions of hypoxic radiation resistant tumor cells, ion beams are the most effective treatment since independent of where we aim the ions, we will hit thousands of tumor cells. If you have an ion path through millions of cells its effect on the tissue is well described by the dose average pencil beam kernel as it is the average response that counts, and it is given by taking the average effect on the millions of cells which is exactly the definition of the mean dose distribution of the beam over cell nuclear sizes! If there is only a few clonogens left such a mean energy deposition kernel is too crude, and we have to look at the probability that at least one of the remaining clonogens is missed by the beam and may repopulate the tumor! And today we know very well that this may happen since caspase 3 is likely to step in after the treatment trying to recover normal tissue homeostasis by accelerated repopulation, which is known to also affect potentially surviving tumor clonogens [62].
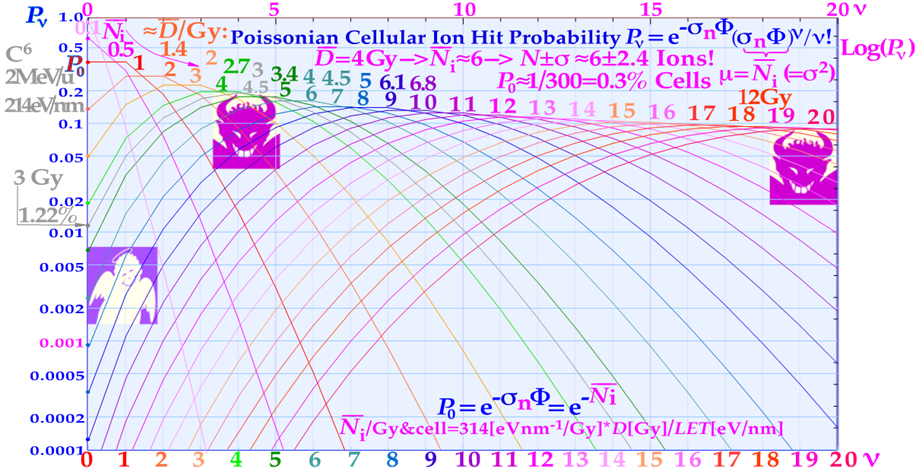
Figure 35: The intrinsic microdosimetric heterogeneity can also be expressed by the Poissonian probability of having a lethal cellular hit. When the probability for no hits, P0, is increased at low doses and high LET ́s the probability of random tumor clonogen survival is getting higher! At 3 Gy carbon ions, the probability of no hit is more than 1%. Phi =Ion Fluence; sn =Cross-section of nucleus; N=Number of nuclear hits per cell.
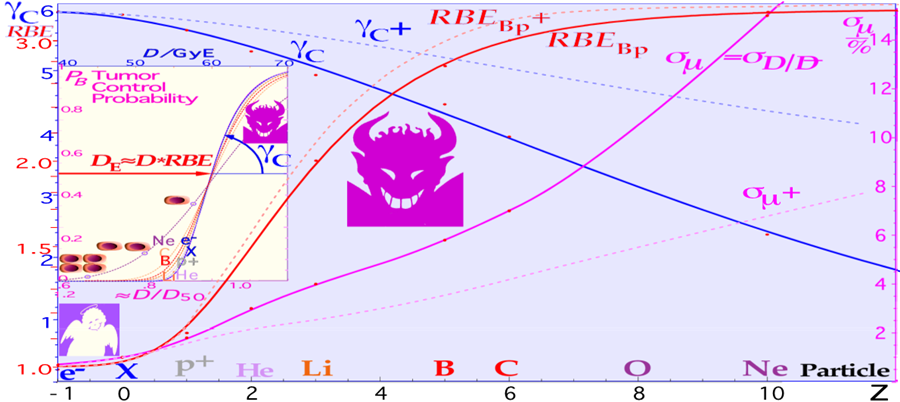
Figure 36: The γC of the slope clinical dose–response relation decreases substantially with the nuclear charge and atomic number of the ion beam. This is largely due to the increasing relative microscopic standard deviation s& of the mean energy imparted, at the local absorbed dose level of about 10 GyE required for the tumor cure to increase from a few % to a desired cure probability of ≈90-95 %. Because the absorbed dose is reduced by the increasing high dose RBE and LET with the increasing nuclear charge so the dose is only ≈3 Gy with carbon ions. This is insufficient for cure due to the high microscopic standard deviation sμ so a clinical compromise have to be found between an increased dose with better cure and a reduced dose and less normal tissue damage (cf [13]: sec 5.1). This clinical dilemma can be solved by a Low LET roundup (cf 37-38 [13]: Figure 79) and/or by the lightest ions as seen in Figure 21a, a future possibility can be obtained by the deterministic laterally microscopic uniform ion beams as seen in Figures 32, 33 and the present estimated dashed lines.
Interestingly, if we instead had truly deterministic ion beams as shown in Figures 32, 33 where all ions was exactly known to travel perfectly parallel to each other and in a precise hexagonal grid with a separation of for example 7μm and all tumor cell nuclei were perfectly spherical with a diameter of >8.1μm all would be hit as the escape radius is 7/√3 ≈4.04. In fact, with such a deterministic beam the mean hit number would be 1.89 but no missed cells (!) instead of 4.5 at 3 Gy carbon ions with 1.2 % of missed cells, but astonishingly the microscopically quasi uniform dose is less than 1.3 Gy (≈42% of the Poissonian beams we are used to)!!!
This means that if we could produce such a beam we could improve tumor cure and reduce normal tissue damage substantially. Obviously, this could be done by microfabrication of extreme pinhole collimators but unfortunately a major part of the ion beam will be stopped in the collimator and produce a number of decay components lighter ions and neutrons that will be harmful to the patient, even if there exist a well- optimized techniques developed for electrons that can be easily modified for ions! Excellent result will certainly be possible using advanced microscopic μm size pencil beam scanning techniques that have already been developed for micro irradiation of subcellular components in the laboratories [13] but also for electron microscopy. However, they need to be very fast in scanning to avoid extreme treatment times a 10 by 10 cm2 field will have (100000/7)2 beam spots or 200 Million spots so a rate of 1000x1000 have to be done in a second for a 3 min treatment time but we most likely will need 10-20 beam energies so it will not be easy! Multi grid ion beam sources may be a way to increase efficiency but will require good beam optics all the way to the patient. It is definitely not a simple task but really wort thinking about! A further problem may arise if we had such a beam, as multiple scatter in the patient may allow clonogen misses eg behind bony structures. An interesting possibility would be to produce the ion beam in a dispersion-free accelerator and/or storage ring with effective electron and laser beam cooling to generate perfectly Coulomb “crystalized” ion beams (cf [13]: Figure 70 and [102]). Such an almost perfect circular beam may consist of 130 stable ion locations over the perfectly circular beam cross section but the crystallization may get disturbed during extraction. The already proposed low LET roundup method see Figures 6-8, 18, 37, 38 [10, 13] is definitely more straight forward and will surely produce steepest possible dose responses, whereas deterministic light ion beams will improve responses but the longitudinal microscopic variance will still remain but it is most likely a minor problem. Therefore, like in quantum mechanics it is generally not possible to state the exact state of the patient after a treatment whether he is cured and alive and well or not, we can only state the probability range to expect based, e.g., on the Extreme Value Distribution [13].
This situation could also be compared with the famous enigma of “Schrödinger’s cat” but also to Heisenberg’s Uncertainty Principle applied to ion-beam radiation therapy as just discussed above [13]. In fact, radiation therapy is truly the perfect example of the extreme value distribution, as it is well known that only the last few and most likely the most radiation-resistant tumor clonogens that have survived the initial major part of the treatment (≈60 GyE/70 GyE ≈ 85%) without being killed. Instead, they remain to finally form the tumor control probability curve, as recently described in great detail (cf Figures 37, 38 [15]: Figure 8.10b, [25]). It is therefore not surprising that the tumor control probability can be rewritten to perfectly follow the cumulative extreme value distribution [11, 13]:


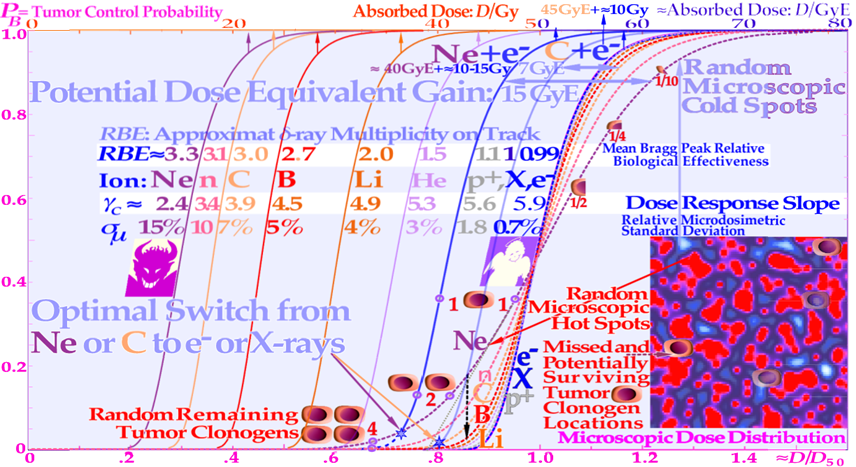
Figure 37: The tumor control probability curve for a uniform cell line using different radiation modalities as a function of the absorbed dose (upper scale). The last few radiation treatment fractions will determine the outcome of the treatment, and they are not at all deterministic as they depends on random hits The lower scale and dashed line curves are normalized to the ≈50% tumor control probability dose that is approximately proportional to the dose equivalent, to more clearly show the effect of the microdosimetric relative standard deviation sμ on the γC dose response slope with increasing the LET and RBE (cf digital values in the table). Not only are the hot spots often in the form of dual double-strand breaks (DDSBs, cf Figures 4, 5, 7, 12,13)
Whereas cold regions become more extreme with increasing LET, but the RBE first increases, thus reducing the total dose by approximately threefold with carbon, neutrons, and neon ions. Simultaneously, increasing the relative standard deviation, and reducing the γC value more than therapeutically desirable as the local dose varies from close to zero to the high LET dose on the ion cores (≈ MGy). For a real low-LET roundup treatment such as the schematic neon ions + electrons, an extra upper Gy-Equivalent scale is needed. Thus we get a substantial dose equivalent gain of ≈15 GyE with neon ions, and about half that gain for carbon ions + electrons and about 10 GyE with neutrons + electrons well worth a randomized clinical trial or a well-tolerated dose escalation. So even if the ion beam induction of Repair Protein Panic (cf Figures 15, 27) is useful the microscopic heterogeneity will dominate at high doses to reduce the cure! Lower LET ions or photons and electrons the last week of therapy is a must! For a common tumor size of N0 =107 clonogens the relative standard deviation Whereas cold regions become more extreme with increasing LET, but the RBE first increases, thus reducing the total dose by approximately threefold with carbon, neutrons, and neon ions. Simultaneously, increasing the relative standard deviation, and reducing the γC value more than therapeutically desirable as the local dose varies from close to zero to the high LET dose on the ion cores (≈ MGy). For a real low-LET roundup treatment such as the schematic neon ions + electrons, an extra upper Gy-Equivalent scale is needed. Thus we get a substantial dose equivalent gain of ≈15 GyE with neon ions, and about half that gain for carbon ions + electrons and about 10 GyE with neutrons + electrons well worth a randomized clinical trial or a well-tolerated dose escalation. So even if the ion beam induction of Repair Protein Panic (cf Figures 15, 27) is useful the microscopic heterogeneity will dominate at high doses to reduce the cure! Lower LET ions or photons and electrons the last week of therapy is a must! For a common tumor size of N0 =107 clonogens the relative standard deviation σD / Dˉ≈0.0768 so only about 7.7%, making the tumor control curve shape quite steep and very sensitive to microscopic dose fluctuations.
This is partly due to its high Kurtosis=5.4 independent of μ and n as well as N₀ and D₀ and so is the Skewness≈1.1395 explaining the steeper rice of the tumor control curve at low doses and the shallower extended shoulder at high doses. This fact is making it generally very hard to achieve 100% perfect tumor cure as is well-known clinically. The commonly used Gaussian distribution by necessity is linked to zero Skewness and a Kurtosis of 3.0 so it is really unsuitable to describe clinical dose response relations! Here for simplicity we assume perfectly uniform dose delivered to all cells with a fixed radiation resistance D0. This later assumption is not really applicable to ion beams with substantial microdosimetric variance sμ as shown in Figures 30-36 [6, 7, 10, 71]. It is clearly seen that this has a detrimental effect on the clinically observed steepness γC of the dose response relations as also shown in Figures 36, 37 with the consequence that both the high dose tumor cure is reduced and the lower dose normal tissue damage is increased (cf Figure 38). Taken together this results in a severe reduction in the complication free cure and the width of the shrinking therapeutic widow as clearly visible in Figure 38!
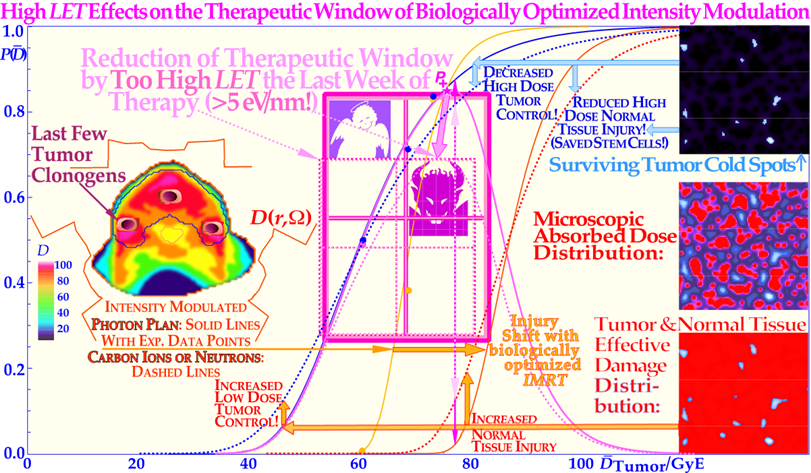
Figure 38: A too-high LET have adverse effects both on the complication-free cure (P+) as it reduces the high dose tumor cure and simultaneously increase lower dose normal tissue injury (dashed lines; solid lines from: [99, 103]: Figures 1, 2, [106, 107]). Interestingly, there is a very cost-efficient clinical solution to this problem: by switching to electrons, photons, and in special cases even protons during the last week of treatment. This will lead to a steeper tumor response as seen in Figure 37 ([1]: Figures 20, 22, [13]: Figures 74, 79, 106 and 112, [31]: Figures 8.10 a, b, [101, 105]), generating a higher complication-free cure, all at a lower delivered dose equivalent (see Figure 37 Ne+e− and C+e−) and reduced risk of damaging normal tissues, as seen here. P(): is the probability of tumor control or normal tissue damage as a function of the mean tumor dose.
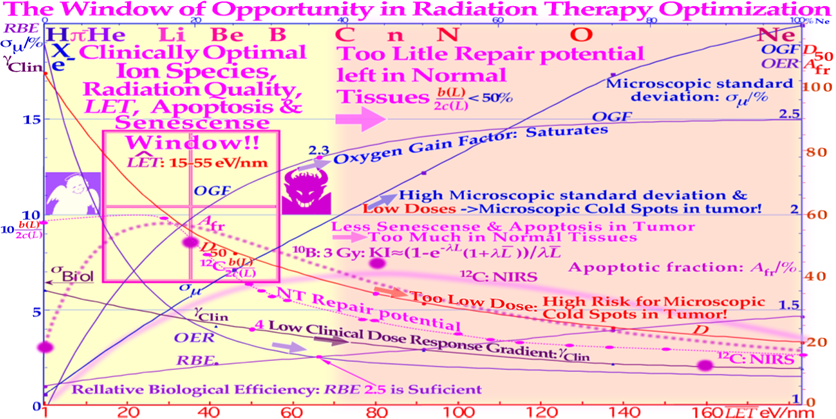
Figure 39: The LET variation of key biological parameters that influence the clinical value of radiation beams showing that the optimal window of opportunity in radiation therapy optimization is located between about 15 and 55 eV/nm or He-B ions. The underlying data are collected from Berkeley, NIRS and Karolinska. Interestingly, many of the above quantities can be biologically optimized by the methods discussed in [13]: Table 2 to ensure maximum complication free cure in the treatment! The rather low final dose increments in a high-LET and high-microscopic heterogeneity treatment will inevitably generate microscopic cold spots where some of the few remaining tumor clonogens may survive!
It is even extremely unlikely that the many heterogenic hot spots fall on all of the remaining tumor clonogens. After such a noncurative treatment with caspase-3 induced apoptosis, an accelerated repopulation of normal tissues, as well as of possibly remaining clonogenic tumor cells, may be induced [62]. The risk for severe normal tissue damage is much lower with an electron or photon beam treatment “round up” and a high LET can be fatal with the last few ion fractions where the tumor control truly should increase from a few % to preferably ≈ 95 % with practically no remaining tumor cells. This is not even possible with high LET ions without damaging normal tissues as seen in Figure 38! Unfortunately, it seems many treatments are done today with light ions without a real clinical research approach looking carefully at the resultant steepness of the cure probabilities of the treatment, unfortunately a grave mistake of advanced ion therapy! Interestingly, Figure 37 indicates that a higher LET for the first part of the treatment like Ne ions or neutrons may be a more advantageous way to minimize the total dose delivered assuming negligible problems with high LET doses to organs at risk and an earlier switch to a low LET round up! It should be pointed out that trying heavy ions from carbon and up are unsuitable to achieve a high cure probability with the last hand full of randomly distributed tumor clonogens that all need to be eradicated to bring the probability of cure from ≈1% to 95% as seen in Figures 29d-38.
This is a surprising observation after significant clinical use of Ne ions and neutrons without low LET roundup an addition that might significantly improve these otherwise rather marginally tolerated treatments in normal tissues (cf also Figure 51a and [10]: Figure 10 for optimal handling of the setup margins)! The beam quality question will therefore be discuss in terms of the optimal particle species and mean LET, as shown in Figure 39 for the LET range from 0.2–180 eV/nm covering X-rays-Ne ions as recently discussed [14, 23]. In this region the RBE increases steadily from 1 to approximately 4.5, the oxygen enhancement ratio (OER) decreases from approximately 3 to almost 1, the normal tissue repair potential b/2c decreases from about 1 to 1⁄4, the normalized clinical dose response gradient, g C , decreases from approximately 6 to 2 (cf Figure 74 and 36), the microscopic standard deviation in dose sμ increases from 1% to approximately 20%, the 50% tumor control dose, D50 decreases from almost 100 to 20 Gy for radiation-resistant tumors, the apoptotic fraction, Afr varies from almost 60 down to ≈3% and the oxygen gain factor (OGF) increases from 0 to 2.5. Importantly, above approximately 55 eV/nm, many of these factors become less advantageous for clinical use: the loss of sublethal DNA repair in normal tissues (see Figure 45 with inserts), the saturation of the OER and the OGF, and the reduced senescence and apoptosis in the tumor as seen in Figure 39.
The increase in microscopic standard deviation (sμ) will decrease the clinical g C value (cf Figure 36) and microscopic cold spots may appear as the standard deviation in dose delivery becomes more significant, as the therapeutic dose reaches ≈35 Gy and lower [6]. Consequentially, the senescence and apoptosis in the tumor decrease while it increases too much in normal tissues! Therefore, boron ions are more optimal than carbon ions (cf Figure 23), at least for medium-size tumors, and lithium ions are the optimal particle for pediatric tumors, and their combination is ideal both for dose and radiation therapy biological effect optimization (Figures 23, 24, 39). What truly requires new thinking is the 4-dimensional aspects discussed in section 9, and time dose fractionation in section 7, the internal target volume and the quantum biology effects the last weeks of the treatment in section 6, and they are very important to consider (cf. Figure 52; counting also dose, energy and lineal energy is actually already 7 dimensions). The new idea to more seriously consider the microdosimetric heterogeneity of the beams (cf. Figures 31-38) and to take it into account, especially the last week and a half of the treatment [6], is an interesting opportunity to at the same time recover the steep dose response relations, e.g., of well oxygenated head and neck cancers for photons (γC ≈5-6 [34, 108]). Interestingly, this can be achieved by switching the last week of an ion treatment to a low LET roundup with minimal microscopic dose delivery heterogeneity, and thus at a time when the most severe hypoxia is gone. Thus, replacing the last one or two ion treatment fractions by 10-15 Gy preferably using electrons or photons but also protons will do, e.g., at an ion center, as discussed in further detail in sec 6 and Figure 52 as well as in Figures 25, 39. Figure 40 also shows that the maximal risk is the smallest for low-LET ions (blue-shaded, 40 eV/nm), largely due to their high apoptotic fraction. The real secondary cancer risk may be on the order of 5% of the maximal values in Figure 40 or less. Obviously, these experimental data are not truly relevant for all surrounding normal tissues that may receive a fair dose and are at risk for a secondary cancer. However, the present tumor cell line is at least wt TP53 so probably not the most extremely mutated one and can, in a first approximation, be assumed to be representative both for normal and tumor tissue at risk. Furthermore, the dose axis is clearly the dose per fraction, so it means that the total dose is increased by the number of fractions used. Interestingly, the plot is drawn as a function of dose equivalent (Dose x RBE; the 50% survival RBEs used are given in the figure), so all the maximal doses align very well, indicating that the ion with the lowest LET and highest apoptosis will generally minimize the secondary cancer risk for a given delivered dose equivalent. In fact, just as nature arranged it with the LDA to avoid cancer before full repair is induced (cf Figure 18) but this time HDA is also involved [1]. Notably, this secondary cancer risk is a contraindication for large, low-dose volumes with many beam portals in intensity-modulated photon therapy using methods such as “rapid arc”, “volumetric arc”, and “tomotherapy” on nonseniors, which may have time to develop secondary cancer 15-20 years after the treatment [77, 107, 109, 111].
Interestingly, the new fractionation procedure proposed below (sec 7) and the new treatment approach suggested in Figures 32, 33 will allow fewer beam portals and higher tumor doses with fewer adverse reactions in normal tissues using ordinary fixed beam delivery. In fact, if minimal risk for secondary cancer is also a goal of the treatment, multiportal molecular radiation therapy with lithium ions (cf Figure 18) with half to one GyE plateau dose/portal would be ideal, as seen in Figures 22, 23. With the lightest ions, this is generally a smaller problem, as fewer beam portals are needed, and it should thus be the treatment of choice for nonseniors that hopefully will recover from a well optimized local treatment with minimal risk of late morbidity! Interestingly, the unique property of the new DNA repair-based formulation to estimate apoptosis makes it possible to better estimate the probability of inducing a secondary cancer as shown in Figure 40, especially with experimental cell survival and apoptosis data already shown in Figure 20 (cf [1]: Figures 7, 9 and Eq(10)). It is unlikely that the apoptotic fraction will contribute to secondary cancer induction (except possibly in TP53 mutant cell lines that may integrate DNA fragments from apoptotic bodies into their genomes!), so it is useful that this fraction can be estimated using the new RHR formula and be removed from other forms of misrepair to more accurately describe the cells that are potentially capable of generating a secondary cancer. This cell fraction, as shown in Figure 40, has its secondary cancer induction peak in the 3 GyE/Fr region, so in radiation therapy optimization, it is truly desirable to minimize this volume in normal tissues as much as possible. Interestingly, the 2 Gy/Fr fractionation window is a first step in this direction !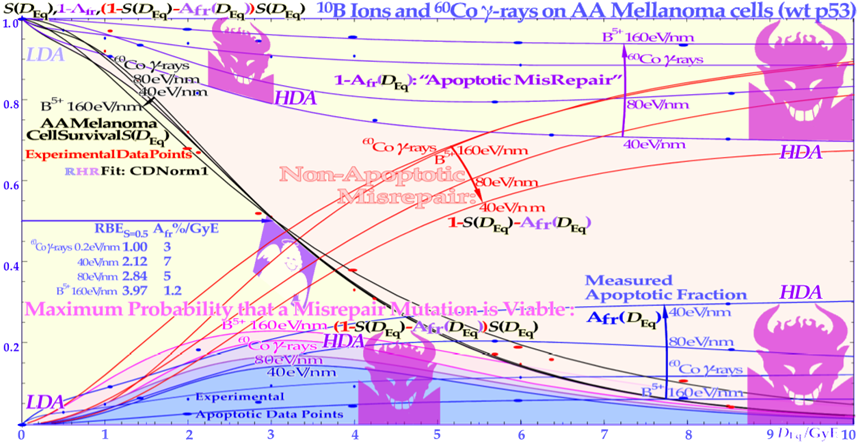
Figure 40: The lower blue shaded bel-shaped regions show the maximal secondary cancer induction probability as a function of the LET and dose equivalent per fraction delivered to tissue. At low doses, the risk of inducing a mutation is small, whereas at high doses, the probability of generating a mutation is higher, but so is the probability of also eliminating it via the treatment. The risk is highest around ≈3 GyE/Fr, so this volume in the patients normal tissues should truly be minimized as partly done using a low 1.8 Gy dose per fraction. The LDA and LDHS of this TP53 intact tumor cell line are clear from the nonapoptotic- and survival- curve shapes for the two lowest LET beams (60Co and 40 eV/nm) as they are practically coinciding at low dose equivalents (black and violet curves cf Figure 20). Interestingly, the risk is the smallest for the lowest-LET boron ions due to their high LDA and HDA. The middle shaded area is due to nonapoptotic misrepair for 40 eV/nm 10B ions as also shown by the red nonapoptotic misrepair curves for all beams. All data points are experimental (cf Figure 20) and the RHR formula is used with the CDN1: one-dimensional closest distance norm, for the fit to data (not least square; for details: [1, 13]). This is a linear plot based on the logarithmic data in Figure 20. / ≈0.0768 so only about 7.7%, making the tumor control curve shape quite steep and very sensitive to microscopic dose fluctuations.
Interestingly, during the 125 years of curative radiation therapy we have already found out how to fractionate radiation treatments to maximize curability using the well-established 2 Gy/Fr dose regiment. This largely happened by trial and error, even if the molecular mechanisms may not have been fully understood until recently. According to Fig 18 this is to a significant part due to the LDA of most normal tissues and it is essential to increase the use of it in cancer treatments to maximize the normal tissue apoptotic tolerance as seen in Figure 41! Normally, the 2 Gy dose is prescribed to the tumor and more specifically the internal target volume as the fractionation widow was mainly established in the era of parallel-opposed beams. However, the recognition that most normal tissues are low dose hypersensitive and most tumors not, the fractionation window between about 1.8-2.3 Gy as can be seen in Figures 41 and, 42 makes it important to reconsider the 2 Gy/Fr prescription more precisely as it is highest dose tolerated by normal tissues (for details cf [1, 10, 101, 105]).
Furthermore, it is important to point out that the existence of a ≈ 2 Gy/Fr established optimal treatment regimen identified some 80 years ago, or expressed differently the existence of “fractionation window” where radiation therapy works well, is in fact the most significant clinical proof for the general existence of low dose hyper sensitivity in most normal tissues. Not least since it was established in the era of parallel- opposed beams, with almost equal doses to the tumor and organs at risk.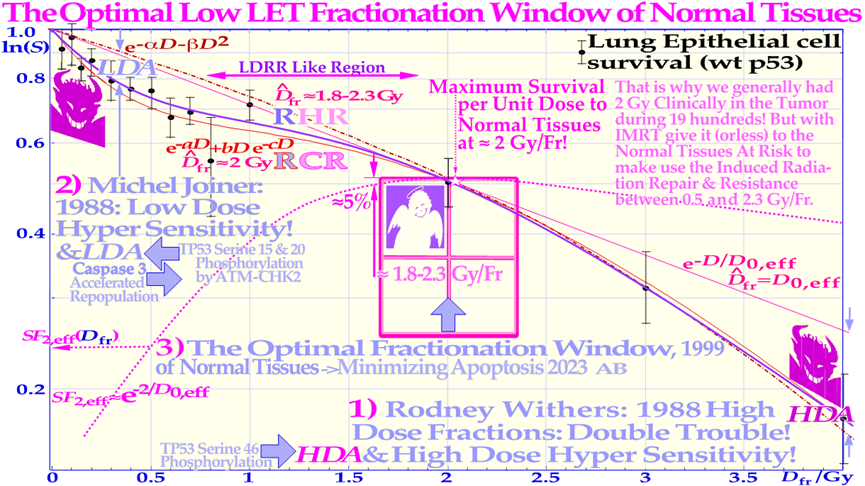
Figure 41: First the high dose per fraction problem was observed 1) now understood as high dose apoptosis, HDA. The fast low-dose initiation of full DNA repair similarly causes low-dose hyper sensitivity (LDHS) and apoptosis, LDA 2), but it is followed by almost a plateau of effective repair and significantly improved cell survival per unit dose 3). In normal tissues at risk, there is therefore generally a daily fractionation window 3).
The daily fractionation window 3) located at ≈ 2 Gy/Fr (≈1.8–2.3 Gy cf [13]: Figures 50 and 81), where the least detrimental response is obtained (SF2 ≈ 0.52 and D₀,eff ≈ 3.1 Gy) for a given therapeutic dose level having to be delivered to the surrounding tumor volume (cf [13]: Figures 49, 50). The magenta dotted curve in Figure 41 shows how the effective surviving fraction at 2 Gy (SF2,eff) varies with the dose per fraction on the horizontal axis, having a clear maximum near 2 Gy. Interestingly, this is also the region where negligible apoptosis is induced in normal tissues. These are probably the main reasons why in classical radiation therapy, where the tumor and normal tissue absorbed doses were often rather similar due to the common use of parallel opposed beams, and the dose delivery was best tolerated ≈ 2 Gy per fraction. Figure 41 is Modified from [1, 11, 13, 59, 101].
In addition, the molecular mechanisms seen in Fig 18 explain how the fractionation window works in finer molecular details as seen by the new radiation biology in Figures 18-23. Moreover, the ≈2 Gy/Fr tangent to the survival curve from the origin (pink line in Figure 41 and the window in Figure 42) makes the shallowest and least damaging irradiation effect tonormal tissues when having to deliver high doses to deep sited tumors. In fact, now in the era of IMRT and QMRT and understanding the molecular fractionation mechanisms, it is suboptimal to continue delivering the 2 Gy/Fr to the tumor as discussed above but also already 25 years ago [101, 105]. It is much better to use the 2 Gy/Fr as the fractionation window of normal tissues and the new IMRT-flexibility in dose delivery to boost the tumor dose per fraction as seen in Figures 19, 20, 41, 46. Interestingly, this optimal daily fractionation window at approximately 1.8–2.3 Gy/fraction minimizes normal tissue apoptosis and the effect of the LDHS and LDA and is defined where the shallowest tangent from the origin touches the cell survival curve at approximately 2 Gy (Figure 41 cf. also Figures 12, 13 and 19 [13]). Using such a dose per treatment fraction in the normal tissues around the tumor also means that the tumor dose using IMRT is significantly higher, by a factor >1.5, and the tumor will suffer significantly more damage, especially with a mutated TP53 and DNA repair genes [13]. 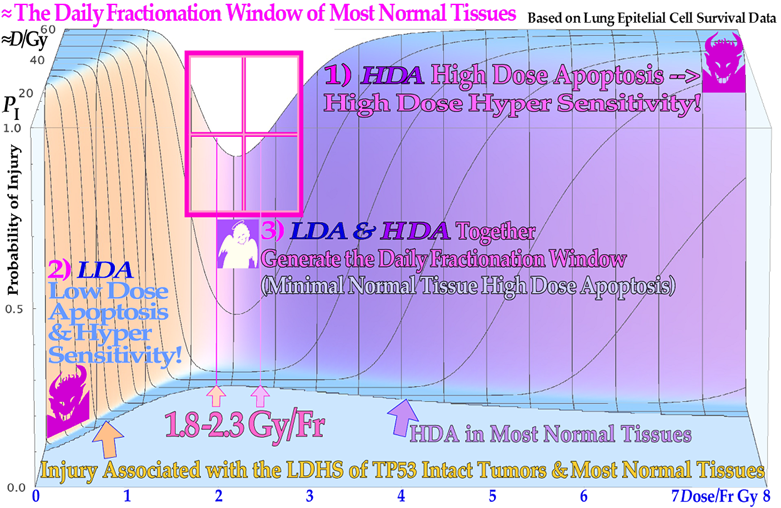
Figure 42: The effect of varying the doses per fraction has on normal tissue damage is illustrated based on the experimental survival data e.g. in Figures 9, 18, 19, 22, 45 for lung epithelial cells. The low dose hypersensitivity of most normal tissues establishes a therapeutic fractionation window of opportunity to cure cancer with minimal normal tissue damage and apoptosis. The new cell survival models discussed her has fine-tuned the dose range to 1.8-2.3 Gy as shown here for the lung, a common organ at risk in the thorax region.
In addition to this classical daily fractionation window around 2 Gy/Fr [13], there is further advantage giving higher doses per fraction on days where there is a longer time for sublethal damage repair (cf Figure 44) before or after the next treatment. In fact, it is largely possible to compensate for the two missing dose fractions over the weekend and thereby better maximize HR (and NHEJ) repair.
It is also interesting to note that both the classical Double Trouble phenomenon coined by Rodney Withers for high dose sensitivity and the Low Dose Hyper Sensitivity found by Michel Joiner are linked to normal tissue Apoptosis, HDA and LDA respectively as shown in Figures 42 and 43! In the intervening interwall there is practically no apoptosis as indicated by the angel like figure in these figures and is ideally suitable for radiation therapy as pointed out some 25 years ago [101, 105]. For the lightest ions with largely a low LET in normal tissues, such as lithium to boron ions, the normal tissue dose should preferably also be in this range unless there is a substantial high LET dose spillover to critical normal tissues surrounding the tumor region. With well-optimized IMRT dose delivery, the tumor dose could simultaneously be >1.5-2 or more times higher, and in addition, the biological effectiveness is significantly increased (cf Figures 19, 39, 47). This makes the total increase in therapeutic effect in the tumor approximately two to three times higher and more, especially for the smaller tumors. The optimal weekly fractionation window is illustrated in full detail in Figure 44, showing that simply by increasing the dose on Friday and utilizing the weekend for repair (cf Figures 43 and 44 insert), a gain in complication-free cure (P+) of approximately 6?n be achieved. Due to the effective weekend repair, the dose fraction on Monday could also be increased to gain a further 3% in P+. A total gain in P+ of approximately 12% is possible by giving high doses Monday morning and Friday evening, lower doses Tuesday and Thursday evening, and rather high doses midday on Wednesday and the last day of the treatment, as described in Figure 44 [6, 10, 13, 77].
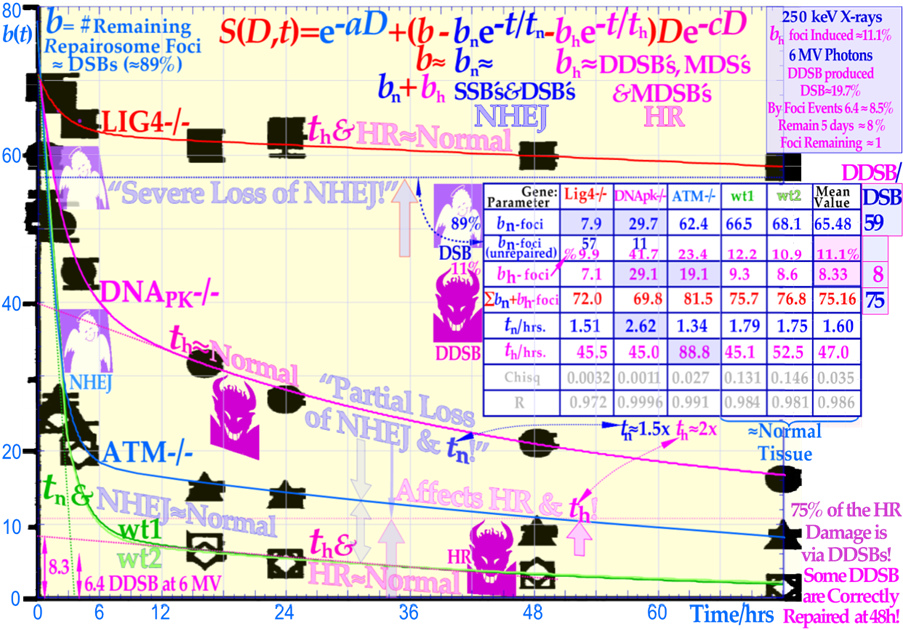
Figure 43: The decreased reparability with key inactivated DNA repair genes for mouse embryonal cell lines with a single repair gene knocked out. The fast NHEJ part is clearly separated from the slow HR repair, especially for wt 1&2. As expected, the fast part is almost totally lost for the Lig4 knockout cell-line. The Average HR foci are 8.3 at 2 Gy (250 keV) and the Number of DDSBs is 6.4 (at 6 MV) according to Figure 50!
Figure 43 is indicating that about 20-30 % of these DDSBs may be successfully repaired by HR after about 48 hrs. Interestingly, 89% and 11% of NHEJ and HR repair fractions agree quite well with 83% DSB and 17?SB fractions observed with nanometer resolution pKu70 DSB detection seen in Figure 50 for 6 MV Photon beams as maybe expected since the DDSBs are most likely requiring HR repair assistance as discussed in Figure 14 and 15. The blue shaded values in the table are excluded in the normal mean value calculation. Modified from [8, 106].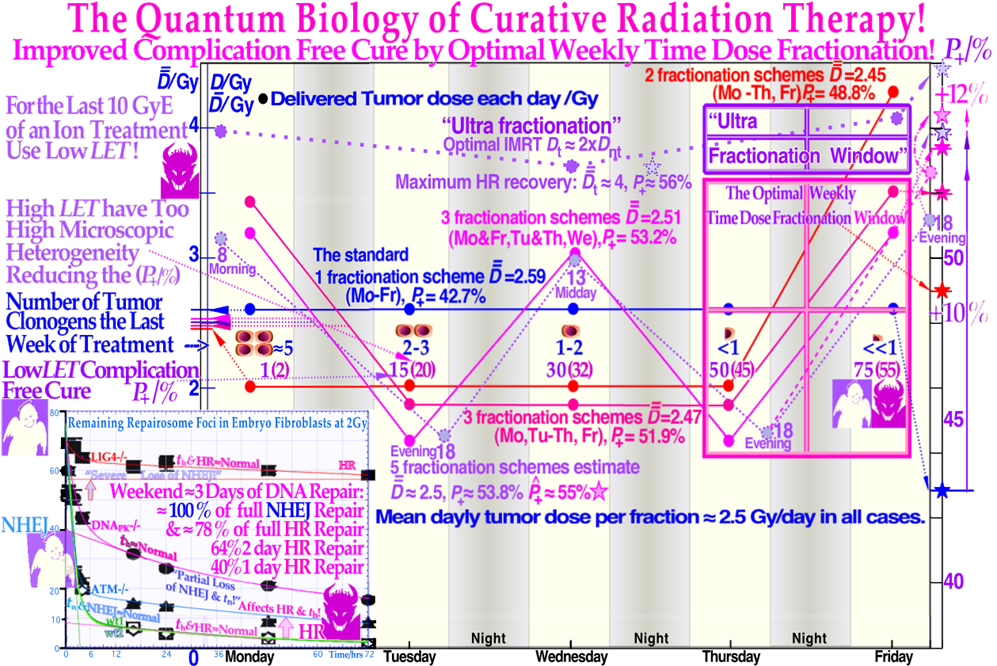
Figure 44: Using the optimal weekly fractionation schedule an improvement in complication-free cure by up to 12% (P+, right scale), making the weekend free from treatments and maximizing the sublethal damage HR repair in normal tissues as seen in the lower right insert and the previous Figure 24. The Ultra Fractionation especially valuable with ion beams.
The insert based on Figure 43 also shows decreased reparability with key DNA repair genes knocked out [1, 3]. Interestingly, the improved normal tissue repair capability is particularly valuable during the last week of treatment when the tumor burden is considerably reduced and normal tissues suffer the most after several weeks of treatment. Nevertheless, the last treatment fraction should be high to use the extra repair potential at the end of treatment. Clearly, the advantage of a low-LET round-up after a high-LET treatment will generally optimize the whole treatment procedure, not least using the present fractionation approaches. As seen in the middle row of cells and violet numbers, a low LET round up can regain the highest possible P+ and complication-free cure. Interestingly, the low dose Tuesday and Thursday could be reduced even further to save work in the clinic and reduce the workload on the ion accelerator and the patient by totally eliminating them all together as shown above. This would allow even better HR repair (≈ doubled) during the week which may be especially valuable with ion beams (“Ultra Fractionation”, violet doted curve, coined as a better alternative to ultra hypo in Figure 46 2)) as was clearly seen in the inserts of Figures 20 and 43. Similar procedures were already used successfully in Chiba as they reduced the fractionation with carbon ions on NSCLC to 4 Fr/1week, it was better than 18 Fr/6w or 9 Fr/3w [34, 112] as seen in Figure 45. This is also ideally applicable to the Flash++ technique proposed in Figure 27-29a,b,c,d. Figure 44 is modified from [1, 13, 59, 106, 113].
It is even plausible that the optimal fractionation with light ions is where a high portion of the dose is given as HR inducing damage according to Figure 20 and if it falls partly in normal tissues they would benefit if the HR part of the damage gets increased repair time just as it does over the weekend. It may thus be a god idea to only give high doses on Mo We Fr, and avoid treatment on Tu, Th to improve the normal tissue repair as these small dose fractions at least may not contribute very much to the complication free cure as seen in Figures 44-46 (“Ultra Fractionation”)! Such a fractionation schedule maximizes the sublethal DNA damage repair particularly via the HR pathway in tumor surrounding normal tissues. The tumor, often with a mutated TP53 gene and/or repair genes (e.g., ATM and DNApk), has no advantage with a 60–100% longer repair time, as shown in Figure 43 by its accompanying table and the lower left insert in Figure 44. The icons in the increased therapeutic window also indicate the improved complication free cure obtained by using low LET the last week of therapy as discussed in detail in the previous sections, owing to their much lower microscopic uncertainty in dose delivery (cf Figures 30 -38). It is also interesting to observe in Figure 44 that the difficulty to repair DDSB by NHEJ, discussed in detail above seems to be partly repairable by the HR pathway as seen by the lowest curve in the diagram where a double arrow indicate the fraction of DDSBs generated at 6 MV bremsstrahlung (cf Figure 52), this should not be more than that with X-rays but still a fair fraction seems to be repaired at e.g. 48 hrs.! This is most likely due to the high flexibility of the MRN dimer complex that has 2x100+ nm reach of the Rad50 Dual coiled coils as mentioned above [60]! The fractionation standard has changed the last 40 years as shown in Figure 46 largely after the introduction of IMRT from the classical 2 Gy/Fr often using parallel opposed beams where the normal tissue morbidity cold be kept low and even lower with IMRT.
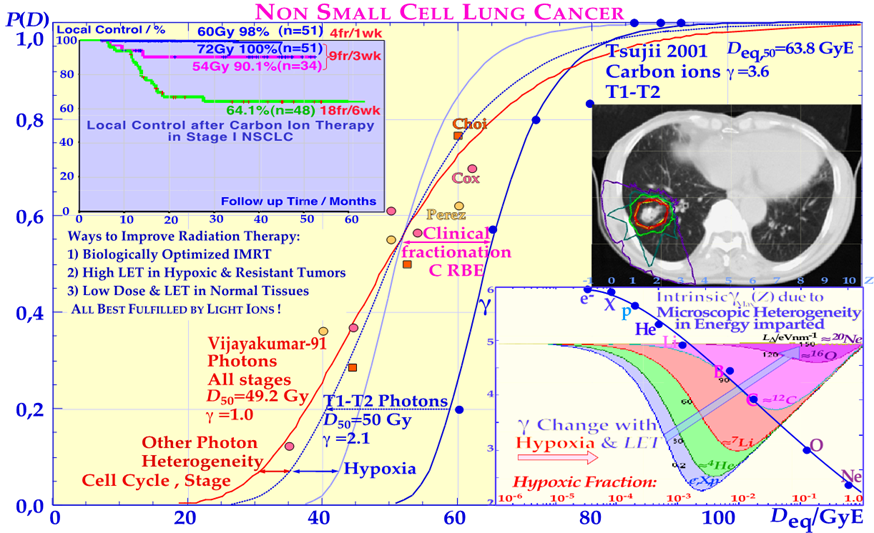
Figure 45: Comparison of Clinical results using photons with carbon ions showing an advantageous steeper Dose Response Relation (DRR) for lung tumors with carbon ions. There is significant improvement in efficiency reaching close to 100% cure compared to conventional radiation therapy.
The increased steepness in Figure 45 improves the therapeutic window and is due to a more efficient killing of hypoxic tumor cells (cf Figures 47, 48, [13]: Figure 126). The change in the normalized dose–response slope as a function of the hypoxic fraction and ion species is shown in the lower right insert. The normalized slope of the Dose Response Relation (γ37) in the first approximation decreases in low LET beams as the hypoxic fraction increases due to the increasing tumor heterogeneity with a dominating small hypoxic compartment, as seen in [13]: Figure 112. After 1⁄2 % hypoxia, it starts to increase again as most of the tumor clonogens become hypoxic as seen in Figure 45 insert (decreasing tumor heterogeneity). However, as the microdosimetric heterogeneity comes into play in beams of increasing LET, the intrinsic loss in γ to γMax (cf. also Figures 36-38) limits the regain in slope, as shown by the inserted blue microdosimetric heterogeneity curve. This effect will be less pronounced in the low D37 values but may influence the D50 and D90 values. Most of the loss in the dose–response slope for photons is due to hypoxia (cf sec 8, [13]). The variation in sensitivity over the cell cycle [14] and with tumor stage can also affect the response slope, not least for photons. Using advanced molecular tumor imaging and lithium or boron ions are likely to improve the cure even further for medium to large tumors respectively using a low LET high energy electron roundup for the largest tumors (cf [13]: Figure 134 as discussed in its sections 5.5 and 10.5). An interesting approach to these hypoxic lung tumors is given in [13]: section 10.4 and shown in its Figures 112, 125-128.
The increased steepness in Figure 45 improves the therapeutic window and is due to a more efficient killing of hypoxic tumor cells (cf Figures 47, 48, [13]: Figure 126). The change in the normalized dose–response slope as a function of the hypoxic fraction and ion species is shown in the lower right insert. The normalized slope of the Dose Response Relation (γ37) in the first approximation decreases in low LET beams as the hypoxic fraction increases due to the increasing tumor heterogeneity with a dominating small hypoxic compartment, as seen in [13]: Figure 112. After 1⁄2 % hypoxia, it starts to increase again as most of the tumor clonogens become hypoxic as seen in Figure 45 insert (decreasing tumor heterogeneity). However, as the microdosimetric heterogeneity comes into play in beams of increasing LET, the intrinsic loss in γ to γMax (cf. also Figures 36-38) limits the regain in slope, as shown by the inserted blue microdosimetric heterogeneity curve. This effect will be less pronounced in the low D37 values but may influence the D50 and D90 values. Most of the loss in the dose–response slope for photons is due to hypoxia (cf sec 8, [13]). The variation in sensitivity over the cell cycle [14] and with tumor stage can also affect the response slope, not least for photons. Using advanced molecular tumor imaging and lithium or boron ions are likely to improve the cure even further for medium to large tumors respectively using a low LET high energy electron roundup for the largest tumors (cf [13]: Figure 134 as discussed in its sections 5.5 and 10.5). An interesting approach to these hypoxic lung tumors is given in [13]: section 10.4 and shown in its Figures 112, 125-128.
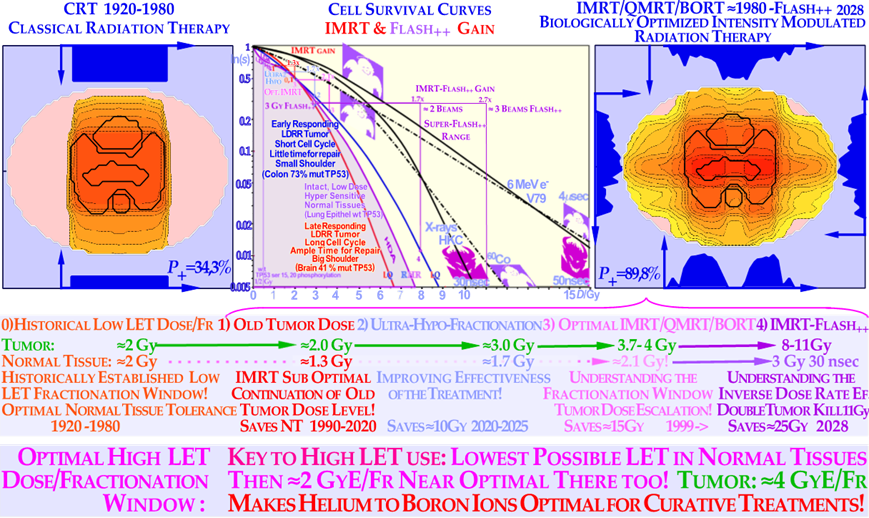
Figure 46: The classical 2 Gy/Fr tumor dose was largely derived in the era of parallel opposed beams so the tumor and normal tissues had about the same dose per fraction. With IMRT the Tumor dose can be elevated without affecting normal tissues allowing significant tumor dose escalation as seen to the right. The Super Flash inverse dose rate effect is so large that it is sufficient to use it only on Fridays to avoid too massive weekly tumor cell kill.
Unfortunately, many clinical centers continued conservatively with 2 Gy/Fr and used the IMRT advantage to reduce normal tissue damage even though the fractionation window suggests staying at 2 Gy as this is where minimal damage is inflicted in normal tissues per unit dose to the underlying tumor (cf Figure 25, [101, 105]). Ultra-Hypo-Fractionation was recently derived clinically to improve efficacy over the classical 2 Gy/Fr, but still largely unaware of the clinical function of the optimal fractionation window! The lowest section show how the window can be used with advantage also for the lightest ions not least using the Super Flash approach based on inducing Repair Protein Panic (RPP cf the nm resolution tracer image of DDSB and RPP Figure 15 and DNA repair sec 2- 5)! Interestingly, this induces an inverse dose rate effect in the tumor at doses above ≈ 8 Gy the tumor reduced cell kill is gone and at 11 Gy the tumor kil is more than doubled due to RPP since the Ku-DNApk dimer complex and p53 does not reach the damage site in time for NHEJ repair to function well, as seen in the middle insert for 30 nsec X-ray pulses (HKC Human Kidney cells [91, 92]). The inverse dose rate effect is so large that it is sufficient to use it only on Fridays to avoid too massive weekly tumor cell kill not just by LDA apoptosis.
With increasing use of IMRT the old practice of 2 Gy/Fr often was continued thus losing some of the advantages of the new method where the total dose could be reduced by 10 to 15 Gy {6, 11, 13]. This was possible since the lower dose per fraction necessitated a higher total dose! By using the optimal fractionation window of normal tissue a more efficient treatment technique would be to keep the dose to normal tissue at 2 Gy/Fr as explained here by the fractionation window and escalate the tumor dose as high as clinically possible up to 3-4 Gy/Fr and more if allowed by the IMRT technique in use (cf Figure 46 [101, 105]). It is fascinating that the LDA and HDA processes allow the least detrimental normal tissue response at around 2 Gy/Fr as clearly seen in Figures 19, 22, 41 and 42. For a tissue with normal TP53 genes with its unavoidable low dose apoptosis which is protective via caspase 3 until about one half to one Gy when both NHEJ and HR repair are fully operational. Clearly, we should use this advantage as much as possible until high dose Apoptosis (HDA) sets in above 2.5 Gy low LET, that's why at least for lung tissue we should stay inside 1.8-2.3 Gy as seen in Figures 40 and 41. Even if it was discussed more than 25 years ago {101, 105] it is first during the last five years people have seen the need for tumor dose escalation but now it is called Ultra Hypo Fractionation with significant clinical benefits but not yet generally following the optimal daily fractionation window proposed here (cf Figures 41-46 [105, 114 -119].
To clearly show the physical and biological differences between Boron and Carbon ion beams their partial ionization density contributions along their absorbed dose distributions are shown in Figure 23. Even if their physical dose distributions are quite similar, their local ionization densities and LETs are rather different with the whole entrance region of carbon being of medium LET. With boron this region is mainly low LET and the high LET region only extends ≈2cm in front of the Bragg peak whereas it is about 5cm for carbon ions as seen in Figure 23.
Furthermore, there is negligible elevated LET behind the Bragg peak of boron, so normal tissues both in front of and behind the tumor are much less damaged by boron therapy which is an important clinical advantage! This makes boron ions most suitable for mixed beam therapy of medium size tumors [13].
The biological effect of low-to-medium LET radiation is dependent on the local oxygen concentration in the cells since oxygen radicals then mediate part of the cell death. Often, this makes well oxygenated normal tissues suffer radiation treatment more than generally hypoxic tumors. With low LET, an often 2–3 times higher dose (OER ≈3) is needed to eradicate hypoxic tumor cells. For high LET radiation, such as light ions, this so-called oxygen enhancement ratio is reduced for hypoxic tumors (OER≈1.5–1.7).
Furthermore, light ion Bragg peaks that are applied only in the tumor volume further improve this fact since the high dose and LET are then mainly present in hypoxic tumor cells and not in normal tissues. With QMRT, the highest LET Bragg peaks could even be reserved for the hypoxic core of the tumors [34, 120-122].
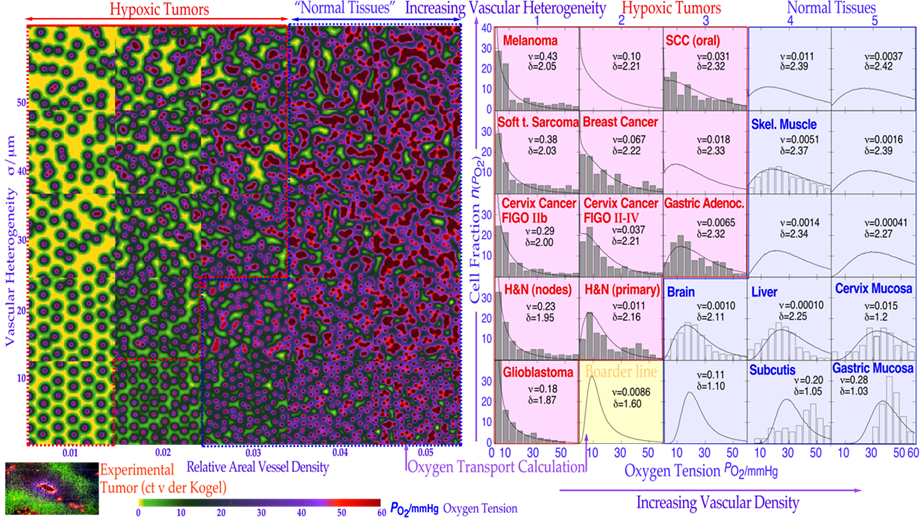
Figure 47: Illustration of how a reduced density of blood vessels and increased randomness in the geometric distribution typical of tumors reduces oxygenation, particularly at large distances from the vessels, and increases the number of cells with significant hypoxia (PO2 < 5>
The color look up table (lower left scale) was adopted from that of hypoxic tissue markers (lower right insert, courtesy van der Kogel). The vascular model of oxygen diffusion as seen to the right is given here by the solid line cellular oxygenation curves and often agrees very well with many clinically observed Eppendorf data sets for tumors (pink panels with gray histograms in the left half) and normal tissues (blue panels with open histograms in the right half). It is clearly seen that most tumors have a significantly low oxygenation and radiation-resistant cell fraction as opposed to most normal tissues that are well oxygenated and radiation- sensitive and lack a severe hypoxic cell fraction that characterizes hypoxic tumors [123].
The clinical problems of a very small hypoxic tumor cell fractions (10-5) affects an otherwise well-oxygenated tumor are clearly demonstrated in Figures 47-48. In the first approximation, it does not matter whether the cells are spread out or nodal. The blue curve shows the response of the well oxygenated fraction as a function of the dose equivalent in GyE, so the same curve holds approximately for photons and carbon ions (the real carbon curve slope should due to microscopic heterogeneity effects actually be more similar to the red curve as seen in [13]: Figure 112). The difference comes from the few hypoxic cells that are easily cured by the carbon ions, dotted red curve, so the total tumor is just shifted a GyE or two. With photons, the hypoxic cells need some 15 Gy extra (dotted pink curve) due to their high OER, so they totally dominate the tumor response, and these few most resistant cells determine the low clinical response slope γC ≈3 a severe reduction from the oxic value of almost 7 for ≈ 5 cm tumor. The change in oxygenation status in 25 cubic cm-sized pieces of tissue of varying vascular density (x-axis) and vascular heterogeneity (y-axis) are shown in Figure 47. The calculated oxygen tension distribution in a section of the cube is color coded the same way as the experimental tumor sample. In the right half, the average oxygenation curves of each cube are shown (solid line curves) in rather good agreement with experimental Eppendorf histogram data (tumors: pink shading, normal tissues: blue shading [123]).
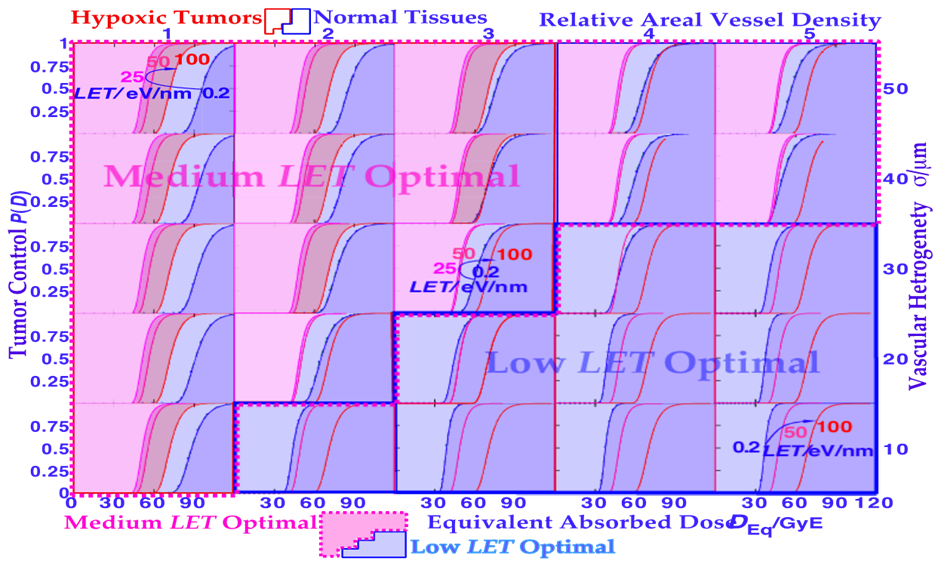
Figure 48: Overview of how the effective DRR is influenced by the LET off the beam from 0.2 eV/nm photons via 25, 50 to 100 eV/nm carbon ions for each cubic tissue type taken from Figure 47. Interestingly, the medium LET in the neighborhood of 25 eV/nm is most efficient for most hypoxic tumors (pink background), whereas X-rays or electrons are optimal for more well-oxygenated tumor tissues such as nonradiation-resistant tumors (lower right corner, blue background). Based on the oxygenation data and tissue oxygenation calculated in Figures 47 (cf also Figure 45, showing intrinsic ion contributions [124]).
It is quite clear that a low vascular density and high heterogeneity are characteristics of most hypoxic tumors in the upper left corner of the diagram. The tissue oxygenation curves in Figure 46 are converted to dose response relations of varying steepness as the hypoxic fraction and mean LET increase, generally requiring higher doses as the hypoxic fraction increases, as seen in Figure 48. Furthermore, it is seen how a small hypoxic fraction in a tumor significantly reduces the slope of the DRR with low LET photons in Figure 45.
Interestingly, the most advantageous dose‒response relationship with the lowest equivalent dose to the patient is generally at a quite low mean LET near 25 eV/nm (unfortunately, the effect of microdosimetric heterogeneity is not considered in Figure 48 but will be similar to that of boron ions in Figure 37). However, since the microdosimetric heterogeneity mainly affects the higher LET curves, the conclusions are still largely valid. In fact, for pediatric tumors we should even go back one or preferably two steps as proposed in Figure 18 where the unique properties of lithium ions are pointed out allowing molecular radiation therapy [13, 16]. This is a true description since the highest possible apoptosis and senescence is induced in a 5 mm size spot with mainly a low dose of especially low LET in the surrounding normal tissues associated predominantly with a low level of milder type DNA damage keeping the classical fractionation window wide open (cf Figures 41 and 42). By using the new unique nanometer resolution method to look at tissue reactions after irradiation as shown above in Figures 7 and 15 it was possible to accurately quantify the number of DSBs and higher multiplicity DDSBs produced by different ions and photons as shown in Figure 50 [9, 87, 125].
It is seen in the histogram that the event multiplicity often can be quite high in total agreement with the mean d - electron multiplicity on the ion track linked to the RBE as seen in Figure 7.
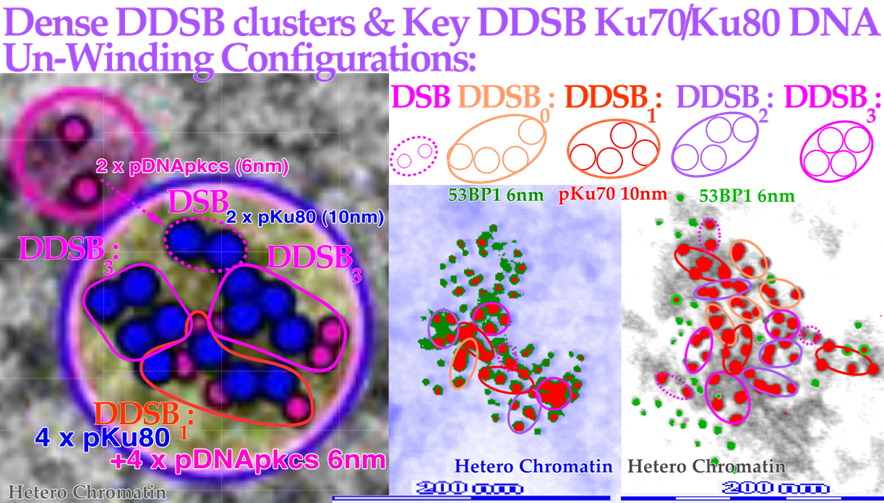
Figure 49: Close-up view of three dense heterochromatin (gray, light blue, gray) DNA break clusters with 7, 15 and 29 DSBs and 3, 7, 13 DDSBs (euchromatic regions are in their original gray or light blue background). At least ≈1, 2 and 9 δ-electrons probably produce them, respectively (cf Figure 52).
Interestingly, one DDSB1 with 4x pKu80 (dark blue) and 4x pDNApkcs (smaller 6 nm dark pink beads inside black circles) was seen inside the red curve in the first smallest DDSB cluster almost as expected from a full DDSB1 cluster as in Figure 15 with a DNApk-Ku-Lig4 tetramer complex (cf also Figures 13-14 and [6, 59]). Obviously it is not always certain which configuration to choose, e.g., a DDSB could also sometimes be two separate ordinary DSBs. Simultaneously to the top right a pDNApkcs dimer is possibly on its way to the simple DSB or the nearby DDSB3 missing two. As seen here these clusters can generate severe RPP phenomena as indicated more clearly in Figure 15.
Interestingly, as seen in Figures 13 and 50 the event multiplicity can be quite high in ion beams as also seen here by very severe damage events far beyond what can be obtained at normal doses of photons and electrons where there is always only a single local d-electron [11, 14]. Still the relative distribution of higher multiplicity DSB events seems to be very similar for lower doses carbon, helium and nitrogen ions and photons (cf Table of Figure 50 and 13) indicating that the principal actor in both these events are the d-electron. It is just the number of events that is about three times higher with the ions per unit dose. Approximately 20 % of the DSBs are apparently deposited as dual DSBs or DDSBs as seen in the left part of the Table and to the right about 40 % are deposited as DDSBs or higher multiplicity events for carbon ions. The vary high multiplicity clusters in Figure 50 are clearly produced by random multiple local d-electrons beyond the mean multiplicity and should be avoided for therapy by using the advantages of boron and lighter ions as seen in Figures 22, 23, 31 [13, 73].
The new understanding that most normal tissues with an intact TP53 genes are LDHS as discussed above (cf Figures 14, 16, 20 and 21 [6, 7]) means that the tumor dose per fraction should no longer be 2 Gy, since this is in the region where tumor and normal tissues are almost equally sensitive as seen in Figures 18 and 52. It is then better to truly use the fractionation window advantage and use the radiation resistance induced by the first 1⁄2 Gy and continue up to 1.8-2.3 Gy where after HDA start to set in. This means that the tumor dose per fraction will be >3 Gy, which is good, especially for the slowly responding tumors, as shown in Figures18 insert and 52.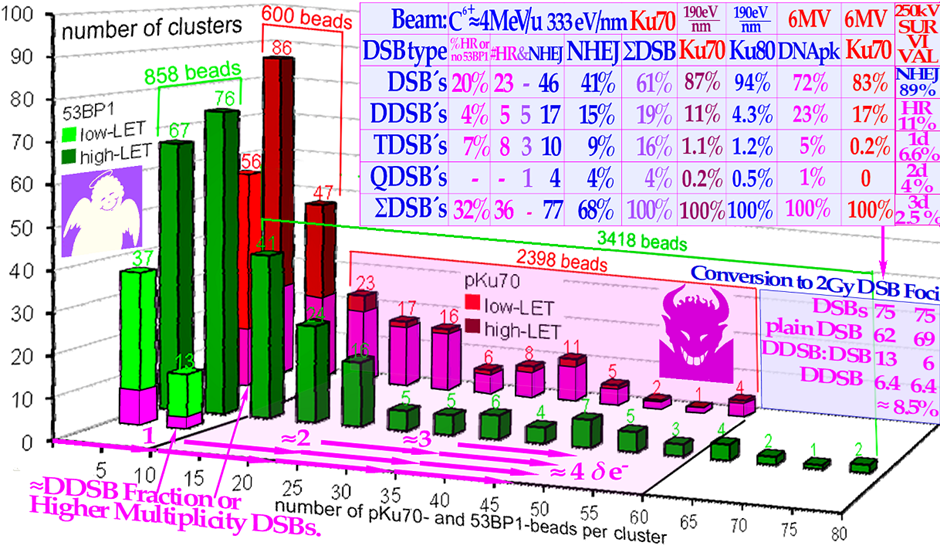
Figure 50: Quantification of the frequency and sizes of higher-multiplicity DSB and DDSB clusters. The table shows the situation mainly in euchromatin and high- and low-LET beams, whereas the histograms shows the situation mainly in heterochromatin for Bragg peak carbon ions, sometimes with extremely high DDSB multiplicity mainly associated with random local multiple δ-electron production, but not at low LET.
Such a severe toxicity is more than necessary to cure a tumor as seen in Figure 7 and 18 above and should be avoided as much as possible by keeping the δ-ray multiplicity at 3 or lower in normal tissues. Interestingly, the 53BP1 and pDNApkcs proteins seem to be most effectively recruited to more severe damage clusters and 53BP1 is somehow probably over recruited here. Furthermore, the NHEJ and HR repair fractions of Figure 43 approximately agree with the DSB and DDSB fractions indicating that the DDSBs often require HR repair assistance as discussed in connection to Figure 14 as NHEJ stalls! Modified from ([6, 125, 126]: Figures 2 & 4).
Assuming that the tumor is mutant on TP53, as most tumors are, we can then use the classical LQ model (otherwise we need the RCR or RHR formulation in [59]: Figure 21 [13]). However, to avoid normal tissue damage as far as possible the lightest ions from Helium to Boron are most
effective since their ionization density is mainly elevated in their Bragg peaks to be solely placed in the gross tumor and allowing the effective use of the clinically well-established low LET: LDHS and LDA fractionation- window at ≈2 Gy/Fr in normal tissues (see [13]: sec 4.7). Figure 52 implies that the low LET tumor dose should generally be well above the 2 Gy level to ensure effective cure! In fact, the 2 Gy dose level is approximately harming both tumors and normal tissues to the same extent. As seen in Figure 46 it may be more optimal to try to reach a ≈4 Gy tumor dose so we can reduce the tumor burden in fewer fractions for example 4w of 3fr/w ultra fractionation to 48 Gy may be suitable saving about 15 Gy total dose compared to classical 60 Gy thanks to the better HR repair and tumor dose/Fr [13]. Such a schedule in GyE would be good also for boron and lithium ions where improved HR repair in normal tissues is even more important (cf Figures 20, 43-46).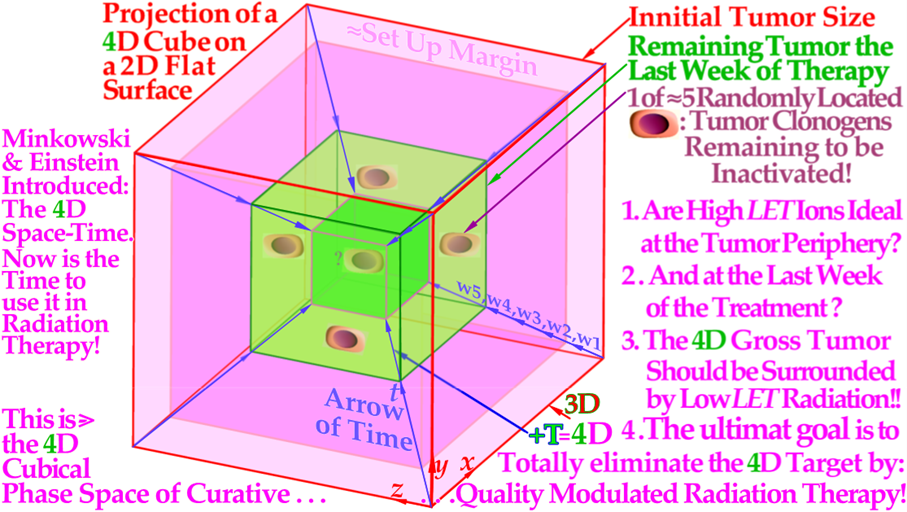
Figure 51a: A cubic 4D space–time internal target volume is projected on a 2D flat surface showing the need for low-LET electrons or photons to roundup an optimally performed high LET carbon ion treatment.
Like a 3D cube in 2D is two squares with all corners connected (eg the red outer cube), and a 4D cube in 3D is two 3D cubes with all their cubical corners connected, in this case with the blue fourth dimension time arrows connecting the red, magenta and green cube corners as seen in Figure 51a. The periphery of the 4Dinternal target volume [13], including the initial setup margin (pale pink) and the few remaining gross tumor clonogenic cells (greener volume), will substantially benefit from the last 10–15 GyE being delivered with minimal LET and microdosimetric variance using electrons or photons (cf Figures 3 and 37). Interestingly, both the few remaining clonogenic tumor cells in the gross tumor and the setup margin are best eliminated with an optimized 15 GyE low-LET treatment roundup, and for bulky tumors, the first 5 GyE of those may include a concomitant higher-LET initial gross tumor boost in case of risk of an hypoxic remainder [11, 77]. It looks like the tumor volume is shrinking but it is mainly an effect of the 4 D perspective along the time-axis! Even if it would be most optimal to treat the setup margin largely by a low LET it is natural to also give the low LET roundup dose all the way to the margin that may initially contain some tumor clonogens depending on setup uncertainties etc.
A graphical Comparison of the radiobiological effectiveness (effective LET, RBE, and OER) and the lateral (penumbra) and longitudinal dose distributional properties and tumor to superficial tissue dose ratio (cf [13]: Figures 17, 88, 108) for uniform parallel-opposed beam e.g. in a pelvic irradiation (cf Figure 25) using different radiation beam modalities as shown in Figure 51b. The higher the spherical indicator the more effective the beam is for eradication of hypoxic and generally radiation-resistant tumors. The approximate costs per typical installation and per patient treated are also indicated. The increase in the tumor to normal tissue dose ratio using electron and photon IMRT are indicated. Similar improvements using biologically optimized intensity-modulated or radiation quality-modulated-light ion radiation therapy should also be possible. Interestingly, the optimal transition from a high to low LET should be when only a handful of tumor clonogens remain as shown in Figures 3, 37, 44. At that time, most of the severe hypoxia is gone, preferably following the last weekend of neutron or ion treatments, giving an extra valuable HR-dependent DNA repair and hopefully a tissue reoxygenation boost, as shown by Figures 33-36. Interestingly, Super Flash will move all possible symbols about as far as the IMRT arrows further up to the right which implies that Super Flash will be a regular part of state of the art radiation therapy, probably it will be poor mans ions in 10 years time!
In fact, the discussion above about the last week of ion and neutron therapy should also apply at least partly to the previous week because the periphery of the initial internal target volume [127] may only harbor a lower density of tumor cells. This could either be due to microscopic growth or diffusion of tumor cells and/or to an added setup margin to account for organ motions and establish set up uncertainties [127], as shown in Figure 51a. Independent of the exact reason, this margin is also unlikely to harbor high numbers of hypoxic or radiation-resistant tumor cells, and it therefore does not truly benefit from an elevated LET treatment that unfortunately is likely to cause unnecessary normal tissue damage. The differences in the wide spectrum of TP53 mutations and the active gene pool of their host tissues is likely to determine or influence the remaining amount of LDA and HDA of different tumor cell lines. The optimal therapeutic dose is formulated in [13]: sec 10.6 and is almost consistent with the recent use of the odd term “Ultra-hypo-fractionated” radiotherapy as we have described it here in terms of using the optimal low LET time dose fractionation window (see sec 7) and making a true IMRT based tumor dose escalation as proposed already some 27 years ago (cf Figures 41, 46 [13, 101, 105, 114-119]).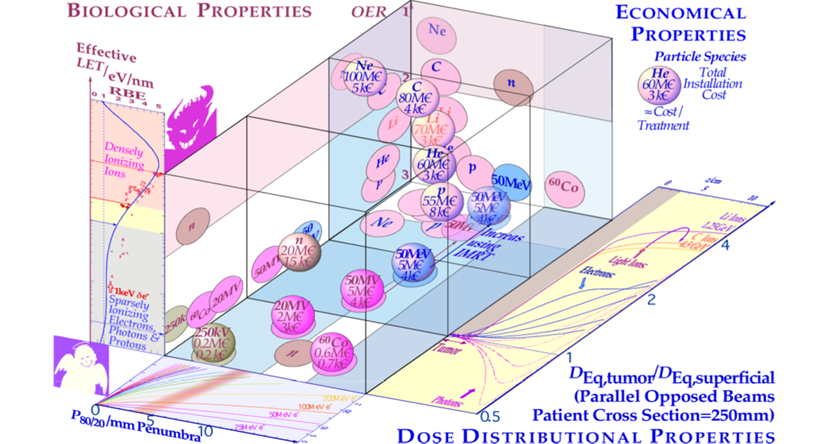
Figure 51b: Overview of Dose Distributional, Biological and Economical (≈2010) Beam Properties! Comparison of the radiobiological effectiveness (effective LET, RBE, and OER) and the lateral (penumbra) and longitudinal dose distributional properties and tumor to superficial tissue dose ratios (cf Figures 7, 22, 25) for uniform parallel-opposed beam e.g. in a pelvic irradiation (cf Figure 25) using different radiation beam modalities as shown. The higher the spherical indicator the more effective the beam is for eradication of hypoxic and generally radiation-resistant tumors. The approximate costs per typical installation and per patient treated are also indicated. The increase in the tumor to normal tissue dose ratio using electron and photon IMRT are indicated. Similar improvements using biologically optimized intensity-modulated or radiation quality-modulated-light ion radiation therapy should be possible even using grid therapy as discussed in more detail at the end of [13]: sec 10.6 [128, 129] and in Figures 27-29.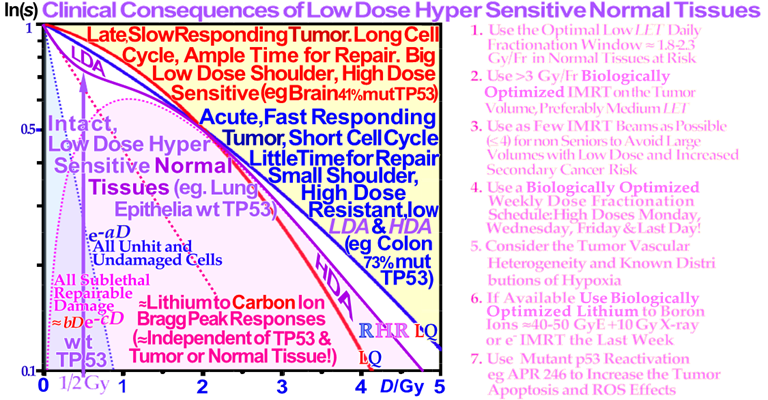
Figure 52: Close-up view of the characteristic cell survival curves of intact LDHS normal tissues (violet) whereas most tumor cell lines that often have a mutant TP53 gene, resulting in a low-dose radiation resistant (LDRR) phenotype due to reduced LDA and HDA (cf Figures 18-22).
As seen from the low dose curve shapes in Figure 52, for effective cure, such tumors generally benefit from the lightest ions with lowest possible LET in normal tissues or high IMRT doses low LET is actually ideal for Super Flash therapy, especially on slowly responding tumors. On the right side, some of the key clinical conclusions drawn from these curve shapes are summarized (cf [1, 6, 7, 10, 14] for further details). In radiation therapy, this means that the fully functional DNA repair system should continue to be utilized until more severe high-dose apoptosis sets in after 2–2.5 GyE or two DDSBs, as seen in Figure 18. Thus, there is a low-LET optimal radiation therapy fractionation window in normal tissues ≈ 1.8–2.3 Gy/Fr to minimize normal tissue damage, as seen indirectly in Figures 18 and here, as further discussed in detail in ([13]: Figures 57, 58, 77, 78, 82, 84, 100 cf. also its sections 5.5, 5.6 [6, 13, 63]). The structure of high LET ion survival is also indicated as the low LET induced LDA and HDA regions of tumors and normal tissues practically overlaps (1-1.5 Gy ions ≈ 3-5 GyE) as clearly seen by the detailed apoptosis data (see Figures 19 - 22 [13]: Figures 45, 46, 99, 102-105, and 120). The Super Flash technique in Figures 27-29 may be the optimal treatment for many LDRR tumors in combination with p53 reactivation and light Ions Figures 23, 25 especially when tumor hypoxia may be a problem Figures 29d, 47, 48.
It should be pointed out that the plateau part of the carbon ions is of medium LET as seen in Figure 23 so even if it looks like a low dose contribution it is delivered many times by often a scanned pencil beams or a ridge filter to elevate the dose level and get normal tissue medium LET adverse reactions in fairly large volumes. This can largely be avoided by Lithium and Boron ions and/or a low LET treatment round up that at the same time reduces the microscopic heterogeneity on the last few tumor clonogens the elimination of which bring the tumor cure probability from a few per cent up to 90-95%. This cure level is hard to reach with larger tumors and high LET ions alone, with substantial cold spots and an increased risk for normal tissue damage at least for largest tumors and a reduced dose response steepness all leading to an insufficient complication free cure probability as seen in Figure 38!
Fractionation and low LET treatment roundup with Carbon ions and Lithium Super Flash!
Contrary to the common belief that simple DSBs are often potentially lethal, we have shown that the plain low LET DSBs are repaired to more than 99% at 2 Gy. Instead, the common effector of curative radiation therapy are the dual double strand breaks (DDSBs) at the periphery of nucleosomes that often induce lethal tumor damage generally well beyond about 2 Gy low-LET. The most important clinical consequence is that we need to reconsider the classical 2 Gy/Fr mean tumor dose for low-LET radiation based on the molecular processes that make most normal tissues truly low-dose hypersensitive with LDA and HDA due to an intact TP53 genes as summarized in Figure 18. Interestingly, full NHEJ and HR repair activity is induced in normal tissues after 1⁄2 Gy, and thus at 2 Gy with ≈ 1.5 Gy being delivered with the clinical advantages of fully efficient NHEJ and HR repair and almost full NHEJ recovery before the next day’s treatment fraction. To minimize damage to normal tissues at risk, a maximum dose of ≈2.3 Gy/Fr (or a little less) implies optimal tolerance of normal tissues and allows a significant boost in tumor dose per fraction and approximately a 10-15 Gy total absorbed dose reduction [11, 13]. This also means avoidance of the more severe high-dose apoptosis that sets in after 2–3 GyE and a couple of DDSBs. To truly introduce a major paradigm shift in curative radiation therapy thinking, the time dose fractionation should also be optimized for substantial weekend HR recovery (and simultaneously complete NHEJ recovery) in normal tissues by higher doses Friday evening and Monday morning and midday Wednesday. The Tuesday and Thursday fractions could be given lower doses or even totally eliminated from irradiation as indicated in Figure 44 to maximize HR recovery even further particularly with light ions. In addition, the high microscopic heterogeneity implies that optimal use of carbon ions is with a 10-15 GyE low LET treatment roundup to ensure: highest possible dose response steepness, minimal normal tissue damage and maximum complication free tumor cure as seen in Figure 38! To regain the low-LET fractionation window at 1.8-2.3 Gy/Fr in normal tissues we urgently need to open the door for the lightest ions ≈helium-lithium up to boron allowing the more efficient apoptotic–senescent Bragg peak molecular radiation therapy approaches that maximize the effect in the tumor and minimize it in the normal tissues. The medium LET in the entrance region of carbon ions is not compatible with the classical 2 Gy fractionation window of normal tissues which is one of our most important life lines for curative radiation therapy as shown above and proven over more than a century of successful treatments and the present most recent molecular and analytical understanding as shown in Figures 18, 19 and 23-28 [1-13]. Furthermore, the full understanding of the Super Flash mechanism allows full optimization of the ultra-short dose delivery by IMRT Flash++ dual gantries and will potentially expand the radiation therapy market in a few years! Taking the above proposed approaches into account, the resultant increase in complication free cure is likely to reach improvements by as much as 30 % and more for many tumor sites for example when using Super Flash the lightest ions, the proposed optimal fractionation window and possibly also mutant p53 reactivation [1, 6-10, 63]. About half this improvement alone was estimated to come from the improved fractionation schedule in Figure 44, but also from better understanding of DDSBs, LDHS, LDA, HDA, and LDRR (Figures 18, 19, 38, 41) and optimal use of lithium ions and Super Flash as shown in Figures 27, 29d, 37, 38, 46 [1, 6, 8, 10, 13]. Thus avoiding higher LET ions as far as possible except possibly with more efficient use of the very useful low LET roundup method. With less than ten clonogens remaining in the tumor, ion beams are surely suboptimal therapy as can be seen in Figures 3a, 29-36 and 38! They are only useful for the first 50 GyE doses when there is sufficient numbers of tumor clonogens left. Then the low LET treatment round up can take over with steep tumor cure, minimal normal tissue damage and optimal complication free cure!
Dear Editorial Team, Clinical Medical Reviews and Reports. My experience with the journal was highly positive. The peer-review process was rigorous, constructive, and completed in a timely manner. The reviewers provided valuable comments that helped improve the quality and clarity of our manuscript. The editorial office was professional, responsive, and supportive throughout all stages of the publication process. Communication was clear and efficient, and any questions were addressed promptly. Overall, I found the journal to maintain high scientific standards and an excellent publication workflow. I would be pleased to consider submitting future work to this journal. Best wishes from, Elena Popa.

It was my pleasure to submit my testimonial concerning the Reviewer Board of our Scientific Journal “Brain and Neurological Disorders”. The Reviewers focused on some modifications and their contribution was helpful. The ladies of our Editorial Office were also supported my efforts. It was my honor to have such a co-operation and I am looking forward for more collaboration.

Dear Grace Pierce, Editorial Coordinator of Journal of Clinical Research and Reports, Thank you for the speedy and efficient peer review process. I appreciate the fact that your peer reviewers do not take months to respond like with some other journals. I would also like to thank the editorial office for responding quickly to my questions. It is an excellent journal. I plan to submit more manuscripts in the future. Best wishes from, Robert W. McGee

Dear Grace Pierce, Editorial Coordinator of Journal of Clinical Research and Reports, Working with you and your team on our recent publication in JCRR has been a truly wonderful and enjoyable experience. The responses were prompt, and the reviewers were patient, constructive, and highly professional. One reviewer in particular gave me the feeling that a professor was carefully reading and commenting on my coursework, which was deeply touching. The entire process was straightforward and hassle‑free, with no tedious online forms to complete. I highly recommend this journal. Best wishes from, DR Aibing Rao, Head of R&D

I Appreciate the Opportunity to Share my Experience with the Journal of Clinical Research and Reports. The peer review process was timely and constructive, and the feedback provided helped improve the quality of our manuscript. The editorial office was professional, responsive, and supportive throughout the process, ensuring smooth communication and efficient handling of the submission. Overall, it was a positive experience collaborating with your team.

Dear Mercy Grace, Editorial Coordinator of Obstetrics Gynecology and Reproductive Sciences, We would like to express our gratitude for your help at all stages of publishing and editing the article. The editors of the magazine answer all the necessary questions and help at every stage. We will definitely continue to cooperate and publish other works in the Obstetrics Gynecology and Reproductive Sciences! Best wishes from, Alla Konstantinovna Politova,