
Research Article | DOI: https://doi.org/10.31579/2766-2314/093
1 Odisha University of Agriculture and Technology, India.
2 ICAR- National Rice Research Institute, India.
*Corresponding Author: Prasanthi Golive, ICAR- National Rice Research Institute, India.
Citation: Anjan Kumar Nayak, Prasanthi Golive, Arundhati Sasmal, Totan Adak, Gaurav Kumar, (2023), Morpho-Biochemical Responses of Rice Genotypes Against Leaffolder, Cnaphalocrocis Medinalis, Guenee, J, Biotechnology and Bioprocessing, 4(4); DOI:10.31579/2766-2314/093
Copyright: © 2023, Prasanthi Golive. This is an open access article distributed under the Creative Commons Attribution License, which permits unrestricted use, distribution, and reproduction in any medium, provided the original work is properly cited.
Received: 13 June 2023 | Accepted: 23 June 2023 | Published: 30 June 2023
Keywords: antioxidative enzymes; leaffolder; genotypes; pca; phenol; protein; resistance; soluble sugar
Rice leaffolder, Cnaphalocrocis medinalis, Guenee is a serious pest of rice and causes significant yield losses. Insecticides are commonly employed to control this pest, but their use often escalates production costs and fosters pesticide resistance. Identifying insect-resistant rice genotypes and their resistance mechanisms is crucial for successful pest management. New sources of resistance providing long-lasting protection against leaffolder can be identified by studying the morphobiochemical characteristics of different rice genotypes. This study explored the role of various morphological traits of certain genotypes that confer resistance. Different biochemical constituents like soluble protein, phenol, total soluble sugar and enzymes viz., peroxidase, polyphenol oxidase and catalase were assessed spectrophotometrically in all infested and uninfested genotypes along with standard resistant (TKM6) and susceptible (TN1) checks. Leaffolder damage was negatively significant with plant height and leaf length (r = -0.903 and − 0.862, P < 0.001 respectively) while leaf width association was significantly positive (r = 0.773, P < 0.001). Among the different plant metabolites analyzed, total soluble sugar and soluble protein showed significant positive correlation (r = 0.778 and 0.788, P < 0.001 respectively) with leaffolder damage, conversely phenol (r = -0.651, P < 0.001) and antioxidative enzymes showed significant negative correlation. When rice genotypes were exposed to leaffolder larval feeding, they exhibited defence responses characterized by reduction in the level of sugars and proteins, accumulation of phenolic compounds and upregulation of antioxidative enzymes. This study emphasized the significance of morphobiochemical characteristics in rice resistance mechanisms against leaffolder. By leveraging these traits, new resistant rice germplasms against leaffolder can be developed.
Rice (Oryza sativa L.) is the most important staple food crop in the world, with more than 165 million hectares under cultivation. More than half of the population across the globe including major countries like China, India, etc depends upon rice for their nourishment (Lal et al. 2014). In India, rice cultivation is predominant in eastern and southern regions between the Ganga and Godavari rivers and is one of the most advantageous crops in terms of national food security, feeding about 60% of population (NFSM 2016). The rising food demand with population and the export potential of this crop make it even more valuable in the days to come. The qualitative and quantitative production of rice is limited by various biotic constraints such as insect pests, diseases and weeds of which only insect pests cause 20–30% of yield loss (Behura et al. 2011). Among insect pests, rice leaffolder, Cnaphalocrocis medinalis, Guenee is one of the major pests of rice that feeds on the leaves and damages the crop. The incidence of rice leaffolder increases both in lowland and upland rice fields, especially in those areas where modern high-yielding varieties are grown extensively (Bautista et al. 1984). The leaf damage ranges from 18.3 to 58.4 percent, depending on the stage of the crop at the time of infestation (Ramasamy and Jaliecksono 1996). Heavy infestations of this pest cause leaf damage to an extent of 60 to 70% (Kushwaha and Singh 1984) leading to significant yield losses (Shrivastava 1989). The leaffolder larva folds leaves longitudinally into tube like structures with silken threads and feeds on green leaf tissue within the structure. Larval feeding results in white, transparent streaks. Heavy infestation reduces photosynthetic ability and results in yield loss (Pasalu et al. 2005).
The use of chemical insecticides for management of rice leaffolder not only increases production costs but also increases the chance for pesticide resistance development (Nadarajan and Skaria, 1988). In this context, the rice plant uses various defense tactics and undergoes certain chemical and enzymatic changes when attacked by leaffolder to prevent feeding, which hamper its digestibility and accumulation of plant nutrition. These changes within the plant can influence herbivore establishment, feeding, oviposition, growth, development, fertility, and fecundity (Baldwin 1999). Certain rice genotypes are also embedded with morphological characteristics that provide natural resistance to insect pests. Various plant characteristics such as plant height, leaf length, leaf width, and leaf thickness have a significant impact on the settling, feeding by rice leaffolder on rice genotypes (Islam and Karim 1997). The morphological characters as well as plant metabolites along with antioxidative enzymes play a significant role in plant resistance against rice leaffolder. These traits are crucial for detecting leaf folder-resistant genotypes from a wide pool of germplasm. By studying these morphobiochemical characteristics of different genotypes, new sources of resistance can be identified and long-lasting protection against leaffolder can be developed. The search for resistant genotypes is the most important tactic in an integrated approach to rice pest management. This not only reduces dependency on the use of chemical insecticides, but also preserves the ecosystem from the harmful effects of these chemicals. The identification of insect-resistant rice germplasms and understanding their mechanism of resistance to insect pests have played a crucial role in the success of the 'Green Revolution' which has increased the profitability of rice cultivation, reduced safety risks for farmers, and contributed to a healthier environment (Alagar et al. 2007). Plant morphobiochemical responses following leaffolder damage have been studied in only a very limited number of rice genotypes. This current study would not only contribute to confirming the morphobiochemical basis of resistance against leaffolder but also expand the sources of resistant rice genotypes. Additionally, the findings from this study would be valuable in enhancing host plant resistance and improving the efficiency of rice breeding programs aimed at combating leaffolder infestations. Hence, the current experiment aimed to investigate the morphobiochemical factors that govern resistance to leaffolder infestation and examine the activities of defence components in both resistant and susceptible genotypes.
Plant material and culture of C. medinalis
The study was carried out for two consecutive seasons during Kharif’ 2022 and Rabi’ 2022-23 on 35 selected rice genotypes selected on the basis of their damage rating as per standard evaluation score (IRRI 2014). The selected genotypes comprised of 16 resistant, 14 moderately resistant and 5 susceptible genotypes along with standard resistant check, TKM6 and susceptible check, TN1. These genotypes and checks were acquired from Gene bank, ICAR-National Rice Research Institute, Cuttack, Odisha, India.The leaffolder culture was maintained using the method of Waldbauer and Marciano (1979) at a temperature of 25 ± 5̊ C and a relative humidity of 60 ± 10%. Adults collected from the field were released into antproof wooden oviposition cages (50 cm x 50 cm x 75 cm) containing 30-days-old TN1 potted plants. Honey solution (20%) dipped in a cotton ball was provided as adult food. After hatching of eggs, 25–30 first-instar larvae were transferred to a new TN1 plant of the same age to develop further. Second instar larvae (10-days-old larvae) from this stock were used for morphological and biochemical basis of resistance studies. The seeds were sown in a raised nursery bed followed by transplanting both in field and nethouse condition of ICAR-NRRI, Cuttack. For morphological characteristic studies 21 days old seedlings of each genotype were transplanted in three replications in the field at 20 X 15 cm spacing while for laboratory analysis, the seedlings were transplanted in the nethouse in 25 X 20 cm size mud pots. In the net house four numbers of single seedlings were transplanted at a spacing of 10 cm each. Out of the four seedlings planted, three were considered as three replications and one is kept as control. At peak tillering stage, the seedlings that were replicated thrice were released with three numbers of second instar larva from the stock culture and covered with transparent mylar cage leaving a control outside the cage without any insect infestation. The insect was allowed to feed for 15 days to conduct different biochemical analysis.
Plant morphological characteristics in imparting resistance to leaf folder
Field data from the 35 selected genotypes and standard checks were recorded during peak vegetative stage at 60 DAT. The plant height, leaf length and leaf width were observed from randomly selected ten hills in each replication using standard scale and correlated to leaffolder damage.
Biochemical constituent’s analysis imparting resistance to rice leaffolder
In the nethouse at peak tillering stage all top leaves of the potted plants were infested with second instar larva of leaffolder in three replications keeping an uninfested plant as control. Fifteen days after infestation, 1g leaves from each genotype were collected from both infested and uninfested plant and analyzed for their biochemical constituents. The second and the third leaves from the top were selected for the study. Biochemical analysis was also done to determine the variations in the biochemical components of rice genotypes before and after the leaffolder infestation. The leaves collected from healthy and infested plants were stored at -70°C for the analysis of biochemical components.
Total soluble sugar
Total sugar content in the test plant samples was estimated by Nelson Somogyi method (Nelson 1944) using glucose as standard, and expressed in mg g− 1 of plant tissue.
Total soluble protein
Protein content was determined by Lowry’s method (Lowry et al. 1951) using bovine serum albumin as standard and expressed in mg g− 1 of plant tissue.
Total phenol
Total phenol content in the test plant samples was estimated by Folin-ciocalteu reagent method (Bray and Thorpe 1954) using catechol as standard, and expressed in mg catechol g− 1 of plant tissue.
Antioxidative enzyme analysis
Peroxidase
Rice leaves weighing 1 gram were crushed in 5 mL of 0.1 M phosphate buffer (pH 7.0) using a pestle and mortar that had been pre-chilled to 4°C. The resulting mixture was then centrifuged at 10000 revolutions per minute for 20 minutes at 4°C, and the supernatant was collected. In a spectrophotometer sample cuvette, 1.5 mL of 0.05 M pyrogallol and 0.1 mL of the enzyme extract were combined, and the spectrophotometer was adjusted to read zero absorbance at 420 nanometers. To start the reaction, 0.1 mL of 1% H2O2 was added to the sample cuvette, and the changes in absorbance were recorded every 30 seconds. The peroxidase activity was expressed as changes in absorbance min− 1 g− 1 fresh weight of tissue following the method described by Hammerschmidt et al. 1982.
Polyphenol Oxidase
Polyphenol Oxidase (PPO) activity was measured using the method described by Mayer et al. in 1965. The reaction mixture consisted of 1.5 mL of 0.1 M sodium phosphate buffer (pH 6.5) and 200 µL of the enzyme extract. The reaction was initiated by adding 200 µL of 0.01 M catechol, and the absorbance changes were recorded at 495 nm at 30-second intervals for 3 minutes duration. The activity of PPO was calculated as the changes in absorbance min− 1 g− 1 fresh tissue.
Catalase
The measurement of Catalase (CAT) activity followed the procedure established by Chance and Maehly in 1955. In a spectrophotometric cuvette, 1.9 mL of 50 mM sodium phosphate buffer (pH 7.5) and 0.1 mL of enzyme extract were mixed. The reaction was initiated by adding 1 mL of 39 mM H2O2, and the utilization of H2O2 was recorded at 30 second intervals for 3 minutes by measuring the decrease in absorbance at 240 nm. CAT activity was expressed as µmol of H2O2 decomposed min− 1g− 1fresh weight. The extinction coefficient for H2O2 has the value of 0.0394 mM− 1 cm− 1.
The data obtained from field experiments were statistically analyzed in a randomized block design while that obtained from laboratory experiments were analyzed in a completely randomized block design. The data of different parameters recorded were presented as mean ± SE. All treatments were replicated thrice and were subjected to analysis of variance (ANOVA), Pearson’s correlation, multiple regression and means were compared with Turkey’s HSD test at 5% to identify the key plant characters influencing the leaffolder damage and its development using IBM SPSS version 22. Multivariate statistical technique, Principal component analysis (PCA) was performed using Grapes 1.1.0 to identify the morphological and biochemical factors that contribute to the most variance in the set of measured variables. The principal component scores were analyzed to understand the underlying relationships in the data. Variables that have high absolute values on a particular principal component contribute the most to the variance explained by that component.
Out of thirty-five genotypes selected for morphobiochemical studies 16 were resistant, 14 moderately resistant and 5 were of susceptible to rice leaffolder based on their phenotypic screening performed and evaluated as per standard evaluation system of IRRI (IRRI 2014). To know the morphobiochemical factors associated with resistance and susceptibility status resistant check TKM6 and Susceptible check TN1 was also considered for the study.
Morphological plant characters governing resistance to rice leaffolder
The mean plant height of genotypes in the resistant category ranged from 149.37 cm to 134.13 cm, showing higher values compared to the moderately resistant category (116 cm to 134.93 cm) and the susceptible category (96.73 cm to 110.57 cm). The resistant check variety, TKM6, recorded a plant height of 136 cm, while the susceptible check variety, TN1, had a plant height of 103 cm. In terms of leaf length, the resistant category genotypes displayed lengths ranging from 55.80 cm to 75.27 cm, followed by the moderately resistant category with lengths of 54.23 cm to 59.50 cm. The susceptible category had leaf lengths ranging from 42.40 cm to 48.8 cm. The resistant check, TKM6, recorded a leaf length of 63.07 cm, while the susceptible check, TN1, had a leaf length of 36.60 cm. The leaf blade widths of genotypes in the resistant category varied from 0.6 cm to 0.9 cm, with the standard resistant check, TKM6, measuring 0.9 cm. In the moderately resistant category, the genotypes had leaf blade widths ranging from 0.9 cm to 1.1 cm. On the other hand, the susceptible category genotypes displayed leaf blade widths of 1.1 cm to 1.3 cm, consistent with the leaf blade width of the standard susceptible check, TN1, which measured 1.1 cm. (Table 1).
| Sl. No. | Genotype | Reaction | Plant height a (cm) | Leaf length a (cm) | Leaf width a (cm) |
| 1 | Benabahar | R | 134.97l | 64.53de | 0.9de |
| 2 | Kalajeera (I) | R | 137.70i | 55.80o | 0.8ef |
| 3 | Basudha | R | 149.37a | 75.47a | 0.9de |
| 4 | BayaBhanda | R | 141.53f | 63.80f | 0.9de |
| 5 | Bhalunki | R | 140.83g | 63.03h | 0.8ef |
| 6 | Bhatta | R | 147.80b | 68.27b | 0.6g |
| 7 | Manipuri(black) | R | 136.87j | 75.27a | 0.8ef |
| 8 | Mahasuri | R | 135.00l | 60.27j | 0.9de |
| 9 | Jangalijata | R | 137.07j | 59.80k | 0.6g |
| 10 | Pahadiabanki | R | 137.03j | 63.70fg | 0.8ef |
| 11 | Kalakusuma | R | 141.67f | 65.37c | 0.9de |
| 12 | Kaliasaru | R | 144.73d | 64.63d | 0.9de |
| 13 | Kanhav | R | 145.90c | 61.57i | 0.7fg |
| 14 | Kansapurimajhijhuli | R | 139.67h | 63.90ef | 0.7fg |
| 15 | Menaka | R | 146.20c | 63.63fgh | 0.7fg |
| 16 | Mogra | R | 134.13m | 59.33k | 0.9de |
| 17 | Nagara | R | 145.00d | 61.50i | 0.9de |
| 18 | Padmakesari | R | 143.23e | 59.93jk | 0.8ef |
| 19 | Radhajugal | R | 135.90k | 61.27i | 0.8ef |
| 20 | Agnisar | MR | 124.57o | 57.23n | 1.0cd |
| 21 | Ankul | MR | 134.93l | 58.10lm | 0.9de |
| 22 | Chinamali-k | MR | 119.80q | 58.50l | 1.1bc |
| 23 | Maguramanji | MR | 116.00s | 58.60l | 1.0cd |
| 24 | Maharaji | MR | 124.47o | 57.00n | 1.1bc |
| 25 | Mahipal-B | MR | 128.90n | 59.50k | 1.0cd |
| 26 | Majhalijhuli | MR | 117.90r | 57.60mn | 1.0cd |
| 27 | Mayurkantha-k | MR | 119.33q | 55.40op | 1.0cd |
| 28 | Motahalkal | MR | 121.00p | 54.90p | 1.1bc |
| 29 | Nadalghanta | MR | 124.13o | 54.23q | 1.0cd |
| 30 | Kathidhan | S | 110.57t | 45.73t | 1.2ab |
| 31 | Nimei | S | 96.73z | 43.77u | 1.3a |
| 32 | Ganjamratnachudi | S | 104.10v | 47.37s | 1.2ab |
| 33 | N. umerchudi | S | 102.20x | 45.73t | 1.1bc |
| 34 | Safari | S | 100.90y | 42.40v | 1.2ab |
| 35 | Ramkrushnabilasha | S | 106.37u | 48.87r | 1.0cd |
| 36 | TKM6(RC) | 136.53j | 63.07gh | 0.9de | |
| 37 | TN1(SC) | 103.00w | 36.60w | 1.1bc | |
| CD(P<0> | 0.279 | 0.332 | 0.050 | ||
| SE(m)± | 0.099 | 0.117 | 0.018 | ||
| a Mean of three replications and of two consecutive seasons Kharif’ 2022 and Rabi’ 2022-23. In a column, Mean value followed by the same letters are not significantly different at P =0.05 as per Tukey’s HSD test. | |||||
Table 1: Polyphenol oxidase and catalase enzyme expression in response to damage by leaffolder in selected rice genotypes.
Biochemical constituents imparting resistance against leaffolder
There were significant variations in the plant biochemical constituents among the resistant, moderately resistant and susceptible genotypes. The phenol content was found to be higher in both uninsected and insected resistant categories compared to the other categories. In uninsected resistant genotypes, the phenol content ranged from 0.646 to 1.073 mg g-1, while in insected resistant genotypes, it ranged from 0.838 to 1.375 mg g-1. The resistant check variety (TKM6) exhibited a phenol content of 0.811 mg g-1 in uninsected plants, which increased to 1.077 mg g-1 after insect infestation. In contrast, the susceptible genotypes exhibited significantly lower phenol content. The uninsected susceptible genotypes had phenol levels ranging from 0.387 to 0.535 mg g-1 and the insected susceptible genotypes displayed phenol content between 0.437 and 0.614 mg g-1. The susceptible check variety (TN1) recorded a phenol content of 0.362 mg g-1 in uninsected plants, which marginally increased to 0.412 mg g-1 after infestation (Table 2). Overall, the phenol content increased in all categories of genotypes after leaffolder infestation. However, the increase was more pronounced in the resistant categories (22.95Percentage-43.60Percentage) compared to the moderately resistant (17.83Percentage-20.18Percentage) and susceptible categories (12.92Percentage-15.56Percentage).
The total soluble sugar content was observed to be higher in susceptible genotypes, both in uninsected and insected categories, with values ranging from 7.544 to 9.335 mg g-1 and 4.237 to 5.253 mg g-1, respectively. In contrast, the resistant genotypes exhibited significantly lower soluble sugar content in both uninsected (ranging from 2.752 to 4.131 mg g-1) and insected (ranging from 2.100 to 3.296 mg g-1) categories. Comparatively, the standard susceptible check, TN1, had higher soluble sugar content in both uninsected (8.502 mg g-1) and insected (5.343 mg g-1) conditions, while the resistant check, TKM6, had lower soluble sugar content in uninsected (3.420 mg g-1) and insected (2.701 mg g-1) conditions.
The soluble sugar content decreased in all rice genotypes after leaffolder infestation, with a more significant reduction observed in the susceptible category (38.99Percentage to 44.07Percentage) compared to the resistant types (11.82Percentage to 24.21Percentage) (Table 2).
Sl. no | Genotypes | Category | Total Phenol(mg g-1)a | IoU % | Total soluble sugar (mg g-1)a | DoU % | ||
| Uninsected | Insected | Uninsected | Insected | |||||
| 1 | Benabahar | R | 0.725±0.02ghi | 0.912±0.03hi | 25.79 | 3.828±12lmn | 3.087±02fghi | 19.36 |
| 2 | Kalajeera(I) | R | 0.715±0.02ghi | 0.889±0.01hi | 24.34 | 3.478±06nopq | 2.858±04ghij | 17.83 |
| 3 | Basudha | R | 0.750±0.01fghi | 1.077±0.02cdef | 43.60 | 2.899±05opq | 2.498±10ijkl | 13.83 |
| 4 | BayaBhanda | R | 0.906±0.02bcd | 1.119±0.02bcde | 23.51 | 3.961±12klmn | 3.127±03fgh | 21.06 |
| 5 | Bhalunki | R | 0.674±0.02hij | 0.838±0.01ij | 24.33 | 3.817±06lmn | 2.940±02fghij | 23.00 |
| 6 | Bhatta | R | 0.867±0.01bcde | 1.175±0.01b | 35.41 | 2.847±06pq | 2.426±08jkl | 14.79 |
| 7 | Manipuri(black) | R | 0.783±0.01efgh | 0.961±0.03gh | 22.73 | 3.418±21nopq | 2.750±05hijk | 19.54 |
| 8 | Mahasuri | R | 0.762±0.02efgh | 0.955±0.01gh | 25.33 | 3.567±06mnop | 2.961±03fghij | 17.02 |
| 9 | Jangalijata | R | 0.822±0.01cdefg | 1.053±0.01def | 28.10 | 3.76±12lmn | 3.03±08fghij | 19.48 |
| 10 | Pahadiabanki | R | 0.813±0.02defg | 1.005±0.02fg | 23.77 | 3.701±16mno | 2.843±04ghij | 23.18 |
| 11 | Kalakusuma | R | 0.822±0.03cdefg | 1.127±0.02bcd | 37.10 | 2.834±04pq | 2.499±09ijkl | 11.82 |
| 12 | Kaliasaru | R | 0.646±0.01ijk | 0.848±0.02ij | 31.27 | 3.771±12lmn | 2.923±03fghij | 22.47 |
| 13 | Kanhav | R | 0.847±0.02bcdef | 1.088±0.01bcdef | 28.45 | 3.424±01nopq | 2.706±03hijk | 20.97 |
| 14 | Kansapurimajhijhuli | R | 0.792±0.01efg | 1.031±0.02efg | 30.18 | 3.955±19klmn | 3.004±07fghij | 24.05 |
| 15 | Menaka | R | 0.861±0.02bcde | 1.091±0.01bcdef | 26.71 | 3.583±05mnop | 2.862±06ghij | 20.12 |
| 16 | Mogra | R | 1.073±0.01a | 1.375±0.02a | 28.15 | 4.131±20jklmn | 3.130±04fgh | 24.21 |
| 17 | Nagara | R | 0.928±0.03bc | 1.148±0.01bc | 23.71 | 4.131±21jklmn | 3.296±04fgh | 20.21 |
| 18 | Padmakesari | R | 0.937±0.01b | 1.152±0.01bc | 22.95 | 2.753±05q | 2.235±04kl | 18.78 |
| 19 | Radhajugal | R | 0.682±0.02hij | 0.908±0.01hi | 33.14 | 2.752±18q | 2.100±15l | 23.73 |
| 20 | Agnisar | MR | 0.554±0.01klm | 0.665±0.01lmn | 20.04 | 4.333±06jklm | 3.159±01fgh | 27.09 |
| 21 | Ankul | MR | 0.579±0.03jkl | 0.691±0.01klm | 19.34 | 4.561±13jkl | 3.426±02efg | 24.88 |
| 22 | Chinamali-k | MR | 0.646±0.01ijk | 0.760±0.01jk | 17.83 | 4.747±11ijk | 3.286±13fgh | 30.80 |
| 23 | Maguramanji | MR | 0.545±0.02klmn | 0.655±0.01lmn | 20.18 | 4.652±12jk | 3.303±10fgh | 29.02 |
| 24 | Maharaji | MR | 0.587±0.03jkl | 0.693±0.02klm | 18.06 | 5.572±29gh | 3.931±07de | 29.45 |
| 25 | Mahipal-B | MR | 0.558±0.02klm | 0.668±0.01lmn | 19.71 | 4.805±03hij | 3.500±07ef | 27.16 |
| 26 | Majhalijhuli | MR | 0.453±0.02mnop | 0.546±0.02opq | 20.53 | 6.326±16fg | 4.396±11cd | 30.51 |
| 27 | Mayurkantha-k | MR | 0.604±0.01jkl | 0.720±0.02kl | 19.21 | 5.550±19ghi | 4.024±04de | 27.50 |
| 28 | Motahalkal | MR | 0.588±0.02jkl | 0.703±0.02klm | 19.56 | 6.220±02fg | 3.928±03de | 36.85 |
| 29 | Nadalghanta | MR | 0.578±0.01jkl | 0.685±0.02klmn | 18.51 | 6.948±11ef | 4.153±07d | 40.23 |
| 30 | Kathidhan | S | 0.387±0.03p | 0.437±0.02rs | 12.92 | 8.234±15cd | 4.884±23abc | 40.68 |
| 31 | Nimei | S | 0.535±0.01lmn | 0.614±0.02mno | 14.77 | 9.335±21a | 5.253±10a | 43.74 |
| 32 | Ganjamratnachudi | S | 0.420±0.01op | 0.479±0.01qrs | 14.05 | 8.214±16cd | 5.011±28ab | 38.99 |
| 33 | N.umerchudi | S | 0.450±0.03mnop | 0.506±0.01pqr | 12.44 | 9.261±24ab | 5.253±13a | 43.28 |
| 34 | Safari | S | 0.438±0.01nop | 0.497±0.01qrs | 13.47 | 7.544±09de | 4.237±06d | 43.84 |
| 35 | Ramkrushna bilasha | S | 0.514±0.02lmno | 0.594±0.01nop | 15.56 | 8.051±15cd | 4.503±33bcd | 44.07 |
| 36 | TKM6(RC) | 0.811±0.01defg | 1.077±0.04cdef | 32.80 | 3.420±14nopq | 2.701±09hijkl | 21.05 | |
| 37 | TN1(SC) | 0.362±0.01p | 0.412±0.01s | 13.81 | 8.502±22bc | 5.343±08a | 37.16 | |
| CD(P=0.05) | 0.055 | 0.045 | 0.402 | 0.301 | ||||
| SE(m±) | 0.019 | 0.016 | 0.142 | 0.107 | ||||
| aMean of three replications and of two consecutive seasons Kharif’ 2022 and Rabi’ 2022-23. In a column, Mean±SE followed by the same letters are not significantly different at P =0.001 as per Tukey’s HSD test. IOUPercentage- Percentage Increase over uninsected; DOUPercentage- Percentage Decrease over uninsected. | ||||||||
Table 2: Total phenol and soluble sugar expression in response to damage by leaffolder in selected rice genotypes.
The soluble protein content, estimated from the leaves of all genotypes, showed higher levels in both uninsected and insected susceptible genotypes, ranging from 6.501 to 8.682 mg g-1 and 4.871 to 6.773 mg g-1, respectively. In comparison, the uninsected resistant genotypes had soluble protein content ranging from 2.232 to 3.615 mg g-1, while the insected resistant genotypes showed levels between 2.133 and 3.092 mg g-1. In all rice genotypes, there was a decrease in soluble protein content due to leaffolder infestation where a more significant decrease observed in the susceptible genotypes (20.74Percentage- 30.46Percentage), after infestation, while a smaller decrease was observed in the resistant category genotypes (3.61Percentage - 26.42Percentage) (Table 3).
Sl. no | Genotypes | Category | Soluble Protein (mg g-1) a | DoU % | Peroxidase (min-1g-1fw)b | IoU % | ||
| Uninsected | Insected | Uninsected | Insected | |||||
| 1 | Benabahar | R | 2.398±0.05nop | 2.186±0.04qr | 8.84 | 0.715±0.03bcdef | 0.910±0.05cde | 27.27 |
| 2 | Kalajeera (I) | R | 3.188±0.08ghijk | 2.877±0.08lmnop | 9.76 | 0.516±0.04cdefgh | 0.767±0.05defgh | 48.64 |
| 3 | Basudha | R | 2.567±0.08lmnop | 2.467±0.04pqr | 3.90 | 0.700±0.06bcdef | 1.096±0.05bc | 56.57 |
| 4 | BayaBhanda | R | 3.453±0.07ghi | 3.285±0.06ijklm | 4.87 | 0.646±0.13bcdefgh | 0.964±0.02cde | 49.23 |
| 5 | Bhalunki | R | 3.427±0.08ghi | 2.744±0.04mnopq | 19.93 | 0.598±0.03bcdefgh | 0.738±0.06efgh | 23.41 |
| 6 | Bhatta | R | 2.435±0.01mnop | 2.225±0.05qr | 8.62 | 1.187±0.10a | 1.478±0.05a | 24.52 |
| 7 | Manipuri(black) | R | 3.547±0.08g | 2.897±0.04lmnop | 18.33 | 0.512±0.03cdefgh | 0.702±0.03efghij | 37.11 |
| 8 | Mahasuri | R | 3.290±0.09ghij | 3.052±0.07klmno | 7.23 | 0.620±0.08bcdefgh | 0.834±0.07cdefh | 34.52 |
| 9 | Jangalijata | R | 2.383±0.16nop | 2.297±0.16qr | 3.61 | 0.757±0.07abcd | 0.848±0.13cdef | 12.02 |
| 10 | Pahadiabanki | R | 3.005±0.09hijkl | 2.741±0.06mnopq | 8.79 | 0.692±0.02bcdefg | 1.037±0.01cd | 49.86 |
| 11 | Kalakusuma | R | 2.320±0.04op | 2.169±0.03r | 6.51 | 0.987±0.15ab | 1.480±0.16a | 49.95 |
| 12 | Kaliasaru | R | 2.899±0.04jklmn | 2.133±0.02r | 26.42 | 0.561±0.01bcdefgh | 0.713±0.01efghi | 27.09 |
| 13 | Kanhav | R | 2.604±0.18lmnop | 2.493±0.17opqr | 4.26 | 0.491±0.01cdefgh | 0.909±0.06cde | 85.13 |
| 14 | Kansapurimajhijhuli | R | 2.246±0.04p | 2.098±0.19r | 6.59 | 0.320±0.01defgh | 0.565±0.03ghijkl | 76.56 |
| 15 | Menaka | R | 2.696±0.02klmnop | 2.519±0.09opqr | 6.57 | 0.537±0.01cdefgh | 0.797±0.02defg | 48.42 |
| 16 | Mogra | R | 3.615±0.11g | 3.415±0.04hijkl | 5.56 | 0.641±0.02bcdefgh | 0.814±0.01defg | 26.99 |
| 17 | Nagara | R | 2.753±0.01klmnop | 2.451±0.07pqr | 10.97 | 0.432±0.01cdefgh | 0.613±0.01fghijk | 41.90 |
| 18 | Padmakesari | R | 3.510±0.15gh | 3.092±0.11jklmn | 11.91 | 0.415±0.01cdefgh | 0.505±0.01hijklm | 21.69 |
| 19 | Radhajugal | R | 2.948±0.16ijklm | 2.598±0.08nopqr | 11.87 | 0.746±0.01bcde | 1.397±0.03a | 87.27 |
| 20 | Agnisar | MR | 4.449±0.01ef | 3.690±0.02fghi | 17.06 | 0.320±0.01defgh | 0.410±0.04klm | 28.13 |
| 21 | Ankul | MR | 4.199±0.01f | 3.688±0.10fghi | 12.17 | 0.322±0.01defgh | 0.421±0.04klm | 30.75 |
| 22 | Chinamali-k | MR | 4.578±0.01ef | 3.889±0.04efgh | 15.05 | 0.236±0.01h | 0.405±0.02klm | 72.34 |
| 23 | Maguramanji | MR | 4.553±0.05ef | 3.855±0.06efgh | 15.31 | 0.315±0.01efgh | 0.432±0.02jklm | 37.14 |
| 24 | Maharaji | MR | 4.483±0.06ef | 4.226±0.05ef | 5.71 | 0.211±0.01h | 0.400±0.01klm | 89.57 |
| 25 | Mahipal-B | MR | 4.391±0.03ef | 4.079±0.07efg | 7.08 | 0.324±0.01defgh | 0.441±0.01ijklm | 36.11 |
| 26 | Majhalijhuli | MR | 4.304±0.01ef | 3.624±0.12ghij | 15.80 | 0.324±0.01defgh | 0.397±0.01klm | 22.53 |
| 27 | Mayurkantha-k | MR | 3.648±0.12g | 3.468±0.14hijk | 4.93 | 0.295±0.01fgh | 0.397±0.01klm | 34.58 |
| 28 | Motahalkal | MR | 4.685±0.08ef | 4.263±0.03e | 9.01 | 0.386±0.02cdefgh | 0.443±0.01ijklm | 14.77 |
| 29 | Nadalghanta | MR | 4.799±0.03e | 4.147±0.04efg | 13.59 | 0.341±0.01defgh | 0.434±0.01jklm | 27.27 |
| 30 | Kathidhan | S | 6.573±0.04cd | 4.871±0.10d | 25.89 | 0.244±0.01h | 0.313±0.01lm | 28.28 |
| 31 | Nimei | S | 7.407±0.09b | 5.268±0.21cd | 28.89 | 0.256±0.01gh | 0.306±0.01lm | 19.53 |
| 32 | Ganjamratnachudi | S | 6.501±0.04d | 4.891±0.18d | 24.78 | 0.249±0.02h | 0.284±0.02m | 14.06 |
| 33 | N.umerchudi | S | 8.545±0.04a | 6.773±0.14a | 20.74 | 0.332±0.01defgh | 0.406±0.01klm | 22.29 |
| 34 | Safari | S | 8.682±0.03a | 6.107±0.05b | 29.66 | 0.308±0.01efgh | 0.400±0.02klm | 29.87 |
| 35 | Ramkrushna bilasha | S | 7.020±0.07bc | 4.882±0.02d | 30.46 | 0.332±0.01defgh | 0.401±0.01klm | 20.78 |
| 36 | TKM6(RC) | 2.827±0.17jklmno | 2.629±0.05nopqr | 7.00 | 0.789±0.04abc | 1.365±0.07ab | 73.13 | |
| 37 | TN1(SC) | 7.295±0.16b | 5.508±0.20c | 24.50 | 0.344±0.01defgh | 0.382±0.01klm | 11.05 | |
| CD(P=0.05) | 0.257 | 0.282 | 0.126 | 0.136 | ||||
| SE(m± | 0.09 | 0.10 | 0.05 | 0.05 | ||||
| aMean of three replications and of two consecutive seasons Kharif’ 2022 and Rabi’ 2022-23. In a column, Mean±SE followed by the same letters are not significantly different at P =0.001 as per Tukey’s HSD test. b Mean of three replications.In a column, Mean±SE followed by the same letters are not significantly different at P =0.05 as per Tukey’s HSD test. IOU%- % Increase over uninsected; DOUPercentage- Percentage Decrease over uninsected. | ||||||||
Table 3: Soluble protein and peroxidase enzyme expression in response to damage by leaffolder in selected rice genotypes.
Peroxidase
The peroxidase enzyme activity increased in all tested genotypes across different categories as a result of leaffolder infestation (Table 3). Resistant genotypes exhibited higher peroxidase activity compared to moderately resistant and susceptible genotypes. Among the tested genotypes, the uninsected resistant genotypes displayed higher peroxidase activity, ranging from 0.320 to 1.187 min-1g-1fw, which further increased after leaffolder infestation to a range of 0.505 to 1.478 min-1g-1fw. Lower enzyme activity was observed in uninsected susceptible category genotypes, ranging from 0.244 to 0.332 min-1g-1fw. After infestation with leaffolder larvae, the enzyme activity in the resistant category more increased (12.02% to 87.27%) where as in the susceptible category it is slightly increased (11.05% to 29.87%). Among the standards, the uninsected resistant check (TKM6) displayed higher (73.13%) peroxidase enzyme activity of 0.789 min-1g-1fw, which increased to 1.365 min-1g-1fw after infestation with leaffolder. While in the susceptible check (TN1) recorded 0.344 min-1g-1fw in healthy plants, which increased to 0.382 min-1g-1fw after insect infestation showing only 11.05% increase.
Polyphenol oxidase
The polyphenol oxidase enzyme activity was found increasing in all experimental genotypes across different categories after leaffolder infestation (Table 4). Resistant genotypes exhibited higher (48.75% to 269.60%) polyphenol oxidase activity compared to moderately resistant (21.31% to 195.50%) and susceptible genotypes (60.00% to 146.20%). Among the studied genotypes, the uninsected resistant category showed a range of polyphenol oxidase enzyme activity from 0.700 min-1g-1fw to 2.667 min-1g-1fw, which increased after leaffolder infestation to a range of 2.333 min-1g-1fw to 3.967 min-1g-1fw. Lower enzyme activity was found in the uninsected susceptible category genotypes, ranging from 0.433 min-1g-1fw to 0.867 min-1g-1fw, which increased to a range from 0.867 min-1g-1fw to 1.567 min-1g-1fw after infestation. Among the standard checks, the uninsected resistant check (TKM6) recorded higher polyphenol oxidase enzyme activity of 1.333 min-1g-1fw in healthy plants, which further increased to 2.900 min-1g-1fw after leaffolder infestation. On the other hand, the susceptible check variety (TN1) exhibited lower enzyme activity of 0.667 min-1g-1fw in healthy plants, which marginally increased to 1.267 min-1g-1 fw after insect infestation.
Catalase
The catalase enzyme activity was found to be higher in uninsected resistant category genotypes, ranging from 0.659 min-1g-1fw to 1.115 min-1g-1fw, which increased (9.09% to 46.15%) further to a range of 0.963 min-1g-1fw to 1.419 min-1g-1fw after leaffolder infestation. While in susceptible genotypes, a lower level of catalase activity was observed. In susceptible healthy uninsected genotypes, the catalase activity ranged between 0.405 min-1g-1fw and 0.659 min-1g-1fw, whereas after insect infestation, a marginal increase (7.69% to 22.47%) in enzyme activity was observed (0.496-0.760 min-1g-1fw). The resistant check, TKM6 also exhibited higher enzyme activity, with levels increasing from 0.745 min-1g-1 fw to 1.013 min-1g-1fw after insect infestation. Similarly, in the susceptible check, TN1 the enzyme activity marginally increased from 0.456 min-1g-1fw to 0.507 min-1g-1fw after leaffolder infestation (Table 4).
Principal component analysis
Principal component analysis (PCA) was employed to reduce the complexity of the dataset while retaining as much variation as possible. The PCA yielded 10 principal components, which together explained 100% of the cumulative variance (Table 5). The first principal component accounted for 79.10% of the total variation (Table 5, Figure 2).
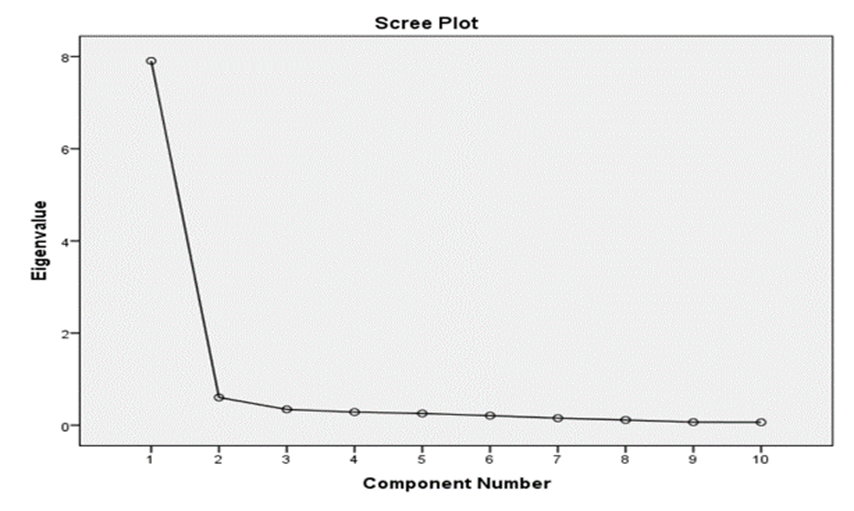
Figure 2: The scree plot showing the PC1 accounted for 79.07% of total variation in the data with eigen value of 7.907.
The analysis of factor loadings in PC1 revealed that morphological and biochemical factors related to leaffolder resistance exhibited significant positive and negative loadings (Table 6). The morphological factors like plant height (PH), leaf length (LL) scored a factor loading of 0.344 and 0.322, respectively. Similarly biochemical factors such as, catalase (CAT), polyphone oxidase (PPO) and peroxidise (PO) scored positive factor loading of 0.329, 0.300 and 0.270 on PC1, respectively. The leaf width (LW), total soluble protein (TSP) and total soluble sugar (TSS) scored negative factor loading of -0.310, -0.333 and -0.335, respectively on PC1.
The second PC (PC2) was only accounted for 6.0 % of total variation and was mostly due to peroxidase (PO) score a highest factor loading of 0.753. A biplot was drawn based on first two PCs based on egien values (Figure 3).

Figure 3: PCA biplot depicting the association of morpho-biochemical factors and leaffolder resistance. The abbreviation used: Peroxidase (PO), Polyphenol oxidase (PPO), Catalase (CAT), Total soluble sugar (TSS), Total soluble protein (TSP), Plant height (PH), Leaf length (LL) and Leaf width (LW). A vector line is draw from the origin to the trait position on the plane. Longer the vector depicts the more variation explained by the particular trait. The Biplot depicted the longer vector of peroxidase, followed by polyphenol oxidase, as they consisted for larger proportion to the resistance against leaffolder.
Table 5. Computed Eigen values of different principal components with cumulative variance %
| Principal component | Eigen value | Percentage of variance | Cumulative percentage of variance |
| PC1 | 7.907 | 79.067 | 79.067 |
| PC2 | 0.603 | 6.034 | 85.101 |
| PC3 | 0.344 | 3.435 | 88.536 |
| PC4 | 0.285 | 2.849 | 91.384 |
| PC5 | 0.255 | 2.553 | 93.938 |
| PC6 | 0.208 | 2.082 | 96.019 |
| PC7 | 0.153 | 1.534 | 97.553 |
| PC8 | 0.114 | 1.141 | 98.694 |
| PC9 | 0.067 | 0.668 | 99.362 |
| PC10 | 0.064 | 0.638 | 100 |
Table 5:
Resistance or susceptibility of plants to insects is a complex interaction between them where insect infestation triggers many plants’ reaction. Plant resistance to insect pest is often multifactorials involving factors like morphological, biochemical and genetical mechanisms. In rice, several studies have reported both morphological and biochemical mechanisms underlying the resistance to rice leaf folder (Khan et al. 1989; Ramachandran & Khan 1991; Dakshayani et al. 1993; Xu et al. 2010; Punithavalli et al. 2014). Among the plant characteristics, plant height, leaf length and leaf width offer first line of defence against leaffolder. In the present study, the plant height (r= -0.903, p < 0.001) and leaf length (r= -862, p < 0.001) was negatively correlated while leaf width (r = 0.773, p < 0.001) was positively correlated with leaffolder damage (Fig. 1).

Figure 1: Correlogram showing correlation between various plant morphological characters and leaffolder damage (Correlation is significant at 0.001 level), ADAR: Adjusted damaged area rating.
Several studies are also in corroboration with these findings (Punithavalli et al. 2011; Kumar et al. 2021). The mechanism of resistance observed in this case may be antixenosis, which refers to the inability of larvae to create folds and feed inside the leaf due to unsuitable leaf morphology. In other words, the plant's morphological characteristics make it difficult for the larvae of C. medinalis to find suitable feeding sites, preventing them from causing damage (Hanifa and Subramanian 1973). Previously, it was found that leaf length did not have a significant effect on the infestation of leaf folders, while leaf width showed a significant positive association with the percentage of damage (Chalapathi Rao et al. 2002, Chintalapati et al. 2019 and Xu et al. 2010). This indicates that the width of the leaves plays a more influential role in determining susceptibility to infestation by leaf folders compared to leaf length. Sarao et al. (2013) observed a significant positive relationship between the width of the flag leaf and infestation by leaffolder. This further supports the notion that wider leaves may facilitate higher levels of infestation.
Plants have evolved sophisticated defence mechanisms to protect themselves against attacking insects and other pests. Insect feeding can cause significant changes in the biochemical and enzymatic profile of rice plants, which may be related to the plants' ability to resist insect damage. The present study was also intended to investigate the differential reactions observed between susceptible and resistant genotypes due to herbivory. By evaluating and comparing these biochemical components between susceptible and resistant genotypes key differences that contribute to the variation in their response to stress were identified.
The increase in phenolic compounds in response to insect attack is a common and well-documented defence mechanism in plants in response to insect attack (Karban and Baldwin 1997). Our findings align with this knowledge, as we observed higher levels of phenols in infested resistant and moderately resistant rice genotypes, as well as the resistant check (TKM6), compared to susceptible genotypes and the susceptible check (TN1). Correlation studies (Figure. 4, 5)
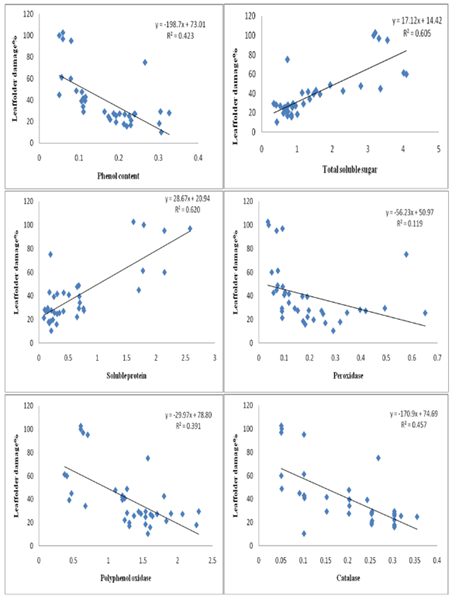
Figure 4: Correlation between plant biochemical constituents and antioxidative enzymes with leaffolder damage.
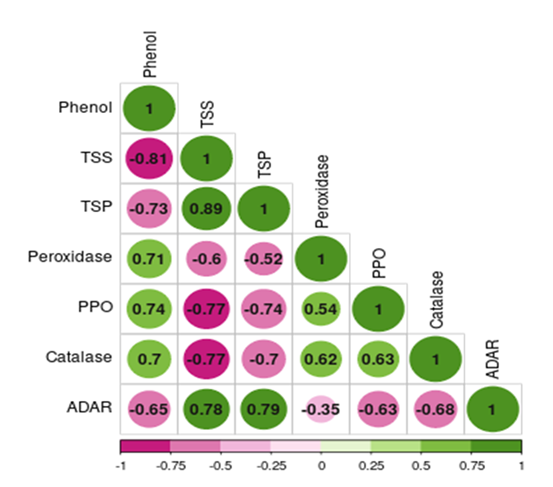
Figure 5: Correlogram showing correlation between plant biochemical constituents and antioxidative enzymes with leaffolder damage (Correlation is significant at P< 0>
Demonstrated a significant negative correlation between leaffolder damage and total phenol levels (r= -0.651, p < 0.001), suggesting that the increase in phenols may contribute to the resistance mechanism by acting as a deterrent and reducing leaf damage. Phenolic compounds play various roles in plant defense, including acting as deterrents, toxins, and interfering with herbivore digestion and development (Bhonwong et al. 2009; Sharma et al. 2009; Usha Rani and Jyothsna 2010). The elevated levels of phenols observed in resistant genotypes and TKM6 indicate an enhanced activation of defense mechanisms in response to insect infestation. Haukioja and Niemela (1977) also observed changes in phenol content in rice plants in response to insect feeding, suggesting that insects trigger the production of phenolic compounds as a defense response. The increased phenol content negatively affects larvae, indicating that phenolic compounds play a role in deterring or inhibiting insect feeding. Similarly, Hori (1973) found that feeding by Lygus bugs on sugar beets resulted in increased quinones derived from phenolic compounds.The presence of quinones derived from phenolic compounds has been shown to deter feeding by herbivorous bugs, highlighting the defensive role of phenolic compounds. Previous research has demonstrated that phenolic compounds not only play a defensive role against leaffolders but also against other insect pests such as the white-backed planthopper, thrips, brown planthopper, rice gall midge, and stem borer (Rath and Mishra 1998; Thayumanavan et al. 1990; Mohan et al. 1988; Grayer et al. 1994). These studies have consistently shown a negative association between high phenol content in rice and the incidence of these insect pests, further supporting the protective function of phenolic compounds. The total soluble sugar content was recorded higher in healthy susceptible genotypes as compared to resistant and moderately resistant types. A significant decrease in total soluble sugar content was noticed after leaffolder infestation as compared to healthy plants. The correlation studies (Fig. 4, 5) indicated that there was a significant and positive correlation between the total soluble sugar and leaffolder damage (r = 0.778, p < 0.001). This phenomenon was earlier reported by Watanabe and Kitagawa (2000) who highlighted decrease in carbohydrate content after infestation of the plant hopper, N. lugens, in rice where the infestation can have negative effects on photosynthesis and alteration in translocation might be the cause. Similar findings have been reported in barley, mustard and sugar beet plants infested with different aphid species. (Capinera 1981; Singh et al. 2011). The decrease in total soluble sugar content in infested plants is related to the fact that the primary metabolites, specifically carbohydrates like soluble sugar, are essential for the growth and development of herbivores. By reducing the availability of soluble sugar, the plant may become less attractive to herbivores, thereby deterring further feeding and reducing the damage, which act as a defense mechanism for self-protection (Ananthakrishnan 1990; Usha Rani and Jyothsna 2010).
In the present study we further found that resistant genotypes had lower protein content compared to susceptible genotypes. Additionally, the insected lines had a significant reduction in soluble protein compared to their healthy counterparts. Further, the biochemical analysis of the protein and infestation of the leaf folder showed the significant positive correlation(r = 0.788, p < 0.001) (Fig. 4,5). Similar results were obtained by Punithavalli et al. (2013) showed that the higher amount of soluble protein observed in TN1 (5.77 mg/g) was most susceptible variety and lower amount of soluble protein recorded in TKM6 (1.33 mg/g) was found resistant to leaf folder. Higher amount of crude protein was recorded in susceptible and highly susceptible cultivars as compared to resistant and highly resistant genotypes in rice against leaffolder (Kumar et al. 2021) and gall midge (Vijay Kumar et al. 2009). The current study's findings assumed that protein content might influence resistance in rice plants similarly to soluble sugar, where primary metabolites such as protein may also be herbivore-attractive. Similar results have also been reported in other pests of rice crop. Raghumoorthy and Gunathilagaraj (1988) reported that resistant rice varieties (CO1, CO24, and CO32) to the angoumois grain moth, Sitotroga cereallela, had a lower amount of total seed proteins. Edwards and Wratten (1983) observed a decrease in protein content due to insect attack. Infestation by Nilaparvata lugens in rice resulted in an increase in free amino acids and a decrease in soluble protein (Sowaga et al. 1971). The concrete reason for decreasing in soluble protein content was unknown. However, the decrease in nutrient content, including soluble protein, might lead to several changes in plants. These changes may make the plants less palatable for insects and also affect their development (Usharani and Jyotsna 2010).
The present study demonstrated that resistant genotypes showed higher activities of antioxidant enzymes, like peroxidase, compared to susceptible genotypes pre and post leaffolder infestation. There was a significant and negative correlation found between peroxidase and leaffolder damage (r= -0.345, p < 0.05) (Fig. 4, 5). These findings align with the observations made by Sinha et al. 2005; Punithavalli et al. 2013). Peroxidase is known to play a crucial role in various plant processes, including the regulation of cell elongation, phenol oxidation, polysaccharide crosslinking, cross-linking of extension monomers, oxidation of hydroxyl-cinnamyl alcohols into free radical intermediates, cell wall building process (Chittor et al. 1999) and wound healing (Edwards and Wratten, 1983). The early and increased expression of peroxidase, which is involved in biochemical reactions necessary for lignifications, can provide protection to plants against C. medinalis (leaffolder) infection in rice (Punithavalli et al. 2013). Hori and Atalay (1980) reported a significant seven-fold increase in peroxidase activity that continued for 21 days after insect injury. The increase in peroxidase activity is also involved the polymerization of p-coumaryl and coniferyl alcohol, leading to the formation of lignin which would be considered as anti-nutritive because they cannot be effectively digested and assimilated by insects (Constabel 1999).
Polyphenol oxidase (PPO) enzyme activity was found higher in resistant genotypes as compared to susceptible genotypes before and after leaffolder infestation. Further there was a significant and negative correlation (r= -625, p < 0.001) of PPO with leaffolder damage (Fig. 4, 5). There are several studies which indicated that PPO plays a role in defence against pests and pathogens. Polyphenol oxidase is a copper-containing enzyme found in plants (Vanitha et al. 2009). The antinutritive effect of PPO on noctuid herbivores, which may be raised to high levels in response to pest attack and such induction occurs in combination with other defence proteins in tomato plants, was described by Felton et al. (1989). A reduction in the nutritional value, digestibility, and palatability of the plant tissues to insects is correlated with higher levels of PPO. This helps the plant to resist herbivory and renders it less attractive to pests as a food source. Similarly, Rani and Pratyusha (2013) reported increased PPO levels in cotton plants infested with Spodoptera litura, likely due to the reduced nutritional quality of the plants and increased indigestibility for insects. Similarly, He et al. (2011) found that aphid herbivory enhanced PPO activity in three chrysanthemum cultivars.The production of quinones through the catalytic oxidation of phenolic compounds by PPO is considered as another significant defensive response against herbivory. Quinones are toxic compounds that can inhibit feeding by pests, further contributing to plant defence (Bhonwong et al. 2009).
The higher catalase enzyme activity was observed in resistant and moderately resistant genotypes than susceptible types in both healthy and infested plants. The correlation analysis (Fig. 4, 5) revealed a significant and negative association between catalase activity (r=-0.676, p < 0.001) and leaffolder damage. The present study suggested that an increase in catalase activity, in response to biotic stress, serves as a local signal to activate defense genes and enhance cell wall resistance in plants (Chen et al., 2009). Bi and Felton (1995) conducted research on Helicoverpa zea (corn earworm) feeding on soybean plants observed similar results. Catalase enzyme having role in breakdown of hydrogen peroxide (H2O2) into water (H2O) and molecular oxygen (O2). H2O2 is a type of ROS that can be toxic to cells at high concentrations. By converting H2O2 into water and oxygen, catalase helps to reduce the levels of reactive oxygen species (ROS) and prevent oxidative damage to cellular components, including proteins, lipids, and DNA (Sharma et al. 2012). In addition to its detoxification function, H2O2, the substrate for catalase, can also act as a signaling molecule involved in various physiological processes, including defense responses. Catalase-mediated breakdown of H2O2 can regulate the balance of signaling molecules, influencing the activation of defense genes and the modulation of plant defence mechanisms (Ali et al. 2020).
The principal component analysis showed that the factors like plant height, leaf length, CAT, PPO and PO were contributed to resistance depicting a positive factor loading on PC1. These factors were found closely related with each other and forming an obtuse angle with ADAR showing a negative association. While, the leaf width (LW), total soluble sugar (TSS) and total soluble protein (TSP) were in the same of direction with that of ADAR and forming an acute angle with ADAR indicating a positive association (Muduli et al. 2023). The PCA biplot analysis found interesting information regarding the relationship between rice genotypes and leaffolder resistance (Fig. 3). When looking at the PCA biplot, the resistant genotypes with higher plant height, leaf length, and elevated phenol and antioxidant enzyme levels were primarily located in quadrants II and IV. These genotypes exhibited extreme values for the factors contributing to resistance in this study. The moderately resistant genotypes were clustered in quadrant III, while the susceptible genotypes (excluding Kathidhan) and the standard susceptible check TN1 were grouped in quadrant I.
Morphological factors, which are inherent plant characteristics, play a role in determining resistance, while the chemical profiling of rice varieties holds promise for confirming the physiological antibiosis of new germplasms. Understanding both the physical plant characteristics and the changes in biochemical defence molecules in experimental genotypes can be utilized to develop resistant genotypes against leaffolder. In the present study, resistant genotypes were characterized by taller stature, narrow and longer leaves, while susceptible types were shorter with wider leaves. Furthermore, higher sugar and protein composition were associated with susceptibility, while higher phenol content was linked to plant resistance. Analyzing the chemical compositions of different rice genotypes provides valuable insights into their defensive capabilities, which can be leveraged to develop more effective pest management strategies. These findings highlight the presence of distinct genotypes with contrasting characteristics, which can be utilized as diverse parental lines. This can be particularly valuable for studying the inheritance pattern of leaffolder resistance and facilitating the development of mapping populations. By using these diverse genotypes, researchers can identify the specific genomic regions, known as Quantitative Trait Loci (QTLs), responsible for leaffolder resistance in rice.
Acknowledgements
The authors gratefully acknowledge the Vice Chancellor, Odisha University of Agriculture and Technology, Bhubaneswar and Director, ICAR-NRRI, Cuttack, India for providing for their technical support and facilitation to carry out the research work successfully. The authors also thankful to Gene bank, ICAR-NRRI, Cuttack for providing plant materials.
AKN carried out the experiments, analyzed the data, and wrote the manuscript. SSD participated in the experiments and revised the manuscript. PG, AS, TA and GK guided the experiments and participated in bioinformatics analysis. NKBP and SDM reviewed the draft. All authors read and approved the manuscript.
This research was funded by ICAR-National Rice Research Institute in-house “Project number 3.1”.
The authors have no competing interests to declare that are directly or indirectly relevant to the content of this article.
The authors declare that they have no known competing financial interests or personal relationships that could have appeared to influence the work reported in this paper.
Dear Editorial Team, Clinical Medical Reviews and Reports. My experience with the journal was highly positive. The peer-review process was rigorous, constructive, and completed in a timely manner. The reviewers provided valuable comments that helped improve the quality and clarity of our manuscript. The editorial office was professional, responsive, and supportive throughout all stages of the publication process. Communication was clear and efficient, and any questions were addressed promptly. Overall, I found the journal to maintain high scientific standards and an excellent publication workflow. I would be pleased to consider submitting future work to this journal. Best wishes from, Elena Popa.

It was my pleasure to submit my testimonial concerning the Reviewer Board of our Scientific Journal “Brain and Neurological Disorders”. The Reviewers focused on some modifications and their contribution was helpful. The ladies of our Editorial Office were also supported my efforts. It was my honor to have such a co-operation and I am looking forward for more collaboration.

Dear Grace Pierce, Editorial Coordinator of Journal of Clinical Research and Reports, Thank you for the speedy and efficient peer review process. I appreciate the fact that your peer reviewers do not take months to respond like with some other journals. I would also like to thank the editorial office for responding quickly to my questions. It is an excellent journal. I plan to submit more manuscripts in the future. Best wishes from, Robert W. McGee

Dear Grace Pierce, Editorial Coordinator of Journal of Clinical Research and Reports, Working with you and your team on our recent publication in JCRR has been a truly wonderful and enjoyable experience. The responses were prompt, and the reviewers were patient, constructive, and highly professional. One reviewer in particular gave me the feeling that a professor was carefully reading and commenting on my coursework, which was deeply touching. The entire process was straightforward and hassle‑free, with no tedious online forms to complete. I highly recommend this journal. Best wishes from, DR Aibing Rao, Head of R&D

I Appreciate the Opportunity to Share my Experience with the Journal of Clinical Research and Reports. The peer review process was timely and constructive, and the feedback provided helped improve the quality of our manuscript. The editorial office was professional, responsive, and supportive throughout the process, ensuring smooth communication and efficient handling of the submission. Overall, it was a positive experience collaborating with your team.

Dear Mercy Grace, Editorial Coordinator of Obstetrics Gynecology and Reproductive Sciences, We would like to express our gratitude for your help at all stages of publishing and editing the article. The editors of the magazine answer all the necessary questions and help at every stage. We will definitely continue to cooperate and publish other works in the Obstetrics Gynecology and Reproductive Sciences! Best wishes from, Alla Konstantinovna Politova,
