
Research Article | DOI: https://doi.org/10.31579/2690-1919/449
1Graduate Program in Health Sciences, Federal University of Bahia, Salvador, Bahia, Brazil.
2Lagarto University Hospital, Lagarto, Sergipe, Brazil.
3Faculty of Medicine of Bahia, Federal University of Bahia, Salvador, Bahia, Brazil.
4Aliança Hospital, Salvador, Bahia, Brazil.
5Assistant Professor of Musculoskeletal Radiology University of Pittsburgh, University of Pittsburgh Medical Center, United States of America.
6Graduate Program in Food, Nutrition and Health, School of nutrition, Federal University of Bahia, Salvador, Bahia, Brazil.
*Corresponding Author: Rafael Pinto Lourenço, Address: Praça Ramos de Queirós, no number - Largo do Terreiro de Jesus, City: Salvador. State: BA, postal code: 40026-010.
Citation: Rafael P. Lourenço, Santos Souza CNP, Vieira Braga HJ, Lucas da Gama Lobo, Argemiro D' Oliveira Júnior, et.al, (2025), Low Muscle Mass and Mortality in Patients with Sars-Cov-2: Systematic Review and Meta-Analysis, J Clinical Research and Reports, 18(1); DOI: 10.31579/2690-1919/449
Copyright: © 2025, Rafael Pinto Lourenço. This is an open access article distributed under the Creative Commons Attribution License, which permits unrestricted use, distribution, and reproduction in any medium, provided the original work is properly cited.
Received: 27 November 2024 | Accepted: 14 December 2024 | Published: 08 January 2025
Keywords: COVID-19; sarcopenia; computed tomography
Background: Aim Low muscle mass assessed by computed tomography (CT) may be associated with mortality or admission to the Intensive Care Unit (ICU) of patients with COVID-19.
Materials and Methods: Data were collected through searches in PubMed/MEDLINE and EMBASE using the Rayyan tool to screen identified studies, and the review followed the PRISMA model. Data extraction was performed by two authors independently, and the risk of bias was assessed using the Newcastle-Ottawa quality tool. Statistical analyses were performed using R version 3.5.2 (The R Foundation for Statistical Computing) and Review Manager (RevMan 5.3. Copenhagen: The Nordic Cochrane Center) software.
Results: Eighteen observational studies met the inclusion criteria for qualitative analysis, one of which was excluded due to a high risk of bias. Fifteen studies were included in the meta-analysis, totaling 3,920 patients and 640 deaths, which demonstrated that individuals with low muscle mass are 2.40 times more likely to die. When admission to the Intensive Care Unit (ICU) was considered an outcome, eight studies were included, totaling 2,993 patients, of which 770 required intensive care support, with low muscle mass increasing the chances of admission by 1.99 times in the ICU.
Conclusion: Based on the results shown in the present study, low muscle mass assessed by CT suggests an association with higher mortality and ICU admission in patients with COVID-19.
Reducing muscle mass is one of the pillars for diagnosing sarcopenia, a widespread and progressive skeletal muscle disease, which is probable when low muscle strength is detected. This condition is confirmed when there is low muscle quality or quantity and considered severe when these factors are associated with low physical performance [1]. The worldwide prevalence of sarcopenia is identified at 29% in community elderly, and higher in individuals admitted to long-term care institutions (33%), where physical inactivity is more prevalent [2,3]. Furthermore, sarcopenia is associated with mortality and morbidity due to physical disability, low quality of life, hospitalization, and depression [4].
Loss of muscle mass and function may predispose to negative clinical outcomes in patients with COVID-19 [5]. It is noteworthy that sarcopenic obesity may increase the risk of severe COVID-19 infection, which suggests the need to identify effective diagnostic measures that can better direct intervention to the patient to enable a more favorable clinical outcome [6].
Computed tomography (CT) is included in this perspective, a high-quality diagnostic imaging technique that uses the specific lumbar vertebral reference point (L3) indicated by the European Consensus on Sarcopenia [1], as a method of evaluating muscle mass. This is an internationally recognized measure to predict the prognosis of patients with cancer [7]. Furthermore, it is a predictor of mortality in individuals treated in the Intensive Care Unit (ICU) [8], and in patients diagnosed with decompensated Chronic Liver Diseases [9].
Skeletal muscle measurements at the twelfth thoracic vertebra (T12) level may also enable the diagnosis of sarcopenia in patients undergoing CT limited to the chest. A study validated this technique and demonstrated that the assessment of T12 allows a measurement that is highly correlated with the quantity of skeletal muscle mass in the third lumbar vertebra (L3) [10]. Some observational studies have associated the loss of muscle mass with negative clinical outcomes in COVID-19 [11–13]. During the COVID-19 pandemic, many patients underwent chest CT, as a routine part of some health services. Data collected in these analyses make it possible to evaluate muscle mass using CT and relate low muscle mass to the worst clinical outcomes during hospitalization due to COVID-19.
Given the above, this study aims to systematically review the current literature to observe whether there is an association between low muscle mass assessed by CT on mortality and ICU admission in patients with COVID-19.
2.1. Search strategy
All original studies that investigated skeletal muscle mass assessed by CT in patients diagnosed with COVID-19 were identified by a systematic search in the PubMed/MEDLINE and EMBASE databases until March 25, 2023. The search strategy was carried out as described below: PubMed ((covid-19[MeSH Terms]) OR (sars-cov-2[MeSH Terms])) AND ((((sarcopenia) OR (muscle index)) OR (muscle area)) OR (muscle mass)) and EMBASE "(('coronavirus disease 2019'/exp OR 'coronavirus disease 2019') OR 'severe acute respiratory syndrome coronavirus 2') AND ('sarcopenia' OR 'muscle mass' OR 'muscle area')". The systematic review was registered in PROSPERO with CRD42022283148.
2.2. Eligibility Criteria
Only clinical studies published in English were eligible if they met previously defined inclusion criteria. (1) study design: observational; (2) exposure: patients with low muscle mass diagnosed by CT during hospital stay; over 18 years old with a diagnosis of COVID-19 confirmed by the RT-PCR test; (3) results: mortality and/or ICU admission. Studies were excluded based on the following criteria: (1) study design/type: clinical trials, review articles, editorials, letters to the editor, systematic reviews, meta-analysis; (2) exposure: studies that used assessment equipment other than CT to measure skeletal muscle mass, and studies with pregnant women; and (3) outcomes: studies that did not include mortality and/or ICU admission.
2.3. Selection and data collection process
The Rayyan tool was used to screen the studies retrieved from the databases, which allows the removal of duplications, blinding, and selection of studies based on reading titles and abstracts. After the initial screening, the selected studies were read in full. The extracted information included study design, country of origin, total sample size, age, and sex of the individuals evaluated. The cut-off level of the images obtained by CT, the skeletal muscle measured, the type of assessment, the software used, cut-off values, and CT time concerning hospital admission, mortality, and ICU admission were also analyzed. The screening and complete reading stages of the studies were conducted by two independent evaluators (RPL and CNPSS), and when present, divergences were resolved by consensus between the evaluators.
2.4. Bias risk analysis
The quality of each study was assessed through the risk of bias analysis using the Newcastle-Ottawa assessment tool by the same authors who performed the initial screening. This quality assessment scale (NOS) is indicated for evaluating cohort studies using the star system (*) classified from 0 to 9, which has three domains: Selection, Comparability, and Outcome/Result.
Higher scores indicate better quality of the evaluated study [14]. Studies were categorized as being low (0 to 5 stars), moderate (6 to 8 stars), and high quality (9 stars).
2.5. Homogeneity of studies and statistical analysis
The results were reported as derived from original articles, and the review of studies followed the PRISMA model [15].
Mortality and ICU admission analyses were performed using Review Manager software (RevMan 5.3. Copenhagen: The Nordic Cochrane Center, The Cochrane Collaboration, 2014). Due to the dichotomous nature of the results, event data (deaths and ICU admission), such as their respective Odds Ratio with their 95% confidence interval (95%CI), were extracted for grouping. Data were grouped by the random effects model along with the generic inverse variance method.
For each outcome, study heterogeneity was assessed with the Cochran χ² (Chi²) test, assuming evidence of heterogeneity with a p-value < 0>
When heterogeneity was identified, visual inspection was carried out using Baujat plot analysis, made available by the software R version 3.5.2 (The R Foundation for Statistical Computing). The Baujat plot graph is proposed for diagnosing sources of heterogeneity in meta-analytic analysis, plotting the contribution of each study to the general heterogeneity statistics by the contribution of each study to the result [17]. After identifying the studies that influenced heterogeneity, the leave-one-out analysis was carried out, removing them from the analysis to investigate their impact on the results and whether they explained the heterogeneity.
During the analysis to identify the presence of publication bias from 10 or more studies, a contour-enhanced Funnel plot was performed and visually inspected to check for asymmetry, as recommended by Sterne et al [18]. In the case of suspected funnel plot asymmetry, the Thomas test by arcsin (AS-Thomas) proposed by Rucker et al [19] was adopted due to the nature of the outcome.
The initial search strategy retrieved 1,352 publications, with 203 duplicates being removed. After screening the titles and abstracts for relevance and eligibility criteria, 61 full articles remained for reading. Of these, 43 articles were excluded for not meeting the inclusion criteria. Therefore, 18 studies were selected for qualitative analysis [11,12,19–34]. The PRISMA items that describe the study selection process are illustrated in Figure 1
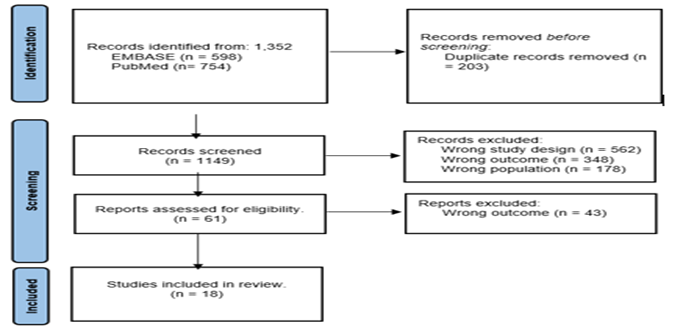
Figure 1. Preferred reporting items for systematic reviews and study selection.
After assessing the risk of bias described in Table 1, one high-quality study was included for qualitative and quantitative analysis [30], and 16 of moderate quality [11,12,19–29,32–34]. However, one study was excluded from the sample for not presenting satisfactory quality to compose the meta-analysis. [31].
| Studies | Selection | Comparability | Outcomes | Total (0-9) | Study quality | |||||
| Representative-ness | Selection of the nonexposed cohort | Ascertainment of exposure | Demonstration that outcome of interest was not present at the start of study | On the basis of the design or analysis controlled for confounders | Assessment of outcome | Follow-up duration | Adequacy of follow-up | |||
| Attaway et al. 2022 19 | * | * | ** | * | * | * | 7 | Moderate | ||
| Beltrão et al. 202220 | * | * | * | ** | * | * | * | 8 | Moderate | |
| Damanti et al. 2022 21 | * | * | ** | * | * | * | 7 | Moderate | ||
Erdol et al. 2022 22 | * | * | * | ** | * | * | * | 8 | Moderate | |
| Giraudo et al. 2021 23 | * | * | * | * | * | * | * | * | 8 | Moderate |
| Grigioni et al. 2023 24 | * | * | * | ** | * | * | * | 8 | Moderate | |
| Hocaoglu et al. 2021 12 | * | * | * | ** | * | * | * | 8 | Moderate | |
| Kang et al. 2022 25 | * | * | ** | * | * | * | 7 | Moderate | ||
| Kardas et al. 2022 26 | * | * | * | * | * | * | * | 7 | Moderate | |
| Kim et al. 202127 | * | * | * | ** | * | * | * | 8 | Moderate | |
| McGovern et al. 202128 | * | * | * | * | * | * | * | 7 | Moderate | |
| Moctezuma-Velázquez et al. 2021 29 | * | * | * | ** | * | * | * | 8 | Moderate | |
| Osuna-Padilla et al. 202230 | * | * | * | * | ** | * | * | * | 9 | High |
| Polat et al. 2021 31 | * | * | * | * | * | 5 | Low | |||
| Schiaffino et al. 2021 11 | * | * | * | ** | * | * | * | 8 | Moderate | |
| Surov et al. 202332 | * | * | ** | * | * | * | 7 | Moderate | ||
| Surov et al. 2023A33 | * | * | * | ** | * | * | * | 8 | Moderate | |
| Ufuk et al. 2020 34 | * | * | * | ** | * | * | * | 8 | Moderate | |
Table 1. Assessment of the risk of bias in the studies
After assessing the risk of bias described in Table 1, one high-quality study was included for qualitative and quantitative analysis [30], and 16 of moderate quality [11,12,19–29,32–34]. However, one study was excluded from the sample for not presenting satisfactory quality to compose the meta-analysis. [31].
Table 2 below illustrates some of the main characteristics of the selected studies. After bias assessment, 17 observational studies from nine different countries were included; fifteen studies (88%) were retrospective cohorts, eight studies (47%) used the T12 level on CT with analysis of the thoracic muscles, nine studies (52%) evaluate the skeletal muscle index (SMI), but present different cut-off values for low muscle mass.
| Studies | Country | Study design | (n) | Average age | Male n (%) | CT level | Skeletal muscle measured | Software used | Cut-off values for low muscle mass | CT scan period | Mortality Criteria |
| Attaway et al. 2022 19 | United States of America | Retrospective cohort | 95 | 63,3 | 50 (53) | T12 | Pectoralis muscle (PM), erector spinae muscle (ESM) | Aquarius iNtuition® | Greatest reduction in PM and ESM observed for 30 days. | During the first hospitalization | 90 days after CT |
| Beltrão et al. 202220 | Brazil | Prospective cohort | 200 | 62 | 113 (56,5) | Between T12 and L2 | Abdominal | 3D Slicer® | Muscle area < 92> | NR | In-hospital |
| Damanti et al. 2022 21 | Italy | Retrospective cohort | 81 | 59,3* | 71 (87,7) | L1, L2 e L3 | Psoas | sliceOmatic® version 5.0 | Reduced muscle mass was defined using predetermined sex-specific and vertebral level-specific cutoff values. | Lumbar CT available for convenience | In-hospital |
Erdol et al. 2022 22 | Turkey | Retrospective cohort | 232 | 51* | 117 (50) | T12 | Erector spinae muscle, pectoral muscle, and total skeletal muscle | Advantage Workstation 4.7 (GE HealthCare®) | Lowest tertile of skeletal muscle cross-sectional area. | Admission | In-hospital |
| Giraudo et al. 2021 23 | Italy | Retrospective cohort | 150 | 61,3 | 15 (29) | T12 | Paravertebral | Horos® | Hounsfield Unit (Hu <30> | Up to 3 weeks | In-hospital |
| Grigioni et al. 2023 24 | France | Retrospective cohort | 244 | 62 | 134 (54,9) | T12 | Rectus abdominis, external oblique, internal oblique, latissimus dorsi, intercostals and erector spinae | Carestream® | Women SMI<20> | During hospitalization | In-hospital |
| Hocaoglu et al. 2021 12 | Turkey | Retrospective cohort | 217 | 61 | 108 (49,7) | Aortic arch | Pectoral | SAFIRE® | Pectoral muscle density: women 15.9 and men 34.1. | Patient's first CT scan | During follow-up |
| Kang et al. 2022 25 | South Korea | Retrospective cohort | 127 | 61 | 67 (52,8) | L2 | Abdominal | AutoMATiCA® | Sarcopenia was defined as SMI < 50> | Admission | Mortality between April and August 2020 |
| Kardas et al. 2022 26 | Germany | Retrospective cohort | 46 | 64,5* | 27 (59) | T4 | Pectoral muscle area, pectoral muscle index, skeletal muscle caliber. | Infinitt PACS® | Multivariate logistic regression model. | First CT scan after admission. | In 30 days |
| Kim et al. 202127 | South Korea | Retrospective cohort | 121 | 62* | 44(36) | T12 | Erector spinae, external and internal obliques, latissimus dorsi, rectus abdominis, and external and internal intercostal muscles | AsanJ-Morphometry® | Lowest quartile of skeletal muscle index by sex. | Admission | 60 days of follow-up |
| McGovern et al. 202128 | United Kingdom | Retrospective cohort | 63 | 42 (66,7) >70 years | 30 (47,6) | L3 | Quadratus lumborum, psoas, rectus abdominis, and erector spinae muscles, and the internal transverse and external oblique muscle groups | ImageJ® | Men: IMC <25> | Up to 3 months after diagnosis | 30 days after diagnosis |
| Moctezuma-Velázquez et al. 2021 29 | Mexico | Retrospective cohort | 519 | 51 | 332 (64) | T12 | Skeletal muscles in the T12 region | ImageJ® | Men SMI <42> | Admission | In-hospital |
| Osuna-Padilla et al. 202230 | Mexico | Prospective cohort | 86 | 48,6 | 63 (74) | L3 | Psoas | sliceOmatic® version 5.0 | SMI ≤52,3 cm2/m2 for men and ≤38,6 for women. For those with a BMI≥30 kg/m2, a BMI of ≤54.3 cm2/m2 was considered for men and ≤46.6 cm2/m2 for women. | 24-48 hours after admission | In-hospital |
| Schiaffino et al. 2021 11 | Italy | Retrospective cohort | 552 | 65 | 364 (66) | T5 e T12 | Paravertebral | Local PACS | Median. | Admission | In-hospital |
Surov et al. 202332 | Germany | Retrospective cohort | 1138 | 54,5 | 591 (51,9) | T4 | Pectoral | NR | NR | First CT scan of hospitalization | In 30 days |
| Surov et al. 2023A33 | Germany | Retrospective cohort | 173 | 61* | 93 | L3 | Psoas | ImageJ® | SMI <52> | First CT scan of hospitalization | In 30 days |
| Ufuk et al. 2020 34 | Turkey | Retrospective cohort | 130 | 48 | 76 (58,5) | Aortic arch | Pectoral | Horos® version 3.3.3 | Lowest tertile and stratified by gender | 4 days on average | In-hospital |
Table 2. Summary of studies that evaluated muscle mass using computed tomography in COVID-19 patients.
NR: not reported. *Median. Abbreviations: Erector spinae muscle (ESM); General Electric (GE); Body Mass Index (BMI); Pectoralis muscle (PM); Picture archiving and communications system (PACS); Skeletal muscle index (SMI); Computed Tomography (CT).
3.1 Low muscle mass in mortality
Fifteen studies evaluated 3,920 patients, of which were reported 640 events (deaths), compared low muscle mass versus normal muscle mass in the mortality of patients diagnosed with COVID-19. The overall effect showed a statistically significant difference, demonstrating that patients with low muscle mass were 2.40 times more likely to die than individuals with normal muscle mass. However, significant heterogeneity (p<0 xss=removed>Figure 2.

Figure 2. Comparison between low muscle mass and normal muscle mass on mortality in patients with COVID-19.
3.2 Sensitivity analysis
When investigating heterogeneity using the Baujat plot, we identified the studies of Surov et al [32] as a significant influencer of the result with an impact on heterogeneity, and Erdol et al [22] as a significant influencer on heterogeneity, after removing the studies above by leave-one-out analysis, both the heterogeneity remained significant and the inconsistency was considered substantial (Tau² = 0.32; Chi² = 39.82, df = 12) (P < 0 xss=removed>
3.3 Publication bias
Upon visual inspection of the funnel plot, an asymmetry was observed; however, after an investigation using the AS-Thomas test, the asymmetry was not considered significant (p = 0.0631), discarding suspicion of publication bias (Supplementary).
3.4 Low muscle mass on admission to the ICU
Eight studies evaluated 2,993 patients diagnosed with COVID-19, of which 770 presented the event studied (admission to the ICU), compared low muscle mass versus normal muscle mass on admission to the ICU. The general effect indicated a statistically significant difference, demonstrating that patients with low muscle mass were 1.99 times more likely to be admitted to the ICU than individuals with adequate muscle mass. However, significant heterogeneity (p<0 xss=removed>Figure 3.
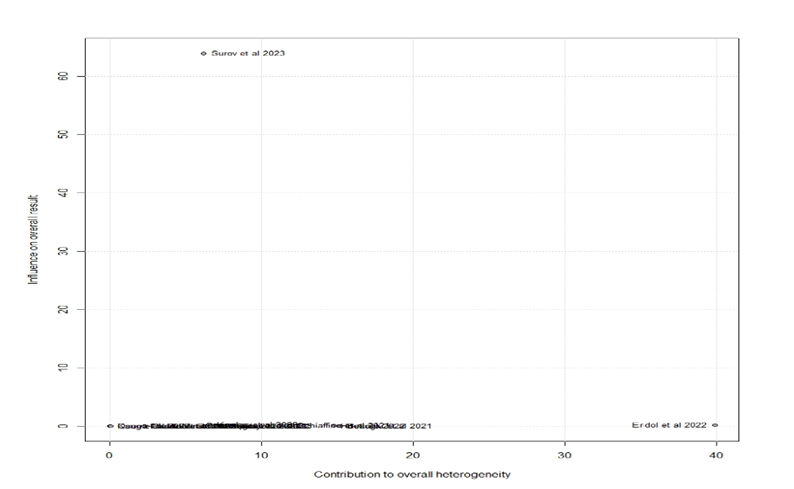
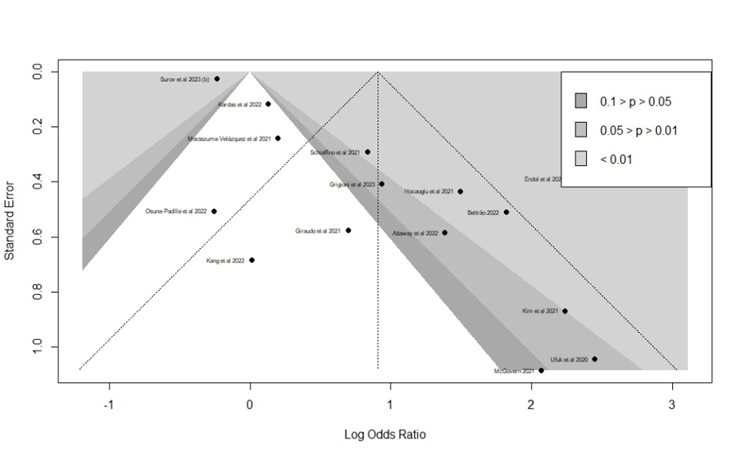
Figure 4. Baujat plot of mortality
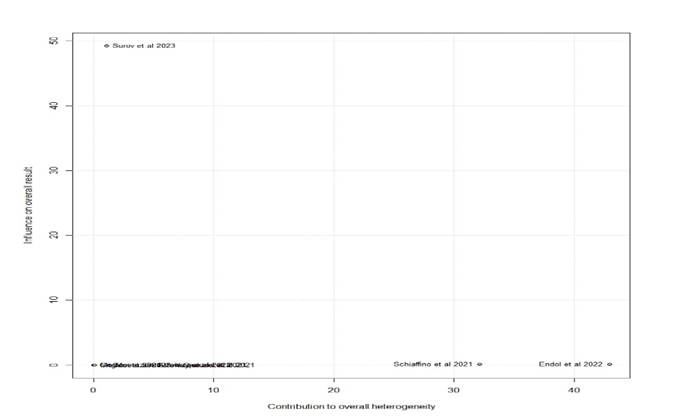
Figure 5. Baujat plot of admission to the ICU
The present work included 17 observational studies from nine countries, published between 2020 and 2023, considered retrospective and prospective cohorts, which evaluated unfavorable outcomes (mortality and/or ICU admission) in patients over 18 years old diagnosed with COVID-19. Individuals with low muscle mass with COVID-19 were more likely to die and be admitted to the ICU.
Of the 15 articles included in the meta-analysis that evaluated low muscle mass and mortality, eight studies [11,12,19,20,22,24,27,34] established a significant association between reduced quality or quantity of skeletal muscle mass and higher mortality rates. CT-Based Muscle Mass Measurement as the Gold Standard [1,35]. Just like Nishimura et al [36], who evaluated muscle mass using CT in patients with lung cancer and observed in a meta-analysis that low muscle mass was associated with a higher risk of perioperative complications and a worse long-term prognosis.
In this review, we observed that eight studies [11,19,20,22,23,27,29] evaluated muscle mass at the T12 level. According to the European Consensus on Sarcopenia [1], it is recommended to use the L3 level, but studies have shown a good correlation between skeletal muscle mass at T12 and L3 [10,37]. As chest CT is an examination routinely performed during the hospitalization of patients with COVID-19, the assessment of muscle mass through CT becomes timely and valuable for treating these patients.
Among the articles that evaluated parameters related to muscle mass, eight of them obtained outcomes concerning ICU admission and mortality. [11,19,22–24,28,29,32]. Likewise, studies by Kim et al. [27] and McGovern et al. [28] evaluated the influence of sarcopenia on these outcomes. The first one observed that baseline sarcopenia was associated with longer lengths of stay in patients hospitalized for COVID-19. In contrast, the second study demonstrated that when sarcopenia is associated with the presence of obesity, it results in a higher mortality within 30 days.
Therefore, reduced muscle mass is associated with worse clinical outcomes [19,24,34]. Several studies have shown that low muscle mass is a predictor of mortality [11,12,20,21] and admission to the ICU [11,23,30]. However, a study developed by Kang et al [25], demonstrated that muscle quality can also be a predictor of mortality, showing that myosteatosis was significantly associated with higher mortality.
However, we observed studies that did not correlate muscle mass and negative outcomes. According to Kardas et al [26] and Surov et al [32] muscle parameters of COVID-19 patients were unable to predict the clinical course of the disease. Moctezuma-Velazquez et al [29] concluded that the SMI (Skeletal Mass Index) was not associated with ICU admission, the need for IMV (Invasive Mechanical Ventilation), or mortality in hospitalized patients. These results differ from those found by other studies included in this review, probably due to the discrepancy in the assessment type held. Those who obtained a positive association between the variables used criteria that analyzed both muscle quality and quantity, while Moctezuma-Velazquez et al [29] exclusively used the SMI, which is only a quantitative parameter for the assessment.
Age can also influence the quantity and quality of muscle mass, as older adults typically experience a reduction in muscle tissue and are at greater risk for sarcopenia. However, six studies [21,22,29,30,32,34] presented patients with a mean or median age of less than 60 years, demonstrating that COVID-19 increases the risk of sarcopenia, regardless of age, as observed in the respective review studies. In this way, early diagnosis of sarcopenia can contribute to avoiding adverse outcomes because when identifying a reduction in muscle mass, health professionals can use strategies such as prescribing energy and protein supplementation associated with resistance exercise [21]. Furthermore, individualized oral, parenteral, and enteral nutrition with amino acid supplementation can contribute to the physiological recovery and reduction of the inflammatory condition of patients with COVID-19 [38].
The study's strength lies in the clinical relevance of using CT to predict clinical worsening. Yakti et al [39] highlights that maintaining muscle quality and function strengthens the defense against COVID-19 and that lean muscle mass should be assessed to define the therapeutic plan for critically ill patients.
It is essential to highlight that our results have limitations since the studies evaluated different skeletal muscles and different levels of CT images. Furthermore, non-uniform techniques and software were used to measure skeletal muscle mass, and cutoff values differed even when the same skeletal muscles at the same vertebral level were used. In addition, some studies adjusted the technique for the height of the individuals, and others did not follow this recommendation. Finally, another potential limitation lies in the retrospective design of most of the included studies.
Therefore, based on the results presented, it is concluded that under the conditions of the present study, the reduction in the quantity of muscle mass assessed by CT was associated with more significant mortality and ICU admission in patients with COVID-19. The analysis of muscle mass, using CT at the level of the 12th thoracic vertebra, is a possible new tool to assist clinical practice and facilitate decision-making. Thus, the usual use of chest CT examination to assess the presence and severity of pneumonia in these patients can be combined with the analysis of muscular condition aiming to stratify risk, calculate survival, and possibly direct the course of clinical and nutritional treatment. New prospective clinical studies should be conducted to enable the obtaining of consolidated scientific evidence to direct clinical practice with greater precision.
The Maria Emília Foundation financially supported the study and the publication.
The present study was funded by the Maria Emília Pedreira Freire de Carvalho Foundation and supported by the Instituto D'Or de Pesquisa e Ensino (IDOR). Methodological support from researchers Carla Maria Lima Silva and Larissa Resende Oliveira. The authors declare that they have no conflicts of interest.

Figure 4. Baujat plot of mortality


Figure 5: Baujat plot of admission to the ICU
Dear Editorial Team, Clinical Medical Reviews and Reports. My experience with the journal was highly positive. The peer-review process was rigorous, constructive, and completed in a timely manner. The reviewers provided valuable comments that helped improve the quality and clarity of our manuscript. The editorial office was professional, responsive, and supportive throughout all stages of the publication process. Communication was clear and efficient, and any questions were addressed promptly. Overall, I found the journal to maintain high scientific standards and an excellent publication workflow. I would be pleased to consider submitting future work to this journal. Best wishes from, Elena Popa.

It was my pleasure to submit my testimonial concerning the Reviewer Board of our Scientific Journal “Brain and Neurological Disorders”. The Reviewers focused on some modifications and their contribution was helpful. The ladies of our Editorial Office were also supported my efforts. It was my honor to have such a co-operation and I am looking forward for more collaboration.

Dear Grace Pierce, Editorial Coordinator of Journal of Clinical Research and Reports, Thank you for the speedy and efficient peer review process. I appreciate the fact that your peer reviewers do not take months to respond like with some other journals. I would also like to thank the editorial office for responding quickly to my questions. It is an excellent journal. I plan to submit more manuscripts in the future. Best wishes from, Robert W. McGee

Dear Grace Pierce, Editorial Coordinator of Journal of Clinical Research and Reports, Working with you and your team on our recent publication in JCRR has been a truly wonderful and enjoyable experience. The responses were prompt, and the reviewers were patient, constructive, and highly professional. One reviewer in particular gave me the feeling that a professor was carefully reading and commenting on my coursework, which was deeply touching. The entire process was straightforward and hassle‑free, with no tedious online forms to complete. I highly recommend this journal. Best wishes from, DR Aibing Rao, Head of R&D

I Appreciate the Opportunity to Share my Experience with the Journal of Clinical Research and Reports. The peer review process was timely and constructive, and the feedback provided helped improve the quality of our manuscript. The editorial office was professional, responsive, and supportive throughout the process, ensuring smooth communication and efficient handling of the submission. Overall, it was a positive experience collaborating with your team.

Dear Mercy Grace, Editorial Coordinator of Obstetrics Gynecology and Reproductive Sciences, We would like to express our gratitude for your help at all stages of publishing and editing the article. The editors of the magazine answer all the necessary questions and help at every stage. We will definitely continue to cooperate and publish other works in the Obstetrics Gynecology and Reproductive Sciences! Best wishes from, Alla Konstantinovna Politova,
