
Research Article | DOI: https://doi.org/10.31579/2690-4861/416
Tex St. Cyril and St. Methodius University of Veliko Tarnovo Veliko Tarnovo 5003, Teodosii Tarnovski St., 2, Bulgaria
*Corresponding Author: Antoaneta Vacheva, Tex St. Cyril and St. Methodius University of Veliko Tarnovo Veliko Tarnovo 5003, Teodosii Tarnovski St., 2, Bulgaria.
Citation: Antoaneta Vacheva, (2024), Influence of Personal Factors on Quality of Life in Patients with Chronic Obstructive Pulmonary Disease (COPD), International Journal of Clinical Case Reports and Reviews, 17(1); DOI:10.31579/2690-4861/416
Copyright: © 2024, Antoaneta Vacheva. This is an open-access article distributed under the terms of the Creative Commons Attribution License, which permits unrestricted use, distribution, and reproduction in any medium, provided the original author and source are credited.
Received: 04 March 2024 | Accepted: 21 March 2024 | Published: 04 April 2024
Keywords: chronic obstructive pulmonary disease; anxiety; negative affectivity; social inhibition
Chronic Obstructive Pulmonary Disease (COPD) is a disease characterized by restriction of airflow in airways. Smoking is a major risk factor for disease. Other factors are air pollution from fuels, industrial dust, chemical agents and genetic causes. Main symptoms are shortness of breath, chronic cough with or without sputum and rapid fatigue. Chronic obstructive pulmonary disease /COPD/ is a source of stress and anxiety, due to severity of disease, need for long-term treatment and detachment from social life. Study cohort consisted of 124 patients with a diagnosis of COPD and a control group of 162 without lung disease. Persons studied are over 18 years of age, of different sexes, of Bulgarian ethnic origin and different family and social status. Chronic obstructive pulmonary disease is a disease of increasing social importance and, according to forecast of WHO, by 2030 it is expected to become third leading cause of death in world. Aim of pilot study was to determine influence of some personal risk factors (anxiety and type D personality in dimensions: "negative affectivity" and "social inhibition") on quality of life and social adaptation of patients with COPD.
Chronic obstructive pulmonary disease (COPD) is a progressive disease characterized by long-lasting respiratory symptoms and airflow limitation.[3] Global Initiative on Chronic Obstructive Lung Disease (GOLD) 2024 defines COPD as a heterogeneous lung disease characterized by chronic respiratory symptoms (difficulty breathing, cough, sputum production, chest pain, wheezing) due to airway abnormalities (bronchitis, bronchiolitis). or alveoli (emphysema), which often cause progressive airflow obstruction.[4] Main reason for occurrence and development of chronic obstructive pulmonary disease is smoking /active and passive.[8] Other risk factors for developing COPD are air pollution from dust, fumes or chemicals, indoor air pollution from biomass fuel (wood, animal dung, crop residues), coal in home, poor growth in womb, prematurity, frequent or severe childhood respiratory infections, childhood asthma, genetic disease - alpha-1 antitrypsin deficiency.[2] Emphysema is a structural abnormality with enlargement of air spaces (alveoli) whose walls have collapsed, resulting in permanent damage to lung tissue with or without limitation of airflow. Chronic bronchitis is defined as a productive cough.[5][6] Chronic bronchitis does not always lead to airflow limitation, but adults with chronic bronchitis who smoke are at high risk of developing COPD.[7] Emphysema and chronic bronchitis remain predominant phenotypes of COPD. COPD usually occurs in men and women over age of 35-40.[1][3] Chronic Obstructive Pulmonary Disease (COPD). COPD is fourth leading cause of death worldwide. According to WHO data, COPD kills over 3 million people every year, with over 90% of registered cases with a fatal outcome concentrated in low- and middle-income countries.[9][10]. Chronic obstructive pulmonary disease is a disease of increasing social importance and, according to forecast of the WHO, by 2030 it is expected to become third leading cause of death in world. [11]. European Union presents data on COPD as a component of nosology "Diseases of the respiratory system". Eurostat indicates that in Community, deaths from respiratory diseases account for 7.5% of all deaths [12], making respiratory diseases third most common cause for death in EU after CVD and malignant neoplasms.[13] According to WHO data, 251 million people in world suffer from COPD, and forecasts show an increase in the prevalence of disease in coming years.[14] Official statistics of Ministry of Health indicate that in 2018, between 5 and 10% of Bulgarians are sick with COPD, only 75,000 of them are being treated. Specialists believe that frequency of COPD in our country is significantly above European average and covers more than 10% of the population over 40 years of age.[15] Dr. Samuel Kutash, an American clinical psychologist and professor of psychology, developed a theory of anxiety using research on anxiety and stress. According to Dr. Kutash, “Anxiety or a state of disequilibrium occurs when a person does not experience an optimal level of stress for their own constitution. Tranquility or a state of equilibrium or under-equilibrium occurs as a result of experiencing an optimal level of stress for one's own structure either in healthy balance (equilibrium) or in unhealthy balance (under-equilibrium).[16]
Aim of pilot study
Аim of pilot study was to determine the influence of some personal risk factors (anxiety and personality type D in dimensions: "negative affectivity" and "social inhibition") on the quality of life and social adaptation of patients with COPD.
Tasks
1. To investigate the elements of quality of life in patients with COPD related to self-rated health, exercise, self-care and activities of daily living.
2. To investigate some risk factors and personality characteristics for type D in patients with COPD.
3. To investigate the relationships and dependencies between quality of life, anxiety and type D personality in patients with COPD.
Hypothesis
It is allowed that patients with COPD, with a higher level of anxiety and higher D personality scores, will have a worse quality of life and social adjustment.
Logical units of observation
✓ Patients diagnosed with COPD: mild COPD; moderate COPD; severe COPD; very severe COPD.
✓ Control group of individuals without lung disease
Factorial signs of observation:
➢ Demographic: gender; age; education; marital status; labor activity.
➢ Health status: duration of illness; risk factors: smoking
➢ Spheres of health-related quality of life: mobility; self-service; usual activities; pain/discomfort; anxiety/depression; self-rated health;
➢ Personal anxiety;
➢ Type D personality:
• negative affectivity;
• social isolation.
➢ Social adaptability.
Sociological methods
Self-assessment questionnaires
➢ Standardized questionnaire for health-related quality of life research - EQ-5D-3L; adapted Bulgarian version.
➢ Questionnaire for determining belonging to personality type D - (D Scale -14); adapted Bulgarian version.
➢ Questionnaire for the study of personal anxiety - Trait Anxiety Inventory; adapted Bulgarian version.
Statistical methods
• Descriptive
- Variation analysis – arithmetic mean and standard error (mean±SEM);
- Alternative analysis – evaluation of the relative share in (%).
• Parametric analysis
- Student's t-test - difference between two independent samples.
- univariate and multivariate regression analysis
• Non-parametric analysis:
- χ2 - Pearson's test
- Kruskal-Wallis criterion
- Fisher's exact test
- Kolmogorov-Smirnov test.
• Significance level of null hypothesis P=0.05, confidence interval 95%.
• Correlation analysis – Pearson's linear correlation coefficient (r).
• Data processing and analysis - SPSS v.19. The graphical presentation MS Excel for Windows.
Contingent
Study cohort consisted of 124 patients with a diagnosis of COPD and a control group of 162 individuals without lung disease. Persons studied are over 18 years of age, of different genders, of Bulgarian ethnic origin and with different family and social status.
| characteristic | men | women | ||||
| number | р % | Sp | number | р % | Sp | |
| residence | ||||||
| village | 14 | 19.18 | 4.61 | 15 | 20.55 | 4.73 |
| city | 41 | 56.16 | 5.81 | 41 | 56.16 | 5.81 |
| regional city | 18 | 24.66 | 5.04 | 17 | 23.29 | 4.95 |
| total | 73 | 100 | 73 | 100 | ||
| Marital status | ||||||
| Family | 48 | 65.75 | 5,55 | 38 | 52.05 | 5.85 |
| unmarried | 14 | 19.18 | 4,61 | 9 | 12.33 | 3.85 |
| A widower | 11 | 15.07 | 4,19 | 26 | 35.62 | 5.60 |
| total | 73 | 100 | 73 | 100 | ||
| Education | ||||||
| High | 22 | 30.10 | 5.37 | 24 | 32.88 | 5.50 |
| Average | 44 | 60.30 | 5.73 | 38 | 52.05 | 5.85 |
| Mainly | 7 | 9.60 | 3.45 | 11 | 15.07 | 4.19 |
| total | 73 | 100 | 73 | 100 | ||
| Employment | ||||||
| working | 28 | 38.40 | 5.69 | 24 | 32.88 | 5.50 |
| unemployed | 6 | 8.20 | 3.21 | 5 | 6.85 | 2.96 |
| pensioner | 39 | 53.40 | 5.84 | 44 | 60.27 | 5.73 |
| total | 73 | 100 | 73 | 100 | ||
Table 1: Distribution of patients with COPD by socio-demographic indicators
Distribution by gender and age of patients with COPD: men 73, average age 60.17±2.48 years; women 73, mean age 62.27±2.78 years. Relative share is highest in patients living in a city: men (56.16%) women (56.16%); family: men (65.75%) women (52.05%). By education, highest relative share is with secondary education: men (60.30%) women (52.05%), pensioners: men (53.40%) women (60.27%).
| diagnoses | is sick | 18 - 39 years | 40 - 59 years | 60 years + | total | ||||
| number | % | number | % | number | % | number | % | ||
Mild COPD
| No | 4 | 100 | 49 | 89.1 | 79 | 90.8 | 132 | 90.4 |
| Yes | 0 | 0 | 6 | 10.9 | 8 | 9.2 | 14 | 9.6 | |
Moderate COPD | No | 4 | 100 | 48 | 87.3 | 74 | 85.1 | 126 | 86.3 |
| Yes | 0 | 0 | 7 | 12.7 | 13 | 14.9 | 20 | 13.7 | |
| Severe COPD | No | 4 | 100 | 50 | 90.9 | 60 | 69 | 114 | 78.1 |
| Yes | 0 | 0 | 5 | 9.1 | 27 | 31 | 32 | 21.9 | |
| Very severe COPD | No | 2 | 50 | 33 | 60 | 48 | 55.2 | 83 | 56.8 |
| Yes | 2 | 50 | 22 | 40 | 39 | 44.8 | 63 | 43.2 | |
Table 2: Distribution of patients by diagnosis and age
A relationship was established between age of severe COPD (χ2=10.60, df=2, P<0 df=2,>0.05).
| characteristic | men | women | ||||
| number | р % | Sp | number | р % | Sp | |
| Residence | ||||||
| village | 5 | 6.94 | 3.00 | 6 | 6.57 | 2.63 |
| City | 49 | 68.06 | 5.49 | 57 | 63.33 | 5.08 |
| Regional city | 18 | 25.00 | 5.10 | 27 | 30.00 | 4.83 |
| total | 72 | 100 | 90 | 100 | ||
| Marital status | ||||||
| family | 42 | 58.33 | 5.81 | 62 | 68.89 | 4.88 |
| unmarried | 25 | 34.72 | 5.61 | 27 | 3.00 | 4.83 |
| widower | 5 | 6.94 | 3.00 | 1 | 1.11 | 1.10 |
| total | 72 | 100 | 90 | 100 | ||
| Education | ||||||
| high | 41 | 56.94 | 5.84 | 81 | 90.00 | 3.16 |
| average | 30 | 41.67 | 5.81 | 9 | 10.00 | 3.16 |
| basically | 1 | 1.39 | 1.38 | 0 | 0.00 | 0.00 |
| total | 72 | 100 | 90 | 100 | ||
| Employment | ||||||
| working | 59 | 81.94 | 4.53 | 82 | 91.11 | 3.00 |
| unemployed | 3 | 4.17 | 2.35 | 6 | 6.67 | 2.63 |
| pensioner | 10 | 13.89 | 4.08 | 2 | 2.22 | 1.55 |
| total | 72 | 100 | 90 | 100 | ||
Table 3: Distribution of control group by socio-demographic indicators
Highest is relative share of men (68.06%), and women (63.33%) living in a city. By marital status, relative share of married women is highest (68.89%). Family men are (58.33%). In terms of education, relative share of women with higher education (90%) is higher, for men it is (56.94%). Among persons from the control group, there are most workers: men (81.94%), women (91.11%).
Self-assessment of physical activity
Patients define their physical activity as "High" men (4.1%) and women (9.6%) "Average" rating men (50.7%) and women (35.6%). "Low" activity in men (45.2%) and women (54.8%). There is a relationship between education and self-assessment of physical activity (χ2=20. 71, df=4, p=0.001), as well as between employment and physical activity (χ2=20.26, df=4, p=0.001).
In the control group, physical activity is "High" in men (16.7%) and women (23.3%). "Average" activity in men (65.3%) and women (65.6%). "Low" is for men (18.1%) and women (11.1%).
A better self-assessment of physical activity was found in men and women of the control group. Age is a factor for physical activity (χ2=10.72, df=4, p=0.01).
There is a statistically significant difference for physical activity between patients and controls (χ2=48.58, df=2, p=0.001).
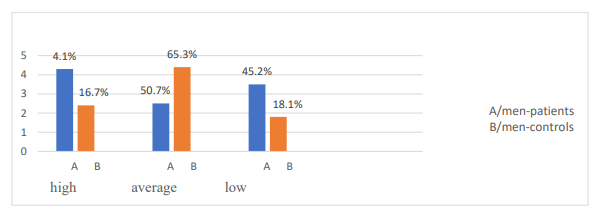
Figure 1. Comparative characteristics of men patients and controls on question: “How do you rate your physical activity in last month?”
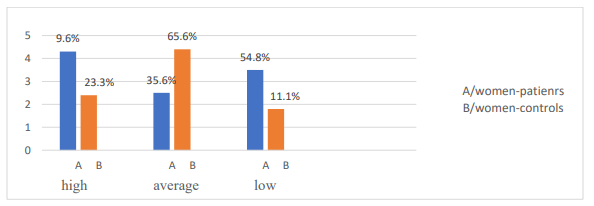
Figure 2. Comparative characteristics of women patients and controls on question: "How do you rate your physical activity in last month?"
Self-reported physical activity was low for half of the subjects in patient group. A statistically significant difference was found for physical activity between patients and controls.
Smoking
Smoking patients were men (28.8%), and women (16.4%). Relative share of smokers 40-59 years (32.7%). There is an association between smoking and age (χ2=8.95, df=2, p=0.01). Relative share of smokers living in city (43.4%) is largest, and smallest in the villages (36.4%).
In the control group, smokers were men (47.8%), women (52.2%). Relative share of smokers 40-59 age (42.7%). There was no statistically significant difference between men smokers two studied groups: patients and controls (U=1.4, P>0.05)
| patients | smokers | non-smokers | total | |||
| gender | number | % | number | % | number | % |
| Men | 21 | 28.8 | 52 | 71.2 | 73 | 100 |
| Women | 12 | 16.4 | 61 | 83.6 | 73 | 100 |
| age | ||||||
| 18-39 years | 2 | 50 | 2 | 50 | 4 | 100 |
| 40-59 years | 18 | 32.7 | 37 | 67.3 | 55 | 100 |
| 60 years + | 12 | 13.8 | 75 | 86.2 | 87 | 100 |
| place of residence | ||||||
| city | 22 | 26.8 | 60 | 73.2 | 82 | 100 |
| village | 4 | 13.8 | 25 | 86.2 | 29 | 100 |
| Regional city | 6 | 17.1 | 29 | 82.9 | 35 | 100 |
| controls | ||||||
| gender | ||||||
| men | 33 | 47.8 | 39 | 41.9 | 72 | 100 |
| women | 36 | 52.2 | 54 | 58.1 | 90 | 100 |
| age | ||||||
| 18-39 years | 24 | 39.3 | 37 | 60.7 | 61 | 100 |
| 40-59 years | 35 | 42.7 | 47 | 57.3 | 82 | 100 |
| 60 years + | 10 | 52.6 | 9 | 47.4 | 19 | 100 |
| place of residence | ||||||
| City | 46 | 43.4 | 60 | 56.6 | 106 | 100 |
| village | 4 | 36.4 | 7 | 63.6 | 11 | 100 |
| Regional city | 19 | 42.2 | 26 | 57.8 | 45 | 100 |
Table 4. Distribution of smoking, sex, age and place of residence
Smokers predominated in control group (42.6%) compared to patient group (22.6%). With increasing age, a decrease in the relative share of smokers is observed.
A study of personality anxiety
Questionnaire (STAI) is an instrument for measuring anxiety, adapted from P. Paspalanov and D. Shchetinsky, 1989: as a personality trait and as a state. Values of personal anxiety are: men – 43.7; SD=9.1; women – 48.8; SD=9.6. Individuals with a mean score above these values exhibited personal anxiety. A non-parametric Kolmogorov-Smirnov test was performed for normal distribution of cases in the samples. Distribution is normal (P>0.05).
| patients and controls | |||||
| gender | mean | SD | SEM | t | p-value |
| Men patients | 44.41 | 9.16 | 1.07 | 4.50 | p<0> |
| Men controls | 43.08 | 7.13 | 0.66 | ||
| Women patients | 47.16 | 8.86 | 1.03 | 4.49 | p<0> |
| Women controls | 41.16 | 5.62 | 0.75 | ||
Table 5. Comparative anxiety parameters between patients and controls
Comparisons of mean values for anxiety in patients and controls were performed with Student-Fisher test and a significance level of P=0.05. Mean value for patients was (45.78) and for controls (42.1) (t=4.14, p<0 t=4.5, t=4.49, t=2.02, t=1.86,>0.05). Results of a group of patients showed presence of anxiety (49.3%). Of them men (53.42%), women (45.20%). In the control group (21.6%) respondents had anxiety. Of them men (23.6%), women (20.0%).
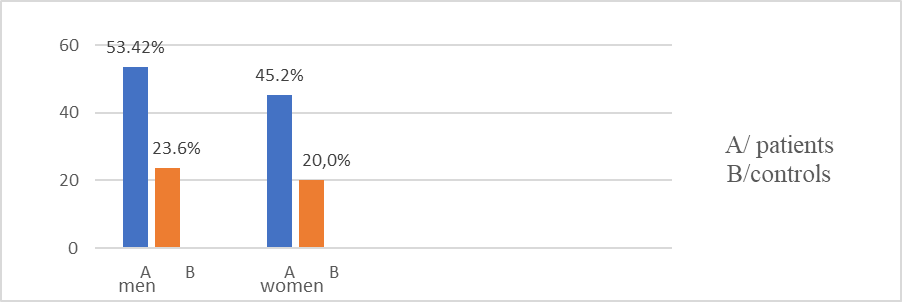
Figure 3. Distribution of patients and controls by gender and anxiety
Anxiety is present in patients living in small settlements (60%); single (56.5%); with primary education (72.2%); and pensioners (62.7%). There is an association between anxiety and place of residence (χ2=8.95, df=2, p=0.001). A relationship was established between anxiety and education (χ2=9.53, df=2, p=0.009); anxiety and employment (χ2=14.68, df=2, p=0.001); anxiety and age (χ2=9.55, df=2, p=0.008).
From an anxiety test above norm was in control group 40-59 years (20.7%) family (25.1%) with higher education (23.1%) working (22.7%) in cities (24.5%). There is no relationship between anxiety and demographics (P>0.05)
| anxiety | patients | controls | ||||
| number | р % | χ2 p-value | number | р % | χ2 p-value | |
| age | ||||||
| 18-39 years | 1 | 1.4 | χ2=9.55 p=0.008 | 11 | 18 | NS |
| 40-59 years | 19 | 26.4 | 17 | 20.7 | ||
| 60 years + | 52 | 72.2 | 7 | 36.8 | ||
| Residence | ||||||
| village | 20 | 27.8 | χ2=8.95 p=0.01 | 2 | 18.2 | NS |
| City | 41 | 56.9 | 26 | 24.5 | ||
| Regional city | 11 | 15.3 | 7 | 15.6 | ||
| Education | NS | |||||
| high | 15 | 20.8 | χ2=9.53 p=0.09 | 28 | 23 | |
| average | 44 | 61.1 | 7 | 17.9 | ||
| basically | 13 | 18.1 | 0 | 0 | ||
| Marital status | NS | |||||
| Family | 39 | 54.2 | NS | 24 | 23.1 | |
| unmarried | 13 | 18.1 | 11 | 21.2 | ||
| widower | 20 | 27.8 | 0 | 0 | ||
| Employment | ||||||
| Working | 15 | 20.8 | χ2= 14.68 p=0.001 | 32 | 22.7 | NS |
| unemployed | 5 | 6.9 | 0 | 0 | ||
| pensioner | 52 | 72.2 | 3 | 25 | ||
Table 6. Distribution of Patients and Controls by Demographic Characteristics and Anxiety
Patients with COPD and anxiety (54.7%). Of them, anxiety (97.2%); with mild COPD – (11.1%); with moderate COPD – (15.3%); with severe COPD (29.2%); with very severe COPD – (41.7%). There is a relationship between anxiety and hypertensive disease (χ2=7.6, df=1, p=0.006); between anxiety and severe COPD (χ2=4.4, df=1, p=0.03). There is no association between anxiety and other forms of COPD (P>0.05).
A study of personality traits by type D
The "D" Scale-14 questionnaire is a modern methodology for determining characteristics of the D-type personality (J. Denollet, A. Shiffer, V. Spek, 2010). Results of the study of two groups provide a basis for comparison and interpretation of an association between personality traits and COPD.
| patients | controls | |
| D personality dimensions | KS - test, p-value | KS - test, p-value |
| social inhibition | 0.91; p>0.05 | 1.23; p>0.05 |
| negative affectivity | 0.67; p>0.05 | 1.48; p>0.05 |
Table 7: Results of a non-parametric test for normal sampling frequency distribution
A parametric test of working hypothesis was performed with a significance level of P=0.05. A Student-Fisher t-test was used to compare mean values of D Personality Questionnaire responses of patients and controls. There was a statistically significant difference in mean values between patients and controls: patients (mean 23.05, SD 9.83); controls (mean 17.45, SD 6.8) (t=5.39, p<0>
A statistically significant difference was found in mean values for "social inhibition" dimension between patients (mean 10.14, SD 5.4) and controls (mean 7.44, SD 4.01) (t=4.27; p<0>
➢ A statistically significant difference was found in mean values of "negative affectivity" dimension between patients (mean 12.77, SD 6.7) and controls (mean 10.54, SD 4.4) (t=3.4; p<0>
From the personality type D questionnaire, average values of patients on dimensions "social inhibition" and "negative affectivity" were above 10, indicating manifestation of personality type D characteristics (57.5%). In the control group, average value of "social inhibition" dimension is below 10, which shows that they do not have a clearly defined type D personality (31.5%).
| patients | controls | ||||
| D personality dimensions | Mean | SD | mean | SD | t-test,p-value |
| social inhibition | 10.14 | 5.4 | 7.44 | 4.01 | t=4.27; p<0> |
| negative affectivity | 12.77 | 6.7 | 1.54 | 4.4 | t=3.4; p<0> |
| common to both dimensio | 23.05 | 9.83 | 17.45 | 6.8 | t=5.39; p<0> |
Table 8: Comparative parameters of patients and controls for the dimension D personality type
In the group of patients, a correlation was found between gender and "social inhibition" dimension (χ2=5.6, df=1, p=0.03). There is a relationship between education and "negative affectivity" dimension (χ2=6.7, df=1, p=0.03). Employment and marital status have a relationship with individuals exhibiting "negative affectivity" (χ2=7.22, df=2, p=0.02); (χ2=14.29, df=2, p=0.001). In the control group, there is an association between "negative affectivity" dimension and marital status (χ2=6.76, df=2, p=0.03)
For "negative affectivity" dimension, a value above 10 was found in (62.3%) patients, women (65.6%); men (58.8%). Relative share of patients is greatest among persons over 60 years (60%); living in villages (75.9%); with primary education (88.9%); single (81.1%); and pensioners (74.4%).
| personality type D | patients | controls | patients | controls | ||||||||
| Social inhibition | Negative affectivity | |||||||||||
N
| р %
| χ2; p-value | N
| р %
| χ2; p-value | N | р %
| χ2; p-value | N | р %
| χ2; p-value | |
| gender | ||||||||||||
| Men | 32 | 43.8 | χ2=5.6, p=0.03 | 21 | 29.2 | NS | 43 | 58.9 | NS | 33 | 45.8 | NS |
| Women | 45 | 61.5 | 17 | 18.9 | 48 | 65.6 | 43 | 47.8 | ||||
| age | ||||||||||||
| 18-39 years | 1 | 25.0 | NS | 9 | 14.8 | NS | 1 | 25.0 | NS | 29 | 47.5 | NS |
| 40-59 years | 28 | 50.9 | 24 | 29.1 | 30 | 54.5 | 39 | 47.6 | ||||
| 60 years + | 48 | 55.2 | 5 | 36.3 | 60 | 69.0 | 8 | 42.1 | ||||
| Residence | ||||||||||||
| village | 19 | 65.5 | NS | 5 | 45.5 | NS | 22 | 75.9 | NS | 8 | 72.2 | NS |
| city | 42 | 51.2 | 24 | 22.6 | 49 | 59.8 | 50 | 47.2 | ||||
| Regional city | 16 | 45.7 | 9 | 20.0 | 20 | 57.1 | 18 | 40.0 | ||||
| Education | ||||||||||||
| high | 24 | 52.2 | NS | 26 | 21.3 | NS | 25 | 54.3 | χ2=6.7, p=0.03 | 56 | 45.9 | NS |
| average | 42 | 51.2 | 11 | 28.2 | 50 | 61.0 | 20 | 51.3 | ||||
| basically | 16 | 45.7 | 1 | 100 | 16 | 88.9 | 0 | |||||
| Marital status | ||||||||||||
| family | 44 | 51.2 | NS | 24 | 23.1 | χ2=6.7, p=0.03 | 47 | 54.7 | χ2=7.72, p=0.02 | 47 | 45.2 | NS |
| unmarried | 12 | 52.2 | 10 | 19.2 | 14 | 60.9 | 26 | 50.0 | ||||
| widower | 21 | 56.8 | 4 | 66.7 | 30 | 81.1 | 3 | 50.0 | ||||
| Employment | ||||||||||||
| working | 25 | 48.1 | NS | 33 | 23.4 | NS | 22 | 42.3 | χ2=14.29, p=0.001 | 66 | 46.8 | NS |
| unemployed | 6 | 45.5 | 1 | 11.1 | 7 | 63.3 | 5 | 55.6 | ||||
| pensioner | 46 | 55.4 | 4 | 33.3 | 62 | 74.4 | 5 | 41.7 | ||||
Table 9. Distribution of Patients and Controls by Demographics and Personality Type D Characteristics
From control group, average value is over 10 for dimension "negative affectivity" in women (47.8%); men (45.8%); 40-59 years (47.6%); living in village (72.2%); with secondary education (51.3%); single (50%); and pensioners (55.6%).
Dimension "social inhibition" was evident in female patients (61.6%).Highest relative share is over 60 years (55.2%); living in villages (65.5%); single (56.8%), pensioners (55.4%). In the control group, relative share of "social inhibition" dimension is smaller (23.5%). Women are (18.9%); and men (29.1%). Largest relative share is people over 60 (36.3%); living in villages (45.5%); single (66.6%); and pensioners (33.3%).
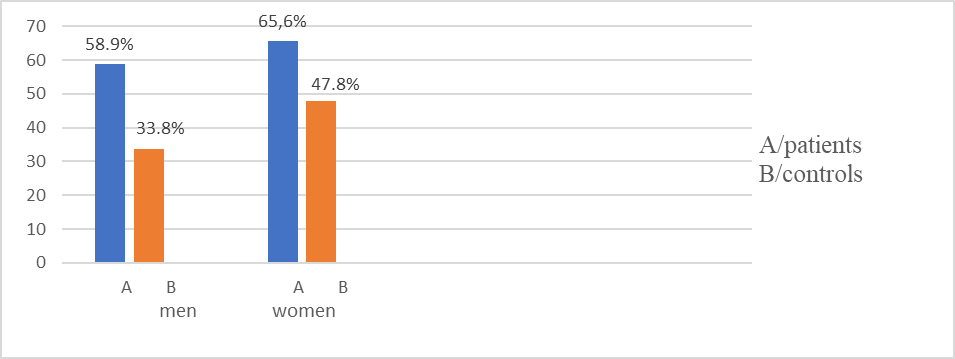
Figure 4. Comparative parameters for “negative affectivity“ dimension for patients and controls by gender
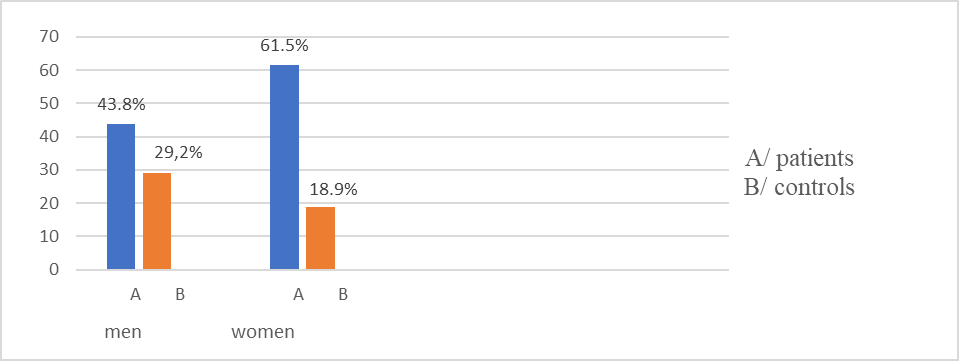
Figure 5. Comparative parameters for "social inhibition" dimension for patients and controls by gender
In the group of patients with anxiety and personality type D are (42.55%) . With anxiety and dimension "social inhibition" are (59.72%). There is a relationship between anxiety and "social inhibition" (χ2=15.90, df=1, p=0.001). Patients with anxiety and dimension "negative affectivity" (86.11%). There is a relationship between anxiety and "negative affectivity" (χ2=34.21, df=1, p=0.001). Patients with personality type D have higher levels of anxiety, more pronounced in women. Values for dimensions "social inhibition" and "negative affectivity" are (65.6%).
In the control group with anxiety and type D personality traits were (34.3%). With "anxiety" and "social inhibition" (22.9%); and with "negative affectivity" (45.7%). There is no relationship between anxiety and dimensions "social inhibition" and "negative affectivity" (P>0.05). of control group, they exhibited characteristics of "social inhibition" (23.5%).
Social adaptability
Patient group and control group answered questions on social life and coping with personal and professional commitments. Assessment is carried out on a 4-point Likert scale: weak - 1 point; low - 2 points; medium – 3 points; high - 4 points. A parametric test of working hypothesis was performed with t-criterion, at a significance level of P=0.05.
1. Question: To what extent are you coping with work and/or family commitments?
Patients showed a "high" level of coping in men (13.7%), and women (9.6%). An "average" level of coping was reported for men (13.7%), and women (20.5%) and a "low" level of coping for men (43.8%), and women (39.7%)."weakly" self-assessment of professional and family commitment for men (28.8%), and women (30.1%)
In the control group, men (41.7%), and women (47.8%) showed a "high" level of coping, a "average" level in men (50.0%), and women (48.9%) , "low" level in men (6.9%), and women (2.2%), "weakly" level men (1.4%), women (1.1%).
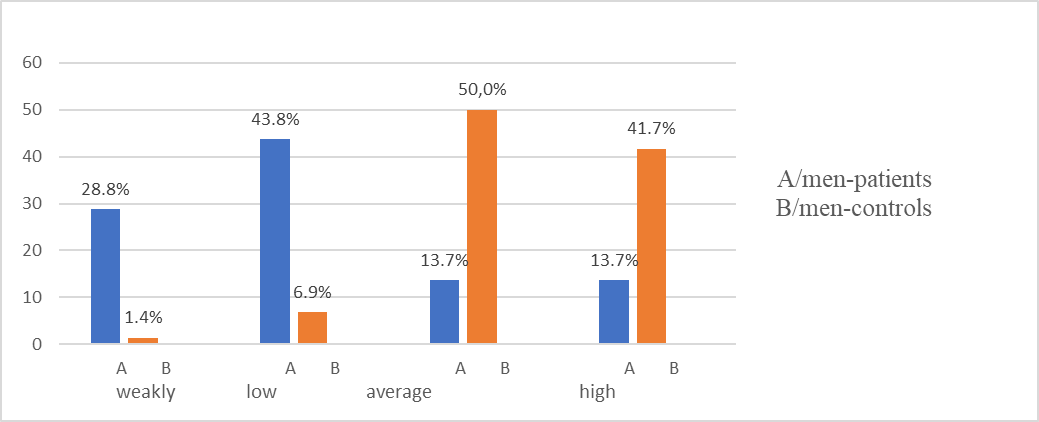
Figure 6. Comparative characteristics between male patients and controls on question: "To what extent do you cope with professional and/or family commitments
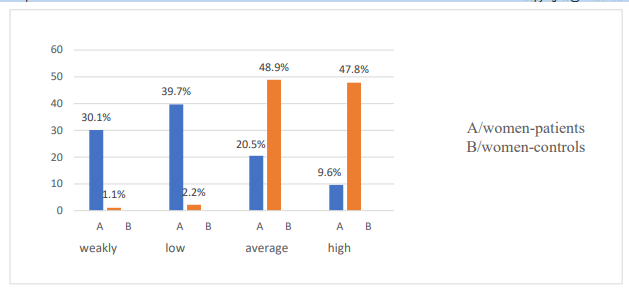
Figure 7. Comparative characteristics between female patients and controls on question: "To what extent do you cope with professional and/or family commitments?"
No relationship was found between coping abilities and demographic characteristics (P>0.05). Mean response values for patients 2.89±0.96 and control group 3.38±0.63. There was a statistically significant difference in mean response values in patients and controls (t =5.19, P<0>
2.Question: How often do you communicate with your family members?
Patients communicate with family "very often" men (1.4%), and women (4.10%), "often" communication men (8.20%), and women (11%),
"sometimes" men (57.50%), and women (50.70%), "rarely" men (32.90%), and women (34.2%).
From the control group, men (27.8%) and women (41.1%) communicate with the family "very often", "often" men (59.7%), and women (54.40%), "sometimes" men (12.50%), and women (4.40%), "rarely" men (0%), and women (0%).
There was no correlation between communication with family and demographic characteristics of two groups (P>0.05).
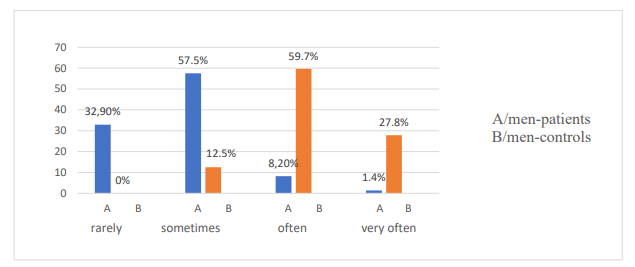
Figure 8. Comparative characteristics between male patients and controls on question: "How often do you communicate with your family members?"
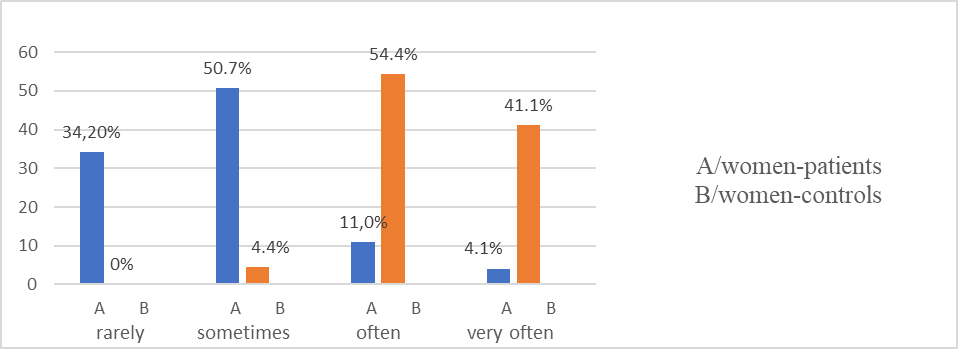
Figure 9. Comparative characteristics between female patients and controls on question: "How often do you communicate with your family members?"
3.Question: "How often do you communicate with friends, colleagues and acquaintances?"
From patients communication with friends and colleagues "Very often" men (0%)and women (1.4%). "Often" communication men (17.8%) and women (42.5%) "Sometimes" for communication with male friends and colleagues (67.1%), and women (34.2%). Communication is "rarely" for men (15.1%), and women (21.9%).
In the control group communication with colleagues and friends "Very often" men (25%), and women (30%), and women. "Often" men (52.8%), and women (58.9%) "Sometimes" men (22.2%), and women (11.1%). "Rarely" is communication for men (0%), and women (0%).
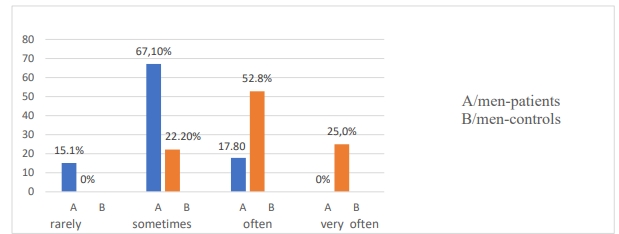
Figure 10. Comparative characteristics between male patients and controls on question: “How often do you communicate with friends, colleagues and acquaintances?”
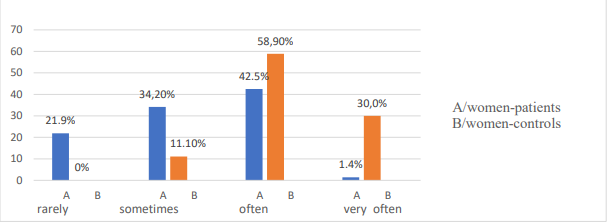
Figure 11. Comparative characteristics between female patients and controls on question: "How often do you communicate with friends, colleagues and acquaintances?"
There is a relationship between the frequency of communication with acquaintances, colleagues and friends and education (χ2=13.31, df=3, p=0.001), and with gender (χ2=17.07, df=3, p=0.001). A correlation was found between age (χ2=18.84, df=4, p=0.001); education (χ2=12.58, df=4, p=0.01); employment (χ2=14.98, df=4, p=0.005).
4.Question: "Are you able to organize your life according to your needs?"
Patients who cope "Very good " with organizing their lives are men (6.8%) and women (11.0%). Men (32.9%) and women (41.1%) have "good" organization of everyday life, "Satisfactory" men (52.1%) and women (42.5%). " Bad " self-assessment for coping men (8.2%) and women (5.5 %).
In the control group "Very good" men (23.3%) and women (19.2%), "Good" organization men (37.0%) and women (42.0%). Men (35.6%) and women (32.0%) gave a "satisfactory" rating, " Bad " organization men (4.4%) and women (6.8%).
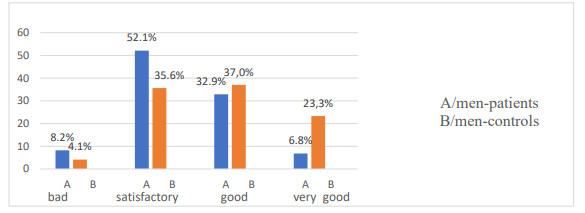
Figure 12. Comparative characteristics between male patients and controls on question: "Are you able to organize your life according to your needs?"
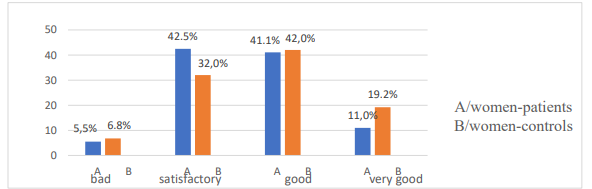
Figure 13. Comparative characteristics between female patients and controls on question: "Are you able to organize your life according to your needs?"
There is no dependence in distribution of patients and controls according to demographic indicators and organization of life (P>0.05).
Mean value of the responses in the patients was 2.52±0.71 and control group 2.96±0.62. There is a statistically significant difference (t=6.10, P<0>
5.Question "How do you define your life in last month?
Patients give "Very good" self-assessment of life men (23.3%) and women (19.2%). "Good" is t assessment of life for men (37.0%) and women (36.5%). "Satisfactory" for men (35.6%) and women (37.5%). "Bad" is the rating for men (4.1%) and women (6.8%).
In the control group, self-assessment of life is "Very good" men (23.4%) and women (23.3%), "Good" assessment in men (44.4%) and women (56.7%). Men (32.3%) and women (17.8%) indicated a "satisfactory" rating. "Bad" evaluation of life men (0%) and women (2.2%).
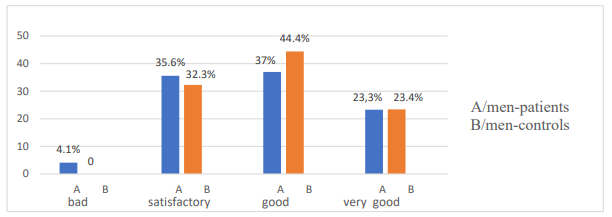
Figure 14: Comparative characteristics between male patients and controls on question:
How would you rate your life in last month?
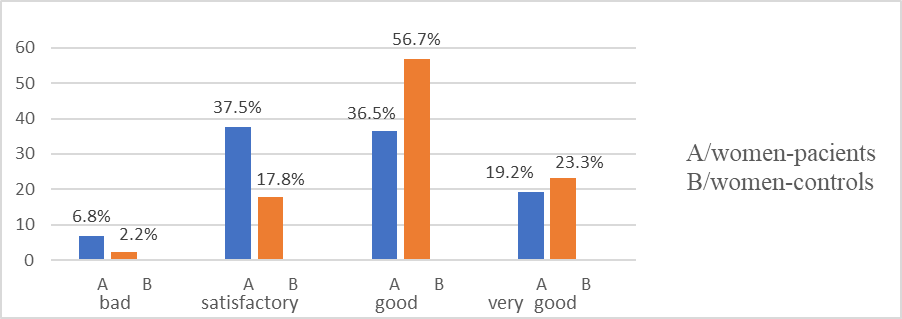
Figure 15. Comparative characteristics between female patients and controls on question: How would you rate your life in last month?"
There was no association in distribution of patients and controls by demographic indicators and self-rated quality of life (P>0.05). Mean value for patients was 2.26±0.85, for the control group 2.96±0.79. There is a statistically significant difference (t=8.14, P<0>
6.Question: Are you trying to make new social connections?
Patients for seeking new social contacts indicate "very often" men (8.2%) and women (6.8%). Men (27.4%) create new contacts "often" women (37.0%). Men (57.5%), and women (47.9%) look for new contacts "sometimes".
In the "very often" control group, men (14.8%), and women (22.2%) for making new contacts. "Often" creation of new acquaintances is reported for men (52.8%) and women (71.1%). Аnswer "sometimes" was given by men (21.6%) and women (23.5%).
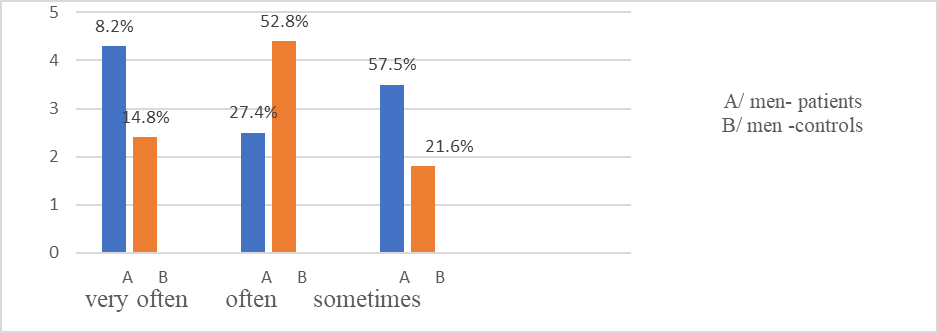
Figure 16: Comparative characteristics between female patients and controls on question: Do you try to make new social contacts?"
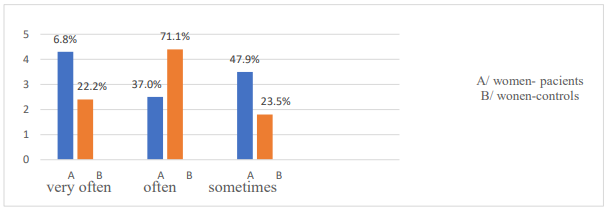
Figure 17: Comparative characteristics between female patients and controls on the question: Do you try to make new social contacts?"
Gender, age, marital status and place of residence are not factors for the realization of new social contacts in patients (P>0.05). Gender is a factor for creating new social contacts in controls (χ2=14.90, df=3, p=0.002).
Patients experience certain difficulties in creating new social contacts. Mean value of responses for patients 2.60±0.74 and control group 2.92±0.62. A parametric test was performed to compare means and there was a statistically significant difference (t-test 4.44, P<0>
Psychosocial factors, social engagement and living environment have a major impact on the quality of life of COPD patients. Anxiety has been found to be associated with some "social adjustment" problems in patients.
In patients, there is a relationship between anxiety and coping with professional and family commitments (χ2=27.21, df=3, p=0.001); communicating with friends and colleagues" (χ2=10.58, df=3, p=0.01); "organizing everyday life" (χ2=22.37, df=3, p=0.001) and "life evaluation in the last month" (χ2= 26.17 , df=3, p=0.001).
In the control group, anxiety was a factor for dealing with "family and professional activities" (χ2=11.43, df=3, p=0.01). The remaining social adjustment questions were not related to anxiety (P>0.05).
There is a relationship between anxiety and certain demographic characteristics. People who live in cities, the unemployed, and the retired have symptoms of anxiety. Anxiety negatively affects patients' social life,
coping with professional and family commitments, social communication, organization of daily life and self-assessment of health.
Health-Related Quality of Life Survey
Through the EQ-5D questionnaire, domains related to physical functioning, coping with daily activities, home and personal care, disease symptoms and psycho-emotional problems are investigated.
➢ Among the patients, there are problems with "mobility" in men (43.9%) and women (56.1%). Difficulties in mobility are present at 60+ years (75.9%) and 40-59 years (56.4%). Difficulties were found for those living in villages (82.2%), cities (64.4%), non-family (75.7%), family (56.1%); with secondary education (69.5%) pensioners (80.7%). There is a correlation between mobility and gender (χ2=4.46, df=2, p=0.03). There is a correlation between "mobility" and age (χ2=9.11, df=2, p=0.01); education (χ2=7.47, df=2, p=0.02) and employment (χ2=14.29, df=2, p=0.001).
In the control group, difficulties in "mobility" were experienced by men (19.4%), women (11.1%). The relative share of pensioners (41.7%), with secondary education (17.9%), unmarried (33.3%), living in a regional town (17.8%) is the largest. There is a relationship between mobility and age (χ2=16.7, df=2, p=0.05), with employment (χ2=7.42, df=2, p=0.03).
A statistically significant difference was found in relative proportions for mobility dimension between patients and controls: males (U=3.05; p<0 U=5.58;>
Figure 18. Relative share of patients with problems in QZS by age groups
Men (32.9%) and women (38.4%) patients have difficulties in "self-care" dimension. Over 60 years of age have difficulties (46%), living in villages (51.7%), with primary education (66.7%). Relative share of patients with self-care problems is largest among unmarried patients (48.6%) pensioners (50.6%). There is a relationship between self-care and age (χ2=10.85, df=1, p=0.004), with education (χ2=14.64, df=2, p=0.001) and with employment (χ2=21.27, df=2, p= 0.001). In the control group, there were difficulties in self-care in 1 man and 2 women, married, working and with secondary and higher education
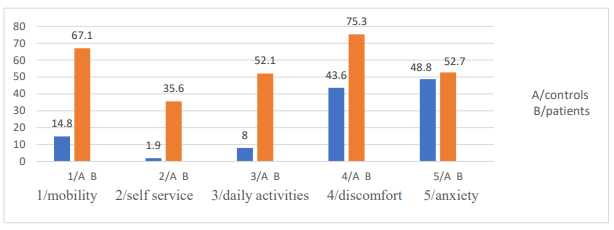
Figure 19. Distribution of patients and controls with problems by EQ-5D questionnaire dimensions
Difficulties in performing "daily activities" patients men (45.2%) and women (58.9%). Relative share of problems is greatest in patients over 60 age (65.5%); living in villages (58.7%); single (67.6%); with primary education (72.2%) pensioners (73.5%). There is an association between field "usual activities" and age (χ2=17.41, df=2, p=0.001), education (χ2=11.28, df=2, p=0.004) employment (χ2=35.48, df=2, p<0 df=2, p=0.005), df=2, p=0.003) xss=removed p=0.03).>
Рatients men (72.6%) , women (78.1%) had difficulties in "discomfort" dimension.Largest relative share is over age of 60 with difficulties (83.9%), of patients living in villages (93.1%) single (78.4%). High relative share is among persons with primary education (88.9%) pensioners (85.5%). There is a relationship between "discomfort" domain and age (χ2=11.78, df=2, p=0.003), place of residence (χ2=6.15, df=2, p=0.04), education (χ2=6.20, df=2, p=0.04) employment (χ2=13.61, df=2, p=0.001).
Difficulties in "discomfort" dimension were found men (56.9%) women (48.9%) controls. Highest relative share is found in: over 60 age (78.9%); in villages (63.6%), without partner (66.7%), with secondary education (53.8%) pensioners (91.7%). Relationship was established between "discomfort" and employment (χ2=8.13, df=2, p=0.01), with age (χ2=6.05, df=2, p=0.04). Statistically significant difference was found in relative share of "pain/discomfort" dimension between female patients and controls (U=3.13; p<0 U=1.59;>
Dimension for assessment of "anxiety". Symptoms of anxiety are present in men (57.5%), women (63%). Most difficulties are over 60 age (62.1%). Highest relative share of patients in villages (86.2%), non-family (70.3%), pensioners (68.7%) with primary education (88.9%). There is a relationship between dimension and age (χ2=6.24, df=2, p=0.04), place of residence (χ2=13.74, df=2, p=0.005) marital status (χ2=10.38%, df=2, p=0.006 ).
Controls, problems in " anxiety " dimension in men (56.9%) women (48.9%). Relative share is largest over 60 age (68.4%), in villages (54.5%), unmarried (83.3%), with secondary education (56.4%), pensioners (75%). Association was found between dimension and age (χ2=6.36, df=2, p=0.04). There was no statistically significant difference in relative proportions for "anxiety/depression" dimension between patients and controls: men (U=0.30; P˃0.05), women (U=1.75; P˃0.05)
| patients | controls | ||||
| EQ-5D dimensions | age | number% | χ2, р-value | number% | χ2, р-value |
mobility
| 18-39 years | 1.25 | χ2=9.11, p=0.01 | 4/6.6 | χ2=10.67, p=0.005 |
| 40-59 years | 31/56.4 | 13/15.9 | |||
| 60 years + | 66/75.9 | 7/36.8 | |||
| self service | 18.39 years | χ2=10.85, p=0.004 | |||
| 40-59 years | 12/21.8 | 3.37 | |||
| 60 years + | 40/46 | ||||
| usual activities | 18-39 years | χ2=17.41, p=0.001 | 2/3.3 | χ2=10.53, p=0.05 | |
| 40-59 years | 19/34.5 | 6/7.3 | |||
| 60 years + | 57/65.5 | 5/26.3 | |||
discomfort | 18-39 years | 1.25 | χ2=11.78, p=0.003 | 30/49.2 | χ2=6.05, p=0.04 |
| 40-59 years | 36/65.5 | 40/48.4 | |||
| 60 years + | 73/83.9 | 15/78.9 | |||
| anxiety | 18-39 years | χ2=6.24, p=0.04 | 23/27.7 | ||
| 40-59 years | 34/61.8 | 43/52.4 | |||
| 60 years + | 54/62.1 | 13/68.4 | |||
Table 10. Distribution of Patients and Controls by Age and Difficulty in Health-Related Quality of Life Dimensions
Relative share of patients with difficulties in spheres of quality of life is largest among pensioners, over 60 age, those living in villages, with primary education and unmarried. Control group, relative proportion with quality of life problems was lower.
Health assessment by visual analogue scale (VAS)
Mean value of self-rated health, on a scale of 0 to 100 was (52.74, SEM 1.69) points for patients and (78.56, SEM 0.96) points for control group. Statistically significant difference was found in mean values between patients and controls (t=13.5, p=0.001). There was a statistically significant difference between male patients and controls (t=7.7, p<0 t=10.82,>0.05).
| Health assessment | Mean | SD | Mean | SD | t-test, p-value |
| men | 53.97 | 20.05 | 75.03 | 11.95 | 7.7, p<0> |
| women | 51.51 | 21.06 | 81.38 | 11.77 | 10.82,p<0> |
Table 11. Comparative health assessment parameters by gender in patients and controls, by VA
Average values for health status of two age groups differ. As age increases, health assessment decreases in patients. Controls, health score was higher in all age groups, decreasing more smoothly with age. There is a statistically significant difference between health score and age of patients (Kruskal Wallis =22.72. df=5,p=0.001) 0.001)
| patients | controls | |||||
| age | mean | SD | Std.Error | mean | SD | Std.Error |
| 18-39 years | 70.06 | 18.25 | 9.12 | 80.25 | 11.94 | 1.53 |
| 40-59 years | 59.09 | 20.20 | 2.72 | 78.20 | 12.35 | 1.36 |
| 60 years + | 47.93 | 19.89 | 2.13 | 71.47 | 8.70 | 1.99 |
Table 12. Mean values of health assessment of patients and controls by age group, using VAS
As age increases, patients' assessment of health decreases. Pearson correlation coefficient was calculated (r= 0.369). Rank estimate of correlation coefficient indicates an inverse moderate relationship. For controls, relationship between two variables is inversely significant (r= 0.569).
Dependence between anxiety, type D personality and quality of life
➢ Patients with personal anxiety and problems in "mobility" dimension (61.2%). Controls, there were (16.7%). There is an association between anxiety and "mobility" dimension in patients (χ2=16.91, df=2, p=0.001).
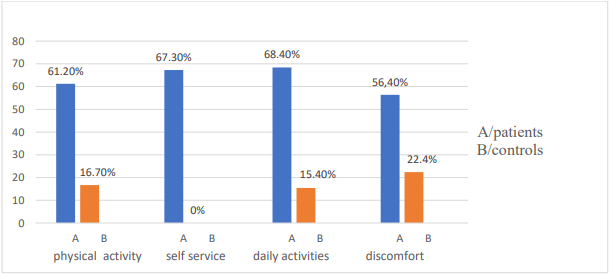
Figure 20. Distribution of patients and controls with anxiety and difficulties in domains related to quality of life
Parametric test of working hypothesis was performed with a significance level of p=0.05. There is a statistically significant difference in relative proportions of patients and controls who exhibit anxiety and difficulties in physical activity (U=4.91; p<0>
There are (67.3%) patients with difficulties in field of "self-care" and showing anxiety. Controls with such problems are missing. There is an association between anxiety and self-care capabilities in patients (χ2=10.46, df=1, p=0.001).
There are (68.4%) patients who have difficulties in performing "daily activities" and with established anxiety. Controls with same problems, there were (15.4%). There is a relationship between anxiety and dimension "daily activities" in patients (χ2=23.15, df=1, p<0 U=4.68;>
There are (56.4%) patients with COPD showing anxiety and difficulties in "pain/discomfort" dimension (22.4%) were controls. Anxiety was a factor for presence of pain/discomfort in patients (χ2=8.86, df=1, p=0.002). There was a statistically significant difference in relative proportions of patients and controls with anxiety and pain/discomfort (U=5.2; p<0>
| anxiety patients | anxiety controls | ||||
| Dimensions of QZ | number % | χ2, p-value | number % | χ2, p-value | U- criterion |
| mobility | 60 (61.2%) | χ2=16.91 p=0.001 | 4 (16.7%) | NS | 4.91 |
| Self service | 35 (67.3%) | χ2=10.46 p=0.001 | 0 | NS | |
| Daily activities | 52 (68.4%) | χ2=23.15 p=0.001 | 2 (15.4%) | NS | 4.68 |
| Discomfort | 62 (56.4%) | χ2=8.86 p=0.002 | 19 (22.4%) | NS | 5.2 |
Table 13. Distribution of patients and controls with anxiety and problems in quality of life dimensions
Anxiety is a factor influencing the quality of life in patients with COPD. In them, a tendency to avoid physical activity, an increase in the severity of somatic symptoms and the emotional meaning of disease was found. Two dimensions of Type D personality and domains of the Quality of Life Questionnaire/QL/EQ-5D were analyzed. There is an association between patients exhibiting Type D personality traits and having difficulties in quality of life dimensions.
| Type D personality | ||
| EQ-5D - dimensions | Negative affectivity | Social isolation |
| Physical activity | χ2=13.0 df=1 p=0.001 | χ2=20.44 df=1 p=0.001 |
| Self service | χ2=7.32 df=1 p=0.007 | χ2=3.76 df=1 p=0.052 |
| Daily activities | χ2=21.71 df=1 p=0.001 | χ2=16.66 df=1 p=0.001 |
| Discomfort | χ2=11.18 df=1 p=0.001 | χ2=8.51 df=1 p=0.003 |
Table 14. Dependence between dimensions of type D personality and QOL in patients with COPD
Symptoms of patients with COPD have a negative impact on the quality of life. Patients show difficulties in physical activity. Reduced physical activity has a negative impact on self-care, daily activities, and self-assessment of health, prevailing among single people, in small settlements and with lower education. Combination of anxiety and D personality traits is associated with impaired quality of life and lower self-rated health. Compared to control group, they had fewer difficulties in the investigated areas of quality of life. No relationship was found between the domains of quality of life and the two dimensions of type D personality in control group (p>0.05).
When examining relationship between anxiety, type D personality and patients health assessment, established odds ratio showed that patients with type D personality had a 2.94 times greater risk of disease progression (OR 2.94 (95% CI) 1.84-4.71, P<0>
|
Table 15. One-factor regression models for the influence of anxiety and type D personality
Psychosocial factors were analyzed by multivariate regression analysis. Reduced assessment of quality of life and health is due to influence of personality type D and personality anxiety (R²=0.647, P<0 R²=0.511,>
✓ In patients, a relationship was established between dimension "mobility" and dimensions "self-care" and "usual activities" from a quality of life test. Between "mobility" and "self-service" the rank estimate of correlation coefficient is a direct significant relationship (r=0.568). Relationship between "mobility" and "usual activities" is quite significant (r=0.610). Between "mobility" and "discomfort" is quite moderate (r=0.480).
✓ Between "self-care" and "daily activities" dimensions, the rank evaluation of correlation coefficient is a straight significant relationship (r=0.624). Between "self-care" and "discomfort" relationship is straight moderate (r=0.443). Between "habitual activities" and "discomfort" relationship is straight moderate (r=0.451).
✓ In patients, the relationship between "mobility" and "general health" is inversely significant (r=-0.520). Correlation between "mobility" and "health" is inversely significant (r=-600). Relationship between "self-care" and "health" is inversely moderate (r=-0.497). With a decrease in mobility, possibility of self-care and performing daily activities decreases. In the control group, relationship between dimension "mobility" and "self-care" is straight moderate (r=0.33, p<0 r=0.32,>
✓ Pearson's correlation coefficient was calculated (r=-0.492). Anxiety values increase, patients' health score decreases. Relationship between "anxiety" and "health rating" is inversely moderated. In control group, relationship between "anxiety" and "health assessment" is inversely weak (r=-0.155). Anxiety values increase, patients' health score decreases.
✓ Spearman's correlation coefficient was calculated between dimensions of quality of life and personality anxiety. Relationship between anxiety and investigated domains of quality of life is moderate: anxiety and mobility (r=0.481); between anxiety and self-care (r=0.390); between anxiety and daily activities (r=0.555); anxiety and discomfort (r=0.423). Higher scores for anxiety are reflected in increased problems in the examined dimensions of quality of life.
| anxiety | personality type D | general health | mobility | self service | usual activities | pain | |
| anxiety | 1.000 | 0.395 | -0.492 | 0.481 | 0.390 | 0.555 | 0.423 |
| personality type D | 1.000 | -0.221 | 0.233 | 0.267 | 0.251 | 0.332 | |
| general health | 1.000 | -0.520 | -0.497 | -0.600 | -0.386 | ||
| mobility | 1.000 | 0.568 | 0.600 | 0.480 | |||
| self service | 1.000 | 0.627 | 0.443 | ||||
| usual activities | 1.000 | 0.455 | |||||
| discomfort | 1.000 |
Table 16. Correlation coefficients of the influence of anxiety and type D personality on health and quality of life dimensions
✓ There is an inverse weak correlation between health assessment and type D personality in patients (r=-0.221). With higher values for personality type D, health score decreases. Relationship between dimension "negative affectivity" and health is inversely moderate (r=-0.464), and between the dimension "social isolation" and health is inversely weak (r=-0.224). As values for D personality expression increase, health score decreases. In controls, there was no relationship between health score and two D personality dimensions (P>0.01).
✓ A correlation was calculated between personality type D and anxiety in patients. Relationship is moderate (r=0.395). Between dimension "negative affectivity" of type D personality and anxiety, relationship is directly significant (r=0.685), and between dimension "social isolation" and anxiety (r=0.560). As D personality values increase, so does patient's level of anxiety. There is a weak correlation (r=0.259) between dimension "negative affectivity" and age of patients. With increasing age, values for this sphere also increase. Controls, no correlation was found between type D personality on both dimensions and anxiety (P>0.01).
Tested hypothesis about the factors that influence quality of life is confirmed. Anxiety and Type D personality are thought to be interrelated. Higher values of personality dimensions D influence the expression of personality anxiety. Anxiety and Type D personality have been hypothesized to negatively influence the health assessment and quality of life of COPD patients. Obtained results confirm the expectations that the stronger expression of dimensions "negative affectivity" and "social inhibition" are related to higher levels of personal anxiety. From the correlation analysis, it can be concluded that personal anxiety, negative affectivity and social isolation are interconnected in manifestations of personal factors leading to a change in quality of life of patients with COPD. Discussion of results highlighted issues related to impact of COPD on psychosocial sphere of patients' lives. Anxiety and limitations in physical activity are associated with manifestations of negative affectivity and social inhibition (personality type D). Outlined trends of personal and psycho-social manifestations are directly related to assessment of quality of life and have an impact on the spheres of life: physical activity; coping with daily activities; professional commitments; home and family care. Gender, place of residence and education do not influence the attitude towards healthy behavior (P>0.05). Place of residence was not a factor for better health awareness and ability to cope with daily problems related to the disease (χ2=9.45, p=0.15). Low physical activity was found in patients living in larger settlements, with secondary education and pensioners. There were significant differences in terms of active lifestyle between patients and controls. Personality predisposition is associated with higher levels of anxiety, difficulties in mobility, self-care, performing daily activities, and low self-esteem of personal health. Determinants of the quality of life in patients with COPD are: age, marital status, professional commitment, education, severity of main disease, personal characteristics. A lower self-assessment of quality of life is observed in elderly patients, unmarried, unemployed, with secondary education. Patients with higher education and professionally engaged are more responsible for their health, as well as people over 60 years old. Self-reported coping with work and family commitments was lower in patients. Problems in social life are expressed in limitations in communicating with family and friends, creating new social contacts, coping with routine activities, organizing daily life and other activities. Reduction of the main risk factors (smoking, low physical activity, etc.) leads to a reduction in morbidity. Results of pilot study confirm the influence of psycho-social factors on quality of life of patients with COPD. The analysis of the results for the quality of life and psycho-social risk factors leads to the differentiation of patients with a specific personality predisposition, low self-assessment of quality of life and problems in social adaptation. Research data show that patients have a high level of manifest anxiety.
Dear Editorial Team, Clinical Medical Reviews and Reports. My experience with the journal was highly positive. The peer-review process was rigorous, constructive, and completed in a timely manner. The reviewers provided valuable comments that helped improve the quality and clarity of our manuscript. The editorial office was professional, responsive, and supportive throughout all stages of the publication process. Communication was clear and efficient, and any questions were addressed promptly. Overall, I found the journal to maintain high scientific standards and an excellent publication workflow. I would be pleased to consider submitting future work to this journal. Best wishes from, Elena Popa.

It was my pleasure to submit my testimonial concerning the Reviewer Board of our Scientific Journal “Brain and Neurological Disorders”. The Reviewers focused on some modifications and their contribution was helpful. The ladies of our Editorial Office were also supported my efforts. It was my honor to have such a co-operation and I am looking forward for more collaboration.

Dear Grace Pierce, Editorial Coordinator of Journal of Clinical Research and Reports, Thank you for the speedy and efficient peer review process. I appreciate the fact that your peer reviewers do not take months to respond like with some other journals. I would also like to thank the editorial office for responding quickly to my questions. It is an excellent journal. I plan to submit more manuscripts in the future. Best wishes from, Robert W. McGee

Dear Grace Pierce, Editorial Coordinator of Journal of Clinical Research and Reports, Working with you and your team on our recent publication in JCRR has been a truly wonderful and enjoyable experience. The responses were prompt, and the reviewers were patient, constructive, and highly professional. One reviewer in particular gave me the feeling that a professor was carefully reading and commenting on my coursework, which was deeply touching. The entire process was straightforward and hassle‑free, with no tedious online forms to complete. I highly recommend this journal. Best wishes from, DR Aibing Rao, Head of R&D

I Appreciate the Opportunity to Share my Experience with the Journal of Clinical Research and Reports. The peer review process was timely and constructive, and the feedback provided helped improve the quality of our manuscript. The editorial office was professional, responsive, and supportive throughout the process, ensuring smooth communication and efficient handling of the submission. Overall, it was a positive experience collaborating with your team.

Dear Mercy Grace, Editorial Coordinator of Obstetrics Gynecology and Reproductive Sciences, We would like to express our gratitude for your help at all stages of publishing and editing the article. The editors of the magazine answer all the necessary questions and help at every stage. We will definitely continue to cooperate and publish other works in the Obstetrics Gynecology and Reproductive Sciences! Best wishes from, Alla Konstantinovna Politova,
