
Research Article | DOI: https://doi.org/10.31579/JHV-2021/001
*Corresponding Author: S. M. Debbal, Genie-Biomedical Laboratory (GBM), Department of Electronics, Faculty of Technology, University of Aboubekr Belkaid, Algeria.
Citation: S. M. Debbal, Hamza L. cherif and Meziani F. (2021) Heartbeat cardiac sounds signals analysis by using the energy envelogram J. Heart and Vasculature 1(1); DOI:10.31579/JHV-2021/001
Copyright: © 2021, S. M. Debbal, This is an open access article distributed under the Creative Commons Attribution License, which permits unrestricted use, distribution, and reproduction in any medium, provided the original work is properly cited.
Received: 23 January 2021 | Accepted: 15 February 2021 | Published: 27 February 2021
Keywords: phonocardiogram; heart sounds; heart murmurs; segmentation; algorithm; low pass filter; threshold; shannon energy envelogram
Many pathological conditions of the cardiovascular system cause murmurs and aberrations in heart sounds. Phonocardiography provides the clinician with a complementary tool to record the heart sounds heard during auscultation.
The advancement of intracardiac phonocardiography, combined with modern digital processing techniques, has strongly renewed researchers’ interest in studying heart sounds and murmurs.
Heart sounds and murmurs provide crucial diagnosis information for several heart diseases such as natural or prosthetic valve dysfunction and heart failure, which need to isolate the cardiac pathologies whether murmurs or superimposed sounds to the heart sounds in order to better appreciate their durations to can be processed more easily.
This paper presents an algorithm for the detection of heart sounds (the first and second sounds, S1 and S2) and heart murmurs. This algorithm is based essentially on the low pass filtering in order to eliminate the heart murmurs.
The normalized average Shannon Energy envelogram is detected in order to delimit the beginning and end of each heart sound with a threshold set from the maximum value of the envelope, the location of the heart sounds S1 and S2 will enable us thereafter to extract the heart murmurs using a threshold selection of them.
This paper do cover the main aspects of the research work and is of interest to the cliniciens and readers.
Under normal conditions, the heart provides two major audible sounds (S1 and S2) for each cardiac cycle. Two other sounds (S3 and S4), with lower amplitude than S1 or S2, appear occasionally in the cardiac cycle by the effect of diseases or age [1].
The first heart sound S1, corresponding to the beginning of ventricular systole, is due to the closure of atrioventricular valves, however the second heart sound, marking the end of ventricular systole and signifying the beginning of the diastole [2].
Noninvasive study (diagnosis) methods such us phonocardiogram (PCG) offer useful information of functioning heart. In auscultation, the listener tries to analyze the heart sound components separately and then synthesize the heard features. Heart sound analysis by auscultation highly depends on the skills and experience of the listener [3].
Therefore, the recording of heart sounds and analyzing them by a computerized and objective way would be most desirable. It is then a support of information to value by digital processing in order to better appreciate the pathologies to can be processed more easily. The energy of the PCG signal can prove therefore very important in the study of the cardiac cycle [4].
In the time domain, such representation allows us to appreciate the length of each heart sound, systolic and diastolic phases and the cardiac cycle. Time-frequency analysis and classification of the PCG signals have been studied by several authors [5]. Before any automatic analysis can be done, the PCG signal needs to be segmented into components (sounds or murmurs), and then the components are analyzed separately.
Once these are detected, diagnostic features may be subsequently extracted for each type of sound. However, S1, S2 and murmurs sounds detection is one of the major and most difficult problems in heart sound analysis.
Some attempts to segment the PCG signal have been reported in the literature, but the majority of them depend on ECG signal or/and carotid pulse, as references [6] but a major disadvantage of this approach is that the timing between electrical and mechanical activities in a cardiac cycle will not be exactly constant for all patients because of a variety of pathological conditions (Haghighi-Mood and Torry) [7].
The purpose of this study is to develop an algorithm for heart sound and heart murmur segmentation which uses the PCG signal as the sole source. PCG signals have internal components of very close frequency bands. Fast Fourier transform (FFT) provides valuable frequency information, but the timing information is lost during the transformation process [8].
It is observed also that wavelet transforms have been frequently used to extract features from heart sounds [9, 10]. Dinesh Kumar et al. segmented the heart sounds (S1 and S2) by using wavelet decomposition simplicity filter [9]. Liang et al. segmented the HSs based on heart sound envelogram [6].
As an envelogram, normalized average Shannon energy was used. In this study, HSs were divided into four different groups: First heart sound (S1), systolic period, second heart sound (S2) and diastolic period.
The proposed approach to isolate the components of the PCG signal consists in separating the heart sounds S1 and S2 of heart murmurs using a low pass filter. The normalized envelope of Shannon Energy is calculated to delimit the beginning and end of each of heart sounds using a fixed threshold from the maximum value of the envelope which allows to determinate their average duration.
An adaptative threshold is used in order to discriminate the heart murmurs from heart sounds (S1 and S2).
The algorithm of separation or segmentation was applied hear for the
separation of the heart sounds S1 and S2 using the first part of the proposed algorithm. The second part of this analysis details the separation of the heart murmurs of pathological PCG signals using the second part of the proposed algorithm.
The organigram given by Figure 1 describes the different steps of the algorithm for segmentation of heart sounds . The methods proposed and used do provide more details for the utilisateurd to repeat the experiments.
Pre-processing
The recorded signals were first preprocessed before performing envelope extraction and segmentation. Heart sound signals were normalized according to Eq. (1) as shown below:
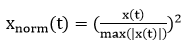
Where x (t) is the original signal. The square operation aims to make peak signal more prominent while weaken the noise.
Separation of heart sounds S1 and S2
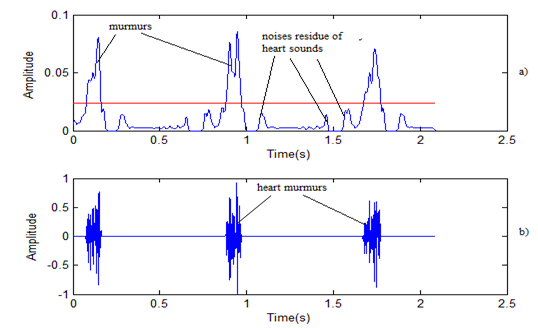
The insulation of the heart sounds for the heart murmurs is based on the frequency behavior of the PCG signal; the heart sounds (S1 and S2) are considered as low frequency and noise superimposed (murmurs or clicks) considered as high frequency figure 2.
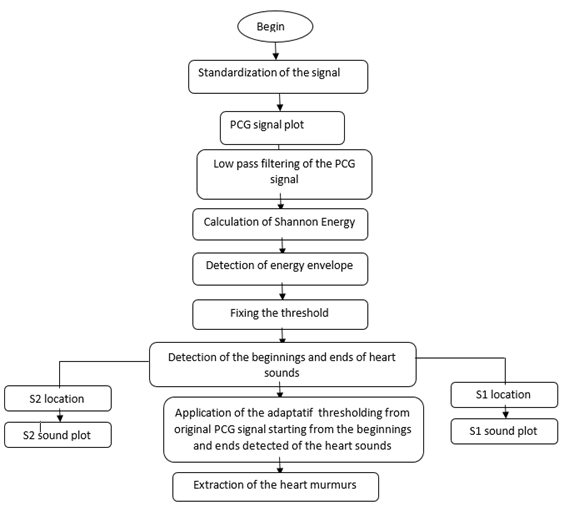
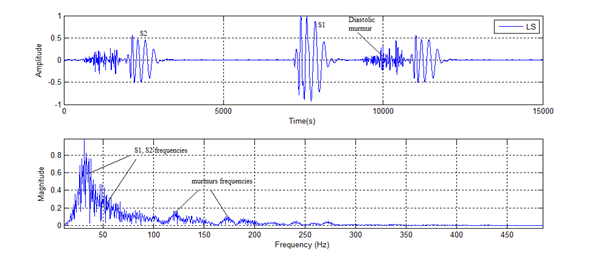
Remark here that the frequencies that are less than 100HZ whose the amplitude is very high are corresponding to the heart sounds S1 anS2, however the low frequencies whose the amplitudes is reduced are corresponding to the heart murmurs. This made that a low pass filter of FIR type with a cut-off frequency of 100HZ is necessary to eliminate the murmurs that are considered as high frequencies.
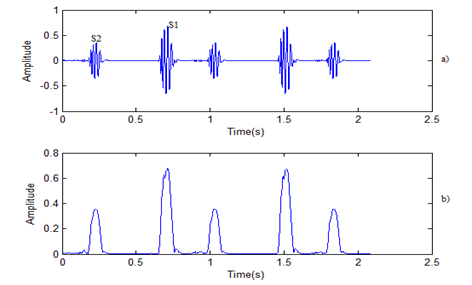
In order to locate the moments of beginnings and ends of the heart sounds, the envelope detection of the PCG signal is necessary.
Detection of the envelope of the PCG signal: Study of Energy
The square of the samples of a given signal [Eq. (1)] makes it possible to evaluate its energy in the temporal field. However, and as illustrated in Figure 1, samples of highamplitude are very heavily favored over those of low amplitude. The amplitude of the energy calculated by the absolute value [Eq. (2)] of the samples of the signal also disadvantages samples of low amplitude. Similarly, the Shannon entropy [Eq. (3)] does not yield the true proportions of the signal, attenuating more samples of very low amplitude for the benefit of large-amplitude oscillations.
The Shannon energy [Eq. (4)] proves the median approach, making it possible to generate a representation that takes account of the physiological attenuation of heart sounds as well as artifacts of large amplitude while recording the PCG signal.
E = s(t)2 (1)
E = |s(t)| (2)
E = -|s(t)| . log |s(t)| (3)
E = -s(t)2. log s(t)2 (4)
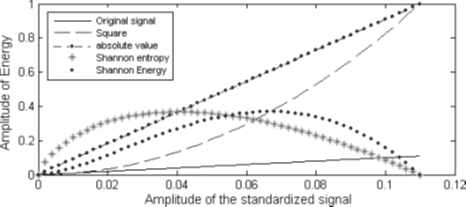
Energy representations of the PCG signal [Figures. 2(b)–2(e)] highlight the relevance of the choice of the Shannon energy. According to these figures, we can see that only the Shannon entropy and the Shannon energy can absorb the magnitude of oscillations of high intensity as well as those in low amplitudes.
The square and the absolute value of the signal samples promotes oscillations of high amplitude more than those of low amplitude. Note that the shape of the curve of the Shannon energy promotes weak oscillations, which will give energy representations that take into account the unit of the heart sounds and heart murmurs.
To improve this beneficial effect, we can standardize or normalize this energy. The average Shannon energy is standardized by the following relationship:
En = E-M/std (5)
Where E is the Shannon energy, m is the average value of energy E of the signal, std is the standard deviation of energy E of the signal, and En is the average Shannon energy standardized or normalized.
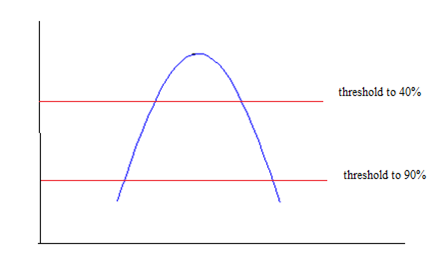
Based on the envelogram calculated by the normalized average Shannon energy, a threshold (T1) is set starting from maximum value according to the operator choice to eliminate the effect of noise and very low- intensity signal. The application of this threshold will also enable us to detect the side minima of each peak of the envelope, the moments of these points will be determined later to be able to locate heart sounds.
The choice of threshold is very important in order to have interesting results. The duration of the heart sounds may change if the choice of threshold is not taken into account (see Figure 7). The choice of threshold is also important for detection of the heart murmurs that will be extracted from the beginnings and ends of the heart sounds (see Figure 9).
It is known beforehand that the duration of systole is shorter than that of the diastole. Based on this reality, the identification of sound S1 and S2 can be performed.
Extraction of the heart murmurs
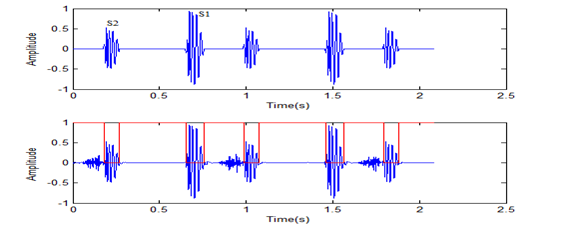
From the beginnings and ends of the heart sounds detected previously, we will introduce a selection threshold (T2) on the originalPCG signal such as:
Threshold = 0; if beginning (i) ≤ t ≤ end (i)
Threshold = 1; outside i is the heart sound S1 or S2
This selection threshold allows us to extract the heart murmurs and reject all the heart sounds as shown in the following figure:
Calculating of energy envelope of the signal resulting allow us thereafter to localize the heart murmurs by means of a new fixed threshold (T3) from the maximum value of the envelope of the result signal.
This threshold allows also eliminating the effect of noises which are due to the threshold (T1) value fixed previously. Then to obtain the reliable results we must well choose the threshold value which allows determining the beginnings and ends of the heart sounds S1 and S2 (see Figure 9).
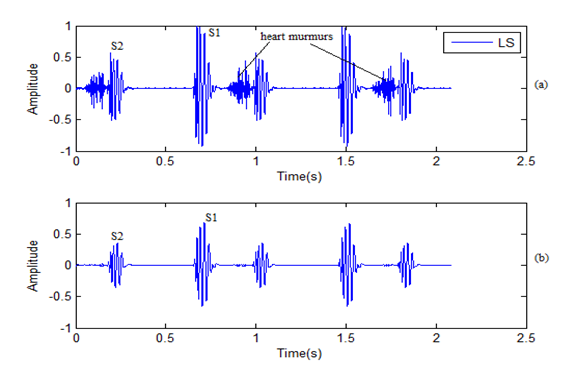
The aim of this paper is to separate heart sounds and murmurs in order to assess their duration and that of the cardiac cycle. The algorithm of separation elaborated was applied to several pathological PCG signals.
It consists to separate the heart sounds S1 and S2 (using the first part of the proposed algorithm) and consequently extract the heart murmurs (using the second part). Figure 10-11 gives the results of this segmentation of PCG signals with clicks (OS) and with systolic murmurs (PAS).
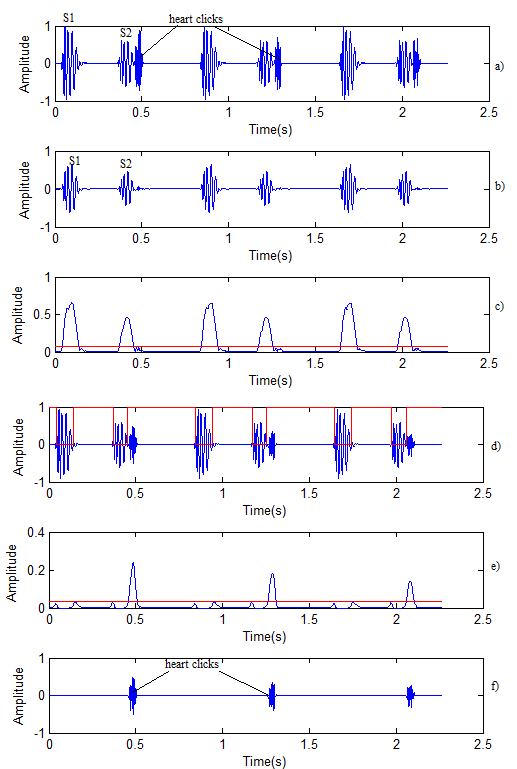
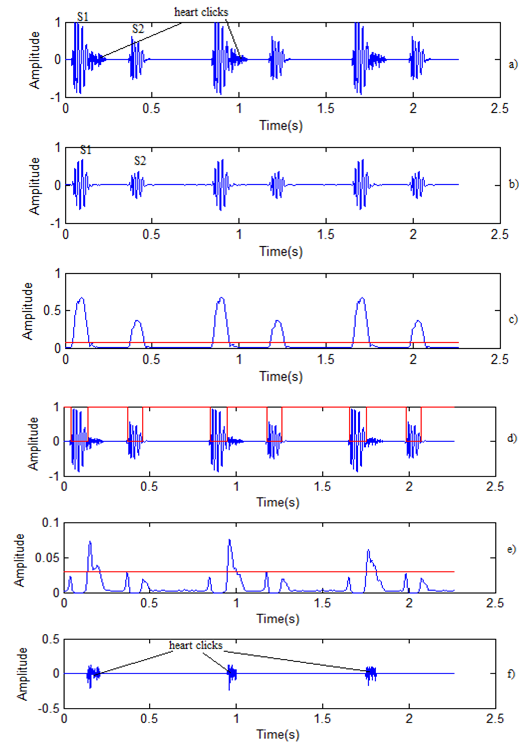
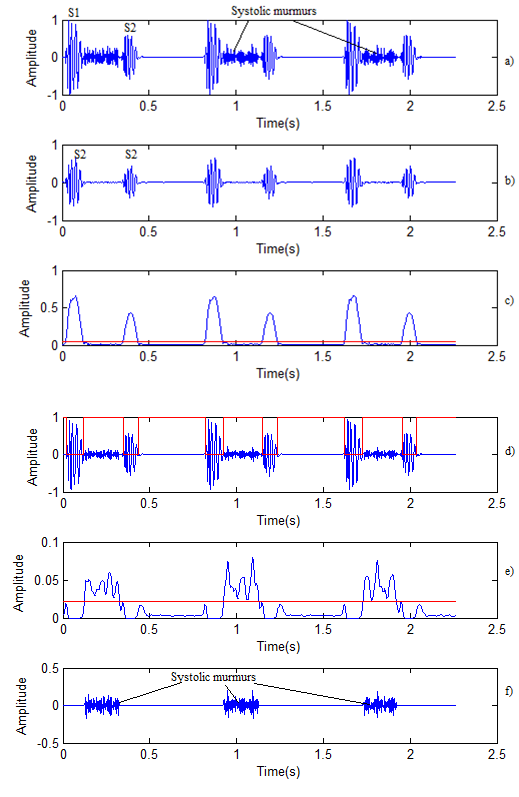
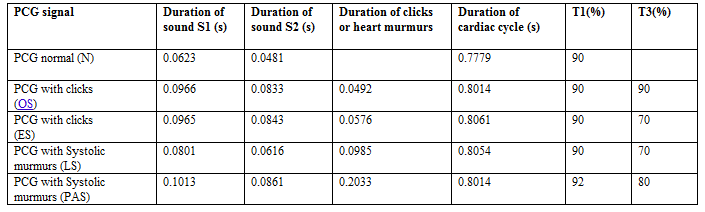
Table 1 gives the results of segmentation for pathologic PCG signals: with clicks (OS, ES), and systolic murmurs (LS, PAS). T1 is the threshold used to detect the heart sounds and T3 is used to detect the clicks or murmurs.
According to Table 3, the duration of the heart sound S1 is always higher than the duration of the heart sound S2 for all studied PCG signals. The activity of filling of blood in the myocard as well as the ejection of blood during the heart sound S1 lasts longer than the second sound S2. The duration of each heart sound appears proportional to the quantity of ejected blood.
Note also thatthe click is brief. The durations of the heart sounds (S1,S2) of all studied signals were significantly higher compared tonormal PCG signal;this may be due to the disease itself. The point that we can make here is that the cardiac cycle length varies with the presence of pathological heart sounds.
Comparison with other methods
In the context of analyzing other methods above, some attempts to segment PCG signal it is observed that the low pass filtering have been frequently used but to detect only the heart sounds S1 and S2 [10]. Hamza Cherif et al. present segmentation algorithm of heart sounds and heart murmurs using Shannon Energy envelope, which is based on detection of the side minima of each peak of the energy envelope by applying an empirically fixed threshold starting from the maximum value, and then detection of the moments of these points and consequently localization of the heart sounds.
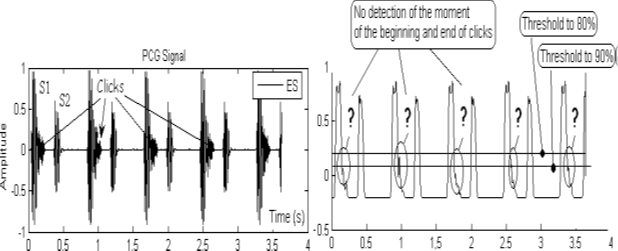
The separation of the heart murmurs consists firstly in detecting the sound S1 or S2 with the murmur and similarly to the separation of heart sounds; the isolation of the murmur for the sound can be realized [10]. However, the problem here is that every heart murmur or click has a different morphology, making it difficult to address all of the PCG signals suggested. Figure 13 illustrates an example of this type of difficulty encountered. It shows the limits of the algorithm of separation of heart clicks on a PCG signal with clicks (early systolic, ES). It is noted that if one does not have a location of the start and end moments of heart clicks [10], and even if we change the threshold of the energy envelope, we will not have satisfactory results.
The results do refer to the Figures in a logical order. The numbers in the table do add up correctly. The figures and Tables are not mislabeled.
The algorithm for separating heart sounds that we have developed allows segmenting the PCG signal and calculating then different temporal parameters: the durations of heart sounds S1 and S2 and heart rate. Heart segmentation should be done, as it is essential for the diagnosis of heart sounds and murmurs; we can easily extract the features of each component of the PCG signal.
The detection of heart sounds is based primarily on the low-pass filtering of the PCG signal and their localization requires the Shannon Energy envelope detection which reduces the effect of low noise and provides a smooth envelope. Subsequently, from this we can easily extract completely the heart murmurs. The choice of thresholds (T1 and T3) is important so as to have interesting results; the duration measure of heart sounds or murmurs may change if the choice of threshold is not taken into consideration.
Compared with the work carried out by other authors, the proposed algorithm for segmentation of PCG signals gives good performance, it is able to not only separate the fundamental heart sounds S1 and S2, but also separate heart clicks or murmurs with good resolution.
The objectif of this paper is to separate heart sounds and murmurs in order to assess their duration and that of the cardiac cycle. The algorithm of separation elaborated was applied to several pathological PCG signals and the algorithm for separating heart sounds allows segmenting the PCG signal and calculating then different temporal parameters such as the durations of heart sounds S1 and S2 and heart rate. Also the heart segmentation should assessed for the diagnosis of heart sounds and murmurs and the proposed algorithm for segmentation of PCG signals gives good performance and is able not only separate the fundamental heart sounds S1 and S2 but also separate heart clicks or murmurs with good resolution.
Dear Editorial Team, Clinical Medical Reviews and Reports. My experience with the journal was highly positive. The peer-review process was rigorous, constructive, and completed in a timely manner. The reviewers provided valuable comments that helped improve the quality and clarity of our manuscript. The editorial office was professional, responsive, and supportive throughout all stages of the publication process. Communication was clear and efficient, and any questions were addressed promptly. Overall, I found the journal to maintain high scientific standards and an excellent publication workflow. I would be pleased to consider submitting future work to this journal. Best wishes from, Elena Popa.

It was my pleasure to submit my testimonial concerning the Reviewer Board of our Scientific Journal “Brain and Neurological Disorders”. The Reviewers focused on some modifications and their contribution was helpful. The ladies of our Editorial Office were also supported my efforts. It was my honor to have such a co-operation and I am looking forward for more collaboration.

Dear Grace Pierce, Editorial Coordinator of Journal of Clinical Research and Reports, Thank you for the speedy and efficient peer review process. I appreciate the fact that your peer reviewers do not take months to respond like with some other journals. I would also like to thank the editorial office for responding quickly to my questions. It is an excellent journal. I plan to submit more manuscripts in the future. Best wishes from, Robert W. McGee

Dear Grace Pierce, Editorial Coordinator of Journal of Clinical Research and Reports, Working with you and your team on our recent publication in JCRR has been a truly wonderful and enjoyable experience. The responses were prompt, and the reviewers were patient, constructive, and highly professional. One reviewer in particular gave me the feeling that a professor was carefully reading and commenting on my coursework, which was deeply touching. The entire process was straightforward and hassle‑free, with no tedious online forms to complete. I highly recommend this journal. Best wishes from, DR Aibing Rao, Head of R&D

I Appreciate the Opportunity to Share my Experience with the Journal of Clinical Research and Reports. The peer review process was timely and constructive, and the feedback provided helped improve the quality of our manuscript. The editorial office was professional, responsive, and supportive throughout the process, ensuring smooth communication and efficient handling of the submission. Overall, it was a positive experience collaborating with your team.

Dear Mercy Grace, Editorial Coordinator of Obstetrics Gynecology and Reproductive Sciences, We would like to express our gratitude for your help at all stages of publishing and editing the article. The editors of the magazine answer all the necessary questions and help at every stage. We will definitely continue to cooperate and publish other works in the Obstetrics Gynecology and Reproductive Sciences! Best wishes from, Alla Konstantinovna Politova,
