
Review Article | DOI: https://doi.org/10.31579/2692-9406/052
Genie Biomedical Laboratory (GBM), Faculty of Technology, University Aboubekr Belkaid Tlemcen BP 119, Algeria.
*Corresponding Author: Sid Mohammed ElAmine Debbal, Genie Biomedical Laboratory (GBM), Faculty of Technology, University Aboubekr Belkaid Tlemcen BP 119, Algeria.1
Citation: S. M. Debbal, L.Hamza Cherif, F.Meziani. (2021) Heart cardiac’s sounds signals segmentation by using the discrete wavelet transform (DWT). Biomedical Research and Clinical Reviews. 4(3); DOI: 10.31579/2692-9406/052
Copyright: © This is an open-access article distributed under the terms of the Creative Commons Attribution License, which permits unrestricted use, distribution, and reproduction in any medium, provided the original author and source are credited.
Received: 02 February 2021 | Accepted: 17 June 2021 | Published: 01 July 2021
Keywords: phonocardiogram; heart sounds; heart murmurs; wavelet denoising; shannon energy; segmentation; algorithm; parameters, measurements and statistics
The presence of abnormal sounds in one cardiac cycle, provide valuable information on various diseases.Early detection of various diseases is necessary; it is done by a simple technique known as: phonocardiography. The phonocardiography, based on registration of vibrations or oscillations of different frequencies, audible or not, that correspond to normal and abnormal heart sounds. It provides the clinician with a complementary tool to record the heart sounds heard during auscultation. The advancement of intracardiac phonocardiography, combined with signal processing techniques, has strongly renewed researchers’ interest in studying heart sounds and murmurs.
This paper presents an algorithm based on the denoising by wavelet transform (DWT) and the Shannon energy of the PCG signal, for the detection of heart sounds (the first and second sounds, S1 and S2) and heart murmurs. This algorithm makes it possible to isolate individual sounds (S1 or S2) and murmurs to give an assessment of their average duration.
Noninvasive diagnosis, such as phonocardiogram (PCG), offers useful information of functioning heart. The heart produces four sounds for each cardiac cycle. However, most often only two sounds appear essential: S1: corresponding to the beginning of ventricular systole is due to the closure of atrioventricular valves.
This sound is composed of two internal components: the mitral component (M1) associated with the closure of the mitral valve, and the tricuspid component (T1) associated with the closing of the tricuspid valve [1]and S2: marking the end of ventricular systole and signifying the beginning of diastole, is made up of two main components: the aorticcomponent (A2) corresponding to the closure of the aortic valve, and the pulmonary component (P2), corresponding to the closure of the pulmonary valve [2]. Two other sounds: S3 and S4, with lower amplitude than S1 or S2 [3], appear occasionally in the cardiac cycle by the effect of disease or age.
In auscultation, the listener tries to analyze the heart sound components separately and then synthesize the heard features.Heart sound analysis by auscultation highly depends on the skills and experience of the listener [4].
Therefore the recording of heart sounds and analyzing them by a computerized and objective way would be most desirable. Several techniques had been used to analysis the PCG signal components. Before any analysis, the PCG signal needs to be segmented into components (sounds or murmurs), and then the components are analyzed separately. The oldest ones are based on the Fourier Transform (FT), which produces an average spectrum over time. This is can be suitable for signals whose statistical properties are invariant over time "stationary".
The physiological signals spectral content; such as the PCG cases; evolves with time. Consequently, the techniques of temporal averaging amplitudes are incapable to describe transients and no stationary events [5]. As a result, time-frequency approaches have been proposed. Indeed, the Short-term Fourier transform (STFT) is one of the oldest methods that are used to analysis biomedical signal. Unfortunately, it may not allow good resolution in time andfrequencysimultaneously[6]. Other techniques such as wavelet transform are proposed. In the next section, a detailed description of this technique will be done.
In this paper the denoising by wavelet transform (DWT) will be used in the analysis of various signals PCG. Several statistical parameters are deduced from the results of applying the wavelet transform which can give more in the understanding of cardiac activity and at the same provide a valuable aid to clinicians [7].
The wavelet transform is based on the use of special function called mother transform. This special function will be undergoing to a translation and contraction or dilatation operations to give a set of functions called wavelets. These functions are a constant shape but variable size. When the studied signal is analyzed by wavelets, a set of coefficients are obtained. Those coefficients represent the correlation between the wavelet and the studied signal. They are given by equation 1.

(1)
Where, a represents the scale and b the translation coefficient. The wavelet transform (WT), applies a multi-resolution analysis on the signal studied. This analysis might be called time-scale, uses a wide range of scales to analyze the signal. When the a and b factor are continuous, the wavelet transform is a continuous wavelet transform (CWT) (equation 2). The CWT is used when no reconstruction of the original signal from the obtained coefficients is needed. By contrary, when the original signal is needed to be reconstructed, a discretization of the a and b factors must be done. The obtained wavelet is named the discrete wavelet transform (DWT). The discretization can be done by equation 3

(2)

(3)
In fact, the wavelet transform is also interpreted as a process of filtering the signal analyzed by a pair of low and high pass filters with variable bandwidth.
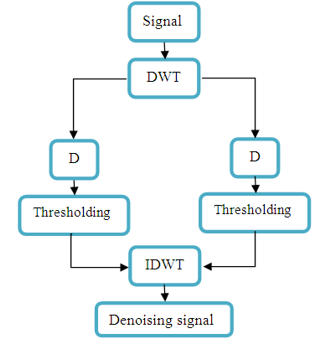
Details (D) represent the high frequency events whereas the approximations (A) are slow events.
Our aim with thisdenoisingis to extractthe heart sounds (S1 and S2) of murmursthat are consideredin this stage as the noise.
The modelconsidered for thedenoisingis classic, the measured signal x is an additive mixture of signal informations and a measurement noise r:
Langue source : français
Denoising by thresholding the wavelet coefficients, as déffini in [8], is to extract a coherentstructure of the measured signal. The assumptionthat the noiserconsidersas notconsistent witha database ofpredefinedwaveform, that is to say notcorrelatedwith thesewaveforms.The coefficients ofthe decompositionof noise onthe base is low, this gives the possibility to remove them easily.
The most commonly used algorithm is the decomposition of a discrete wavelet orthonormal basis of Mallat[7]:simple decomposition and reconstruction exact, the value of a projectionon an orthonormal basis is the factthatpermits conservation of energy from one representation to another.After thedecomposition of the signal on this basis, thesegmentsless correlatedwith the baseof the coefficientsarelow, andthey are attributedto noise.Asuitablethreshold, we can separate the noise (incoherent part), signal (coherent part).
The denoised signalis generatedthrough aninversereconstruction (IDWT). This procedure is shown in Figure2.Vos [9], Messer and al. [10] used this approach in the phono cardiogram signal denoising.
In the literature, there are two types of thresholding: hard thresholding and the soft thresholding. [11]
The first proposesthe can collation of all values below athreshold T, the higher values are unchanged.
Coefficients of the decomposition of the signal x).
The second methodoperatesin addition tothe cancellation, a subtractionof the threshold valuesremaining above the threshold, to reduce the number ofdiscontinuities in thedenoised signal.
(6)
The threshold T can be calculated in different ways. The method chosen in our algorithm was developed by Donoho and Johnstone [12], known by the universal thresholding.
Before applying a wavelet denoising, we must consider some parameters, such as the type of wavelet used, the decomposition level selected and the type of thresholding. Messer and al [10] proved that the universals thresholding give very satisfactory results.
The wavelet transform (WT) remains most appropriate for analysis of heart sounds (normal and pathological).This technique has shown its effectiveness in time-frequency analysis, which is due to its analysis window size adaptive and flexible allowing it to have a good time resolute on for high frequency components and good frequency resolution for low-frequency components [6-13-14].
The analysis of PCG signals using wavelet transforms has shown that it is important to find out the appropriate wavelet. The study carried out on different types of orthogonal and bio-orthogonal wavelet at different levels using the standard deviation, and the error of rebuilding as a discrimination parameter has shown that the daubechies wavelet of the seventh level :db7 can be used in PCG signal analysis. In fact its morphology and duration are highly correlated to the different sounds in the PCG [15-16-17-18].
Messer and al. [8], found that the 10th level of decomposition is the best for denoising PCG signals sampled by 44:1 kHz, where they used the daubechies wavelet of the seventh level: db7.Moreover, they proved that the universal soft thresholding gives very satisfactory results.
The sampling frequency of the PCG signal has a great influence on the appropriate decomposition level for denoising.
To show the influence of sampling frequency on the optimal decomposition level. The following figure (Figure.3-5) presents a PCG signal generated on two different sampling frequencies.
In the first case (Figure.4), the optimal denoising is successful in the fifth level, beyond this level the signal begins to distort. For the second case (Figure.5), the ideal denoising appears from the seventh level; however, few traces remain of murmurs.
Indeed the decrease in signal distortion relative to the increase in sampling rate can be explained as follows:
Actually increase the sampling rate is an improvement in signal resolution: the number of samples will be higher and the sound quality will be better.
In first case: fs = 8000 Hz, the signal converges rapidly to the deformation; however the limited number of samples makes the perfect denoising operation. With a sampling frequency of 44.1 kHz, the number of samples is quite sufficient for the resolution is still good; therefore, the signals are reconstructed slightly deformed. However, the high number of samples makes the process of denoising worse. In our work, and in order to have a good filtering, we chose 8000 Hz as the sampling frequency for all PCG signals that will be addressed. Changing the sampling frequency is performed by software sound processing (WAVEdit)
It is known beforehand that the duration of systole is shorter than that of the diastole. Based on this reality, the identification of sound S1 and S2 can be performed.
The detection of the first and the second heart sound (S1, S2) can be done using the following conditions:

In fact, in this step the energy envelope of Shannon (figure: 11. (a)) can be a very effective parameter not only in identifying sounds S1 and S2 peaks (figure: 11. (b)), but also in the detection of the beginning and end of the each heart sound.
Dear Editorial Team, Clinical Medical Reviews and Reports. My experience with the journal was highly positive. The peer-review process was rigorous, constructive, and completed in a timely manner. The reviewers provided valuable comments that helped improve the quality and clarity of our manuscript. The editorial office was professional, responsive, and supportive throughout all stages of the publication process. Communication was clear and efficient, and any questions were addressed promptly. Overall, I found the journal to maintain high scientific standards and an excellent publication workflow. I would be pleased to consider submitting future work to this journal. Best wishes from, Elena Popa.

It was my pleasure to submit my testimonial concerning the Reviewer Board of our Scientific Journal “Brain and Neurological Disorders”. The Reviewers focused on some modifications and their contribution was helpful. The ladies of our Editorial Office were also supported my efforts. It was my honor to have such a co-operation and I am looking forward for more collaboration.

Dear Grace Pierce, Editorial Coordinator of Journal of Clinical Research and Reports, Thank you for the speedy and efficient peer review process. I appreciate the fact that your peer reviewers do not take months to respond like with some other journals. I would also like to thank the editorial office for responding quickly to my questions. It is an excellent journal. I plan to submit more manuscripts in the future. Best wishes from, Robert W. McGee

Dear Grace Pierce, Editorial Coordinator of Journal of Clinical Research and Reports, Working with you and your team on our recent publication in JCRR has been a truly wonderful and enjoyable experience. The responses were prompt, and the reviewers were patient, constructive, and highly professional. One reviewer in particular gave me the feeling that a professor was carefully reading and commenting on my coursework, which was deeply touching. The entire process was straightforward and hassle‑free, with no tedious online forms to complete. I highly recommend this journal. Best wishes from, DR Aibing Rao, Head of R&D

I Appreciate the Opportunity to Share my Experience with the Journal of Clinical Research and Reports. The peer review process was timely and constructive, and the feedback provided helped improve the quality of our manuscript. The editorial office was professional, responsive, and supportive throughout the process, ensuring smooth communication and efficient handling of the submission. Overall, it was a positive experience collaborating with your team.

Dear Mercy Grace, Editorial Coordinator of Obstetrics Gynecology and Reproductive Sciences, We would like to express our gratitude for your help at all stages of publishing and editing the article. The editors of the magazine answer all the necessary questions and help at every stage. We will definitely continue to cooperate and publish other works in the Obstetrics Gynecology and Reproductive Sciences! Best wishes from, Alla Konstantinovna Politova,
