
Review Article | DOI: https://doi.org/10.31579/2640-1053/195
1Riggs Pharmaceuticals Department of Pharmacy, University of Karachi
2Assistant Professor, Department of Microbiology, University of Karachi, Pakistan
3Head of department of Pharmacology Fazaia Ruth Pfau Air University, Karachi
4GD Pharmaceutical Inc OPJS University Rajasthan.
5Assistant Professor Department of Pathology, Dow University of Health Sciences Karachi Pakistan.
*Corresponding Author: Rehan Haider, Riggs Pharmaceuticals Department of Pharmacy, University of Karachi.
Citation: Rehan Haider, (2024), Evaluation of cell cycle inhibitors by flow cytometry, J. Cancer Research and Cellular Therapeutics, 8(3); DOI:10.31579/2640-1053/195
Copyright: © 2024, Rehan Haider. this is an open-access article distributed under the terms of the Creative Commons Attribution License, which permits unrestricted use, distribution, and reproduction in any medium, provided the original author and source are credited.
Received: 10 April 2024 | Accepted: 18 April 2024 | Published: 25 April 2024
Keywords: cell cycle inhibitors; flow cytometry; DNA staining; cell cycle distribution; cell cycle progression; therapy; high-throughput analysis
The evaluation of cell-cycle inhibitors using flow cytometry is crucial for understanding the mechanism of action of investigational drugs and identifying potential therapeutic targets in cancer treatment. Flow cytometry enables high-throughput analysis of individual cells within a population, providing valuable insights into cell cycle progression and identifying drug-induced changes.
Typically, cells are stained with fluorescent dyes that bind to DNA, allowing for analysis of cell cycle phases based on DNA content. Following treatment with cell cycle inhibitors, alterations in cell cycle progression, such as arrest at specific phases or induction of apoptosis, can be detected by changes in cell population distribution at various time points.
Flow cytometry offers several advantages for the assessment of cell cycle inhibitors, including the ability to detect subtle changes in cell cycle distribution, rapid data acquisition, and compatibility with complementary assays. Additionally, flow cytometry can be combined with other techniques, such as immunostaining or cell sorting, to provide additional mechanistic insights or isolate specific cell populations for further analysis.
However, there are challenges associated with flow cytometry, including the need for consistent protocols to ensure reproducible results, optimization of staining conditions to minimize artifacts, and data analysis for accurate interpretation of complex cell cycle profiles. Despite these challenges, flow cytometry remains an indispensable tool for preclinical and clinical studies aimed at elucidating the mechanisms of action of cell cycle inhibitors and developing novel antitumor therapies.
The regulation of the cell cycle is critical for cellular function and overall tissue homeostasis, and its dysregulation is implicated in various diseases and pathologies. The cell cycle progresses through a series of tightly regulated events involving DNA replication, DNA damage repair, and cell division, orchestrated by a complex interplay of signaling pathways and regulatory proteins. Disruption of these processes can lead to uncontrolled cell proliferation and tumor formation, making the cell cycle an attractive target for therapeutic intervention. Cell-cycle inhibitors represent a promising class of drugs designed to target cell-cycle progression and halt aberrant cell proliferation, offering potential avenues for the treatment of tumors and various proliferative disorders. Understanding the mechanisms of action of these inhibitors and assessing their efficacy are crucial steps in the development of novel therapeutic strategies. Flow cytometry has emerged as a powerful technique for evaluating cell-cycle inhibitors, enabling the rapid and quantitative analysis of large numbers of individual cells. By leveraging the characteristic DNA content of cells at different stages of the cell cycle, flow cytometry facilitates the characterization of cell-cycle distribution and the detection of alterations induced by inhibitors. In this study, we aim to assess the effects of cell-cycle inhibitors using flow cytometry and investigate their impact on long-term progression. Specifically, we will examine the ability of these inhibitors to induce cell-cycle arrest or apoptosis in tumor cells, providing insights into their mechanisms of action and potential therapeutic utility. By utilizing the capabilities of flow cytometry and elucidating the effects of cell-cycle inhibitors on cell-cycle dynamics, this research has the potential to advance our understanding of novel anti-tumor therapies and shed light on cell-cycle requirements in health and disease.
Drug Discovery Process
The primary approach employed by many pharmaceutical companies for drug discovery involves identifying a fundamental biological target that has been sufficiently validated. Typically, biochemical or cellular assays are developed and utilized to screen hits from large compound libraries in the case of new chemical entities (NCEs), as identifying potential lead compounds requires pharmacological activity. These compounds serve as starting points for chemical modifications that influence structure-activity relationships (SARs). The subsequent stage of lead optimization (LO) involves further refining lead compounds to exhibit desired activities in relevant assays, including cellular assays and indications of in vivo efficacy related to pharmacodynamic biomarker expression. The progression of lead compounds is often influenced by potency, selectivity, or efficacy in animal models, as well as pharmacokinetic properties (e.g., oral bioavailability). During this phase, a comprehensive assessment of toxicological findings and rigorous evaluation in preclinical animal models (e.g., xenograft or transgenic animal models) for confirmed therapeutic efficacy is conducted, ultimately leading to the selection of the final candidate for potential clinical trials. In the intricate process of drug discovery, particularly for cell-cycle inhibitors, flow cytometry (FCM) plays a crucial role in two stages. Firstly, in target validation, where demonstration of the involvement of a specific target triggers a change in the cell cycle, and secondly, in the use of cell-based assays to identify compounds that demonstrate that the observed alterations are indeed due to the expected mechanism of action. FCM serves as a valuable readout and a key tool for evaluating the mechanism of action of drugs that impact cell proliferation, as it is rapid, accurate, and amenable to high-throughput analysis. In this context, we provide an overview of the logistical and technical aspects of flow cytometry as a primary tool for drug discovery, emphasizing its utility in assessing the efficacy of novel treatments. Specifically, when identifying the activity of a target or mechanism induced by a compound, a single-parameter DNA analysis is valuable, focusing on the speed and throughput of samples facilitated by automated control. Alternatively, when the mechanism of action of a drug is the focus of the study, a two-parameter analysis such as bromodeoxyuridine (BrdU) or ethyl-deoxy uridine (EdU) incorporation (detected by "click chemistry") along with DNA staining may be employed.
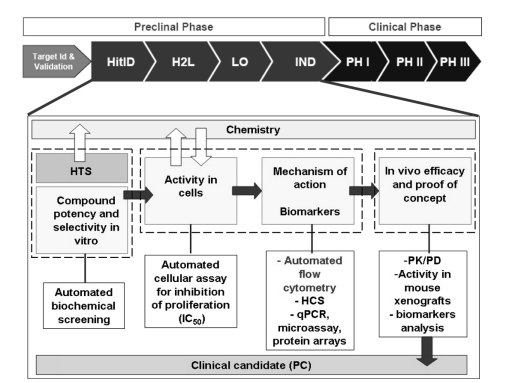
Figure 1. A typical screening approach used for the identification of small molecule cell cycle Inhibitor
2.1 Mono-parametric Analysis of DNA Content
The appraisal of DNA content utilizing glowing dyes that bind stoichiometrically to DNA, such as propidium iodide (PI), allows for the calculation of fundamental DNA content and the dispersion of the container cycle in a population of asynchronously separating containers. Following situations where drugs or siRNA address particular container era stages, alterations in container cycle progress may be discovered. The calculation of DNA content (x-spindle, fluorescence of dye-bound DNA), exhibitivity of the DNA content, and the y-pole interpreting the number of containers is determined utilizing an analytical model (in the way that Modfit) that calculates the distribution of containers in the various stages of the container phase. Proliferating containers progress through three main chapters: G1, S-time, and G2/M. The G2 and M phases include the development of containers by growing their DNA content before dividing into offspring G1 containers. The part of containers accompanying DNA content below the G1 point, frequently referred to as the "Sub G1" part, shows apoptotic and fragmented containers. The incidence of polyploidy in containers, signifying cells accompanying odd DNA content, is lower than in G2/M, primarily on account of the failure in cellular division. An explanatory model is bestowed in Fig. 2. Human ovarian tumor A2780 cells with a hasty increase were resolved for their DNA content. Various modes of operation in compound situations concede the possibility of being noticed. For instance, doctoring A2780 cells accompanying compounds moving through various stages of the container era may influence unconnected container phase characterizations. For example, treating A2780 containers accompanying compounds moving kinase inhibitors grants permission to lead to various container era sketches, displaying a block before (e.g., CDKs) or following in position or time (like, PLK or Aurora) DNA copy (Table 1 and Fig. 3).
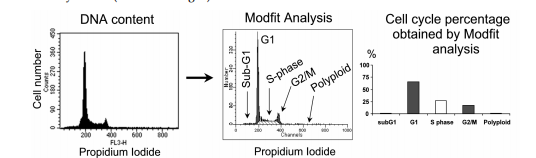
Figure 2. A2780 cells in exponential growth were analyzed for their DNA content and the
percentage of cells in specific stages of the cell cycle percentage was analyzed (X-axis, fluorescence of the dye bound to DNA, representative of the DNA content and y-axis, number of cells to DNA content).
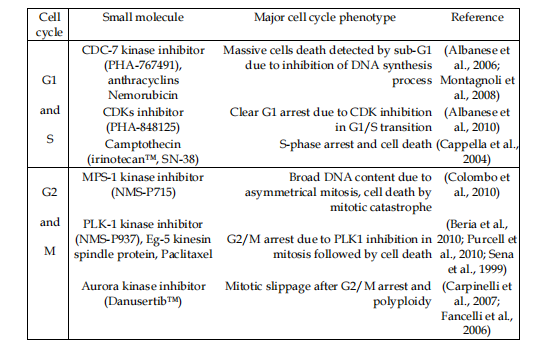
Table 1. Different cellular phenotypes observed after treatment listed as exemplified for small molecule kinase inhibitors targeting cell cycle kinase or cytotoxic agents.
Propidium iodide (Red Fluorescence)
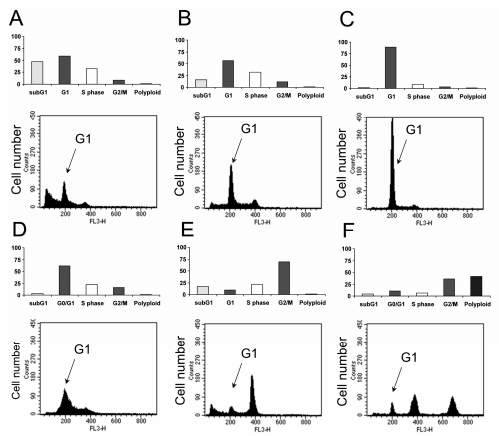
Figure 3. DNA content and Modfit interpretation of A2780 human ovarian virulence bags deliberate following carton-era inhibitors at 1 µM. A) CDC7 stop NMS-354; B) Nemorubicin; C) CDKs stops PHA-848125; D) MPS1 stop NMS-P715; E) PLK1 stop NMS-P937; and F)
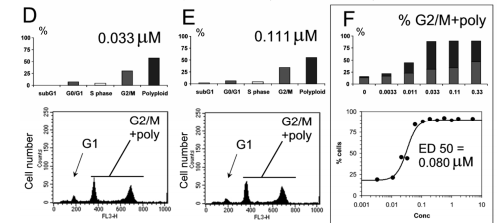
Aurora stopped Danusertib. The DNA content of willing cans is substantiated in Figure 2. For example, Aurora kinase inhibitors hindering DanusertibTM results in the container day sketch because mitotic slippage leads to polyploidy. This characteristic crate-day writing concedes the possibility of being used to resolve compound influence and tools of movement in containers, as confirmed in Fig. 4. Since Aurora kinase stop DanusertibTM was particular on the chosen kinases The establishment of an indestructible G1/S checkpoint, as noticed in prior studies (Carpinelli and others., 2007) [2], guided phenotype changes had a connection with Aurora A and B restriction at apparent concentrations. Consequently, the process of polyploidization was ruling, and the population of containers in the G2/M time, in addition to polyploid containers, raised accompanying increasing drug concentrations, admitting the conclusion of the ED50 per bent model. Integration of the ED50 contingent upon flow cytometry (FCM) accompanying differing assays determining antiproliferative and Aurora A and B biochemical endeavors allows the compound to hide in parallel with the venture-led incident of a competitor compound, as defined beneath.
Propidium Iodide [Red Fluorescence]
Propidium Iodide [Red Fluorescence]
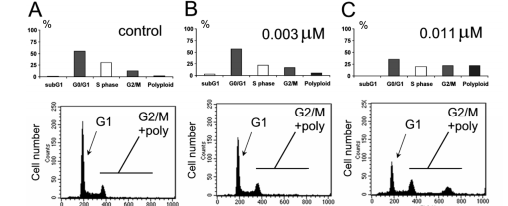
Figure 4. demonstrates human colon lump HCT-116 cells considered to accompany growing doses of an Aurora kinase inhibitor. The efficiency was calculated by determining the number of cells in the G2/M point or presenting polyploidy, as contingent upon the Modfit study.
In Figutr 5, we present the classical building-action friendship (SAR) for cell phase hindrance by Aurora kinase inhibitors, meeting in the pyrrolopyrazole class. Based on these findings, compounds that professed extreme efficiency in biochemical and cellular assays, in addition to acceptable liquid solubility, such as compound 5, were picked. In addition to drug findings, DNA content studies are useful for occurrence designating and confirmation processes prior to authoritative description. One usually secondhand method for confirmation, specifically in natural models, involves deoxyribonucleic acid muting utilizing small meddling RNA (siRNA), usually, double-abandoned oligonucleotides ranging from 21 to 25 nucleotides in time (Colombo & Moll, 2008) [3]. In our experiment, containers were transfected with accompanying siRNA and analyzed afterward for 72 hours to evaluate container number, colony-making capability, DNA content allocation, and alterations in signal transduction pathways or DNA copy pathways.
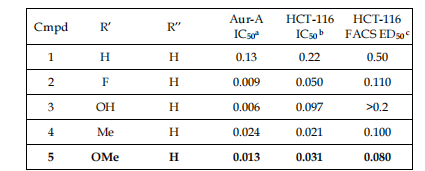
Figure 5. exemplifies the construction and Aurora-A restriction of substituted-phenyl acetyl pyrrolopyrazole, showing substance-causing chemicals to split into simpler substances with hindrance IC50 (a), antagonistic-increase IC50 (b), and FACS ED50 persistence based on the number of containers in G2/M and presenting polyploidy (c). Adapted from Francelli and others. (2006) [4].
In Figure 6A, a model helps Eg5 inhibition (Purcell and others., 2010) [5], appropriating Eg5 and matching controls to evaluate wide effects. Since container lines in civilization display variable historical characteristics, this is mirrored in the DNA container era characterization and, as a consequence, the Eg5 siRNA effects (Fig. 6B). A549 containers are naive to powers that straightforwardly influence cell chance, while U2-OS containers were jailed in G2/M, and H1299 containers showed increased polyploidy. One-dimensional DNA content reasoning by FCM is a healthy design for examining the container cycle, specifically for mitotic checkpoints. However, it still poses challenges in ironing out container destiny and the distinction of container era stages, particularly for the S-point, in the presence of a block in DNA replication. Therefore, supplementary measures are necessary, to a degree, combining BrdU incorporation as a readout.
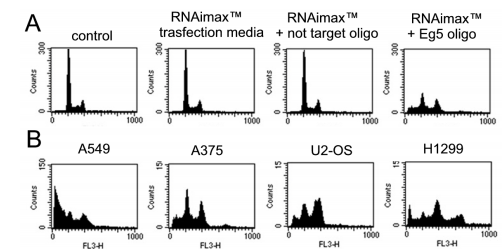
Figure 6. A. Small RNA interference experiment in A549 cells treated for 72 hrs with 20nM Eg5 oligo, in comparison to not transfected or transfected with a non target oligo. B. Cellular phenotypes observed after RNAi experiments in different cell type;
2.2 DNA CONTENT and Bromo-deoxyuridine (BrdU)
Understanding and forecasting containers actively combining DNA are the basic aims of the natural response to drug situations. Historically, the inclusion of [3H]-thymidine analogs was used to measure DNA combinations (assigned to sources). However, the use of radioisotopes (3H β-emitters) with a half-history of 12 years and β issuances bestowed limitations on this approach that were technically difficult to resolve. In 1982, the incident of 5-bromo-deoxyuridine (BrdU), a thymidine parallel worthy of incorporating into recently combined DNA outside of the need for denaturation, led to the forsaking of [3H]-marked thymidine in the late 80s, following progress in flow cytometry (FCM). Various methods have been used to discover BrdU inclusion, necessitating DNA denaturation, which happens only upon denaturation of the double loop, and subsequent immunodetection of BrdU inclusion utilizing monoclonal antagonistic BrdU antibodies (Leif and others., 2004) [6].
This step is typically reached through the following approaches: Heat situation at 90–100 °C for brief durations, usually secondhand with experienced containers or fabric samples obtained from fixed or incompletely established histological examples. However, this method is less common on account of the requirement for supplementary treatment steps and the potential to damage plants and natural structures. Alternatively, DNA denaturation may be performed in a 96-well plate utilizing a programmable warming device complementary to a PCR order, making it appropriate for extreme-throughput screening requests (Cappella and others., 2010) [7]. Acid or soluble base situations, followed by a retaliation step (Leif and others., 2004). DNA denaturation utilizing acid treatment concedes the possibility of changing DNA subordinate constructions, thereby restricting the use of DNA probes to a degree, such as propidium iodide (PI), 7-amino actinomycin D, and TOPRO-3, that demand double-stranded DNA. Acid denaturation grants permission but is not suitable for studies including plant containers, surface antigenicity, or specific basic elements in the way that cyclins (Faretta and others., 1998) [8] or phosphorylated signaling proteins (Gasparri and others., 2006) [9] are exceptionally effective in multiparameter studies. Enzymatic digestion using DNase I/exonuclease III, which selectively cleaves DNA at A-T-rich domains at 37 °C, produces distinct-stranded DNA to reveal organized BrdU residues. This means has demonstrated serviceability in maintaining antigenicity and natural language rules, albeit accompanying the hereditary restraint that the container cycle stage shows (Gasparri and others., 2006). Additional techniques have been developed utilizing synthetic treatments to encourage DNA filament breaks by way of photolysis followed by anti-BrdU immunodetection, frequently happening in cytotoxic belongings (Leif et al., 2006) [10]. Regardless of the denaturation order, BrdU inclusion and DNA staining are the standard for determining container era rank, as shown in the pictorial in Fig. 6. Cell cycle study by alone-limit display (Jourdan and others., 2002) [11] and fitting programs (such as ModfitTM) frequently minimize the portion of containers in the S-phase because G1 and G2/M peaks are fit to a Gaussian model, accompanying early and late S-steps held within these equipped peaks. A model illustrating this idea is described in Fig. 7, emphasizing the various processes happening in HCT-116 colon carcinoma containers that exhibit 30% vs. 43% of containers in the S-phase, contingent upon the situational regime resorted to. As pictorial in Fig. 8A and B, the BrdU assay allows the labeling and calculation of some potential hindrance in DNA combination, allure affects the S-aspect, and the talent to equate the early S-stage and G1 or the late S-phase and G2/M. [12]. This benefit is manifested in Fig. 8A, where HCT116 containers were doctored with SN-38, a topoisomerase prevention drug popularly used to influence DNA copy. Only through the inclusion of BrdU marking was it attainable to disclose delays in the early (access to chapter E) or late (bar L) S-phase following the SN-38 situation at 7 hours (Fig. 8B).
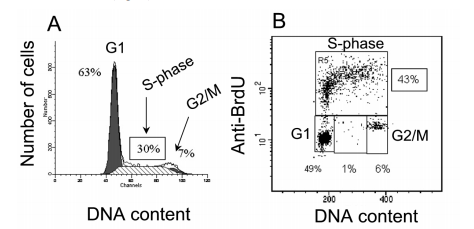
Figure 7. Profile of DNA content and BrdU inclusion in the same sample. A, DNA content was resolved by Modfit study or B, DNA content by PI (x-arbor), and BrdU inclusion(y-axis)
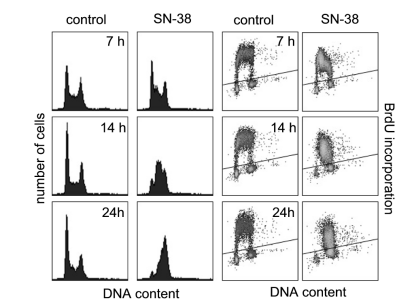
Figure 8A. Profile of DNA content and BrdU inclusion of HCT-116 containers discussed accompanying SN-38 at 10 nM for 7, 16, and 24 hours. DNA content by PI (x-shaft) and BrdU inclusion (y-axis) are proved. Cells above the foul line delimit BrdU-helpful containers.
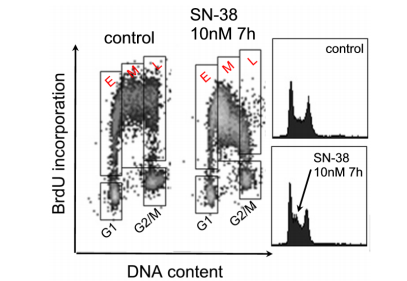
Figure 8B. BrdU inclusion in HCT-116 containers acted as an accompanying SN-38 at 10 nM for 7 hours. Gates were branded as E for early S-state, M for middle S-stage, and L for late S-stage. The matching DNA content descriptions are proven. The missile displays the challenge of detecting early occurrences through DNA staining. DNA content is presented by PI (x-stem) and BrdU inclusion (y-hinge) through BrdU antitoxin staining.
Another benefit is that BrdU inclusion may be used either artificially or in vivo. Fig. 9 presents an ex vivo study of rodent HCT-116 xenograft tumors that have taken endovenous injections of a single shot of irinotecan (60 mg/kg) (Ciomei and others., 2007) [13]. BrdU was executed
intraperitoneally 2 hours before the drug presidency, and the rodent was euthanized. Tumors were therefore deleted and disaggregated utilizing pepsin (Terry & White, 2001) [14]. This approach speeded the discovery of container-phase perturbations, which persuaded each drug.
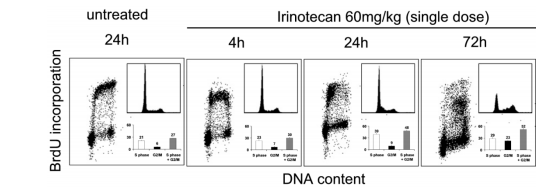
Figure 9. BrdU incorporation (dot plots) in enzymatically disaggregated HCT-116 tumor cells treated with irinotecan. Cell-cycle profiles (DNA histograms) and percentages of cells in S phase and/or G2/M are shown as inlets.
Since this drug originally shot an early DNA copy, a delay in the G1/S change (up to 24 hours) was noticed, followed by a more evident arrest in the S state and G2/M at later opportunity points. Additionally, as DNA copy enhancement was restricted and containers started to exit the container era, BrdU inclusion was rescinded (Cappella and others., 2004) [15]. More recently, BrdU incorporation has taken advantage of the pick of energetically separating containers having DNA replication for CGH microarray reasoning and genome-scale studies of copy number difference (Ryba and others., 2011) [16].
2.3 DNA CONTENT and BrdU by way of Click Chemistry
Although skilled is an excess of forms for analyzing BrdU inclusion, the basic disadvantages are the challenges that guide their worldwide use in various FCM and conventional depictions. Thermal denaturation demolishes most antigens, and denaturation by way of "severe chemical compound," that includes acids or bases, renders the discovery of different antigens unrealistic (Frank and others., 1995) [17], accordingly alternative approaches are wanted. In 2001, the term "click allure" was coined by Nobel Prize champ Sharpless to specify responses accompanying delimited substrates, and the ultimate widely acknowledged reaction that meets these tests is the 1,3-dipolar cycloaddition, specifically the Copper-Catalyzed Azide-Alkyne Cycloaddition (CuAAC) middle from two points an azide and a terminal alkyne, flexible a triazole, accompanying law enforcement officer(I) present an image of a catalyst (Figure 10).These approaches are very discriminating and are bioorthogonal; they do
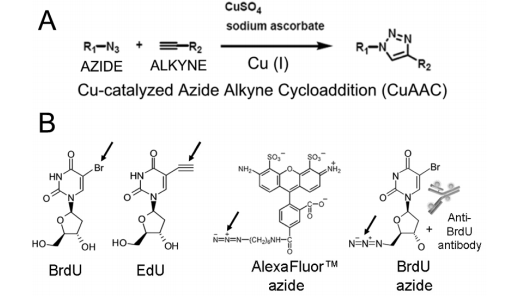
Figure 10. A) Generic schema for Cu-Catalyzed Azide Alkyne Cycloaddition (CuAAC) between an azide and a terminal alkyne forming a triazole by copper (I), B) Players of bio orthogonal approach for cell cycle analysis.
In the case of EdU (5-ethynyl-2’-deoxyuridine), a plan of adaptation was secondhand for BrdU for DNA combination understanding in FCM. EdU is arranged into the copy forks of new DNA, accompanying endeavor in the S time; unsafe alkynyl residues can respond, accompanying "click allure" reagents holding azides (AlexaFluorTM 488 Click-IT assay determined by Invitrogen Corp.), promoting their discovery (Darzynkiewicz and others., 2011). One benefit concerning this assay is substituting dye azides, following a BrdU azide, and disclosing BrdU inclusion for lightening the belongings of adulteration or meddling (Fig. 11). Following BrdU, EdU inclusion concedes the possibility of being secondhand in vivo. The use of this approach is specifically valuable in hiding compounds that change the endpoint when parametric readouts are requested in extreme content protection (HCS). In this case, upholding the decent putting of the sample bag is important as it marmalades the antigenic face and honors of the sample (Cappella and others., 2008).
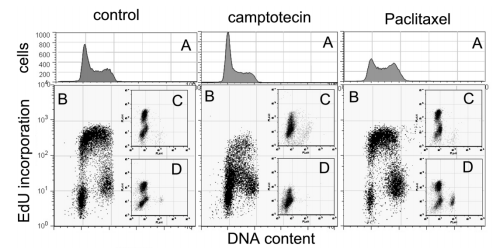
Figure 11. EdU inclusion as a model of multi-parametric analysis. Cells were considered accompanying camptothecin or paclitaxel and tainted with PI or accompanying matching antibodies. A, container-cycle characterizations; B, EdU inclusion and DNA content; C, EdU and cleaved caspase 3; D, EdU and phospho-histone H3 (Cappella and others., 2008)
Dna Content and Sample Through Put
Cell point understanding by FCM and BrdU addition is one of the ultimate persuasive methods to quantitatively label natural stage changes following positional or material clues. However, high throughput is restricted because the healthiest methodologies engaged demand sample origin from cultured foods. Traditionally, FCM has been limited to small labs; however, progress in dispassionate studies and high-throughput methods has immediately attained maturity for drug discovery. Hands-free machine control and the inclusion of 96-well plate autosamplers have significantly enhanced throughput skills in both animal and plant samples (Cappella and others., 2010; Cousin et al., 2009). Advancements in extreme throughput FCM have been aided by the inauguration of BD “Multiwell Autosampler” MASTM and HTSTM, in addition to adept data processing policies in the way that “plug-FCM” blueprints and HyperCytTM. Sample handling has been enhanced by more adept autosamplers loading samples as individual bodies, as urged by Black et al. (2010). The percentage study of samples is frequently expedited by appropriate gating designs. Once solid datasets are produced, the results can be amassed for an inclusive readout, as illustrated by Lugli and others. (2010). Data analysis may be further modernized by utilizing cluster analysis programs to the degree of SpotfireTM to create heat maps. For instance, a model may be created to describe compounds in BrdU experiments that established the allotment of BrdU-positive containers, dimensions of S-step containers, and G2/M phase containers, as expressed by ModfitTM reasoning of DNA content and subsequent drug finding (Cappella and others., 2010). Furthermore, supplementary studies are now mixing proteomics and bioinformatics approaches. These contain subject classification by principal component analysis (PCA), hierarchic grouping to recognize novel supervisory elements for representation study, or increasing analytics, leveraging appropriate bioinformatics methods (Lugli and others., 2007; Shedden & Rosania, 2010; Klinke & Brundage, 2009).
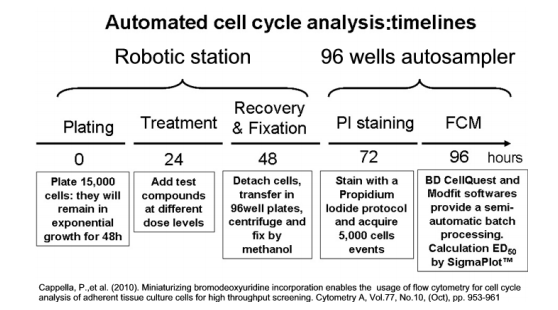
Figure 12. Example of cell cycle analysis timelines using lab automation.
The judgment of container-era inhibitors by flow cytometry involves various key steps. Initially, containers are civilized, accompanying the inhibitors of interest at various concentrations and period points. Subsequently, the containers are picked and established to maintain their cellular and DNA content. They are therefore tainted by accompanying glowing dyes, typically propidium iodide or DAPI, to label DNA. Flow cytometry is therefore applied to resolve the tainted cells, admitting the decision of the allocation of containers in different phases of the container era.
The flow cytometry reasoning discloses the effects of the container-era inhibitors on container phase progress. Treatment with these inhibitors concedes the possibility of bringing about meaningful alterations in the allocation of cells across the container phase states as distinguished from not-cooked controls. For instance, inhibitors may encourage container era arrest at particular phases, to a degree of G1, S, or G2/M, or increase the rate of containers enduring apoptosis.
The results obtained from flow cytometry provide a valuable understanding of the methods of operation of container-phase inhibitors. By elucidating in what way or manner these inhibitors influence container phase progression, investigators can better think of their potential healing serviceability. Furthermore, flow cytometry authorizes the identification of circumstances—weak causes—and the corresponding different inhibitors or exploratory environments.
Evaluation:
Flow cytometry is an effective form for assessing container-phase inhibitors on account of the allure of extreme sensitivity, the strength to resolve abundant numbers of containers rapidly, and the flexibility for multiplexed studies. However, it is liable to be subjected to potential disadvantages, making necessary the use of appropriate staining controls and data reasoning patterns to guarantee the correct interpretation of results. Overall, flow cytometry shows a valuable finish in the preclinical estimate of container-era inhibitors and the exploration of novel healing planning.
One disadvantage of evaluating cell-phase inhibitors by flow cytometry is the potential for artifacts to be imported throughout sample preparation and analysis. For example, obsession and staining processes concede the possibility of change in container morphology and DNA content, leading to incorrect estimations of container cycle classification. Additionally, flow cytometry depends on the arrogance that each container is depicted by a single occurrence that cannot endure, particularly in samples accompanying extreme container bulk or clumping, due to inaccuracies in cell phase development tasks. Moreover, flow cytometry cannot capture active changes in cell phase progress persuaded by inhibitors over occasion, as it provides a photograph of the container state at the past point. Continuous listening techniques, to a degree period-lapse microscopy, offer the potential to determine inclusive insights into the action of container era alterations. Furthermore, flow cytometry reasoning demands careful growth of exploratory environments, containing staining protocols and agent backgrounds, to guarantee the reproducibility and dependability of results. Variability in these parameters across experiments or workshops can impact the thickness of the dossier and the understanding of the results. Despite these disadvantages, flow cytometry remains a valuable tool for evaluating container-phase inhibitors, particularly when secondhand, in addition to completing methods and severe quality control measures to check potential artifacts and reinforce the strength of verdicts.
Numerous drugs in oncology target the container phase, making container-era study by flow cytometry the preferred procedure for determining compound belongings, style of action, or productiveness. Most anticancer drugs straightforwardly impact container increase, and their inhibitory effects frequently include dosage and organization. Research works in drugs targeting container phase requirements have labeled distinct basic phenotypes, and flow cytometry has allowed the discovery of apoptosis, mitotic arrest, polyploidization, or aneuploidy to expound "compound operation fingerprints," valuable for mechanism of operation studies. The presentation of halogenated nucleotides preventing BrdU inclusion, or "click chemistry" accompanying EdU, has transformed container-phase reasoning. Transitioning from tube-located to plate-located readouts and the rise of mechanized protocols for staining and resolving flow cytometry samples have bestowed new challenges. Additionally, progressive dossier visualization and study methods—to a degree, heat maps—have promoted the management of complex datasets. In this paper, we have explored current flows in DNA reasoning for container-era studies, as emerging in vivo and in silico approaches ("new-flow example") promise to further improve and perfect future studies.
The completion of this research project would not have been possible without the contributions and support of many individuals and organizations. We are deeply grateful to all those who played a role in the success of this project We would also like to thank My Mentor [ Naweed Imam Syed Prof. Department of Cell Biology at the University of Calgary and Dr. Sadaf Ahmed Psychophysiology Lab University of Karachi for their invaluable input and support throughout the research. Their insights and expertise were instrumental in shaping the direction of this project
Declaration of Interest
I at this moment declare that I have no pecuniary or other personal interest, direct or indirect, in any matter that raises or may raise a conflict with my duties as a manager of my office Management
Conflicts of Interest The authors declare that they have no conflicts of interest. Financial support and sponsorship No Funding was received to assist with the preparation of this manuscript
Dear Editorial Team, Clinical Medical Reviews and Reports. My experience with the journal was highly positive. The peer-review process was rigorous, constructive, and completed in a timely manner. The reviewers provided valuable comments that helped improve the quality and clarity of our manuscript. The editorial office was professional, responsive, and supportive throughout all stages of the publication process. Communication was clear and efficient, and any questions were addressed promptly. Overall, I found the journal to maintain high scientific standards and an excellent publication workflow. I would be pleased to consider submitting future work to this journal. Best wishes from, Elena Popa.

It was my pleasure to submit my testimonial concerning the Reviewer Board of our Scientific Journal “Brain and Neurological Disorders”. The Reviewers focused on some modifications and their contribution was helpful. The ladies of our Editorial Office were also supported my efforts. It was my honor to have such a co-operation and I am looking forward for more collaboration.

Dear Grace Pierce, Editorial Coordinator of Journal of Clinical Research and Reports, Thank you for the speedy and efficient peer review process. I appreciate the fact that your peer reviewers do not take months to respond like with some other journals. I would also like to thank the editorial office for responding quickly to my questions. It is an excellent journal. I plan to submit more manuscripts in the future. Best wishes from, Robert W. McGee

Dear Grace Pierce, Editorial Coordinator of Journal of Clinical Research and Reports, Working with you and your team on our recent publication in JCRR has been a truly wonderful and enjoyable experience. The responses were prompt, and the reviewers were patient, constructive, and highly professional. One reviewer in particular gave me the feeling that a professor was carefully reading and commenting on my coursework, which was deeply touching. The entire process was straightforward and hassle‑free, with no tedious online forms to complete. I highly recommend this journal. Best wishes from, DR Aibing Rao, Head of R&D

I Appreciate the Opportunity to Share my Experience with the Journal of Clinical Research and Reports. The peer review process was timely and constructive, and the feedback provided helped improve the quality of our manuscript. The editorial office was professional, responsive, and supportive throughout the process, ensuring smooth communication and efficient handling of the submission. Overall, it was a positive experience collaborating with your team.

Dear Mercy Grace, Editorial Coordinator of Obstetrics Gynecology and Reproductive Sciences, We would like to express our gratitude for your help at all stages of publishing and editing the article. The editors of the magazine answer all the necessary questions and help at every stage. We will definitely continue to cooperate and publish other works in the Obstetrics Gynecology and Reproductive Sciences! Best wishes from, Alla Konstantinovna Politova,
