
Research Article | DOI: https://doi.org/10.31579/2578-8965/109
1Department of Anatomy, Yozgat Bozok University Faculty of Medicine, Yozgat, Turkey
2 Tekirdağ Namik Kemal University, Faculty of Medicine, Tekirdağ, Turkey
3 Department of Medical biology, Faculty of Medicine, Afyonkarahisar Health Sciences University, Afyonkarahisar, Turkey.
4 Department of Anatomy, Erciyes University Faculty of Medicine, Kayseri, Turkey
5 Department of Biochemistry, Faculty of Medicine, Yozgat Bozok University, Yozgat, Turkey
*Corresponding Author: Adem Tokpınar, Tekirdağ Namik Kemal University, Faculty of Medicine, Tekirdağ, Turkey
Citation: Yılmaz S., Tokpınar A., Ateş S., Köklü B., Evrim S. Arıkan, Uçar S. , Ayşe Yeşim G. (2022) Effects of Maternal Caffeine and Vitamin E Usage on Fetus. J. Obstetrics Gynecology and Reproductive Sciences 6(3); DOI: 10.31579/2578-8965/109
Copyright: © 2022, Adem Tokpınar, This is an open access article distributed under the Creative Commons Attribution License, which permits unrestricted use, distribution, and reproduction in any medium, provided the original work is properly cited.
Received: 01 December 2021 | Accepted: 18 December 2021 | Published: 11 January 2022
Keywords: rat; pregnancy; ossification; caffeine; oxidative stress
The use of maternal caffeine has an important effect on the development of the fetus. We investigated the mechanism of oxidative damage induced by caffeine and the efficacy of vitamin E.
Pregnant rats of Wistar-albino genus were used. Following groups of animals were defined: control, sham, caffeine (50 mg/kg), caffeine + vitamin E, vitamin E (60 mg/kg) all invasive applications were repeated daily for 20 days. Tumor necrosis factor alpha (TNF-α), interleukin 1β(IL-1β), interleukin 6 (IL-6) levels were measured in tissue homogenates by using Enzyme-Linked Immuno Sorbent Assay (ELISA) method.
Thiobarbituric acid reactive acid substances (TBARS), Superoxide dismutase (SOD), Glutathione (GSH), Glutathione disulfide (GSSG), Total oxidant status (TOS), Total anti-oxidant status (TAS), Oxidative stress index (OSI), Calcium (Ca) and vitamin D (Vit D) parameters were measured by spectrophotometric assay.
According to these data, caffeine used in pregnancy delayed ossification; It has been found that vitamin E, a powerful antioxidant, counteracts this effect.
Caffeine, whose main natural sources are coffee, tea and cocoa, is one of the most popular and most consumed stimulants worldwide [1]. Since there are no enzymes that inactivate caffeine in the fetus, high caffeine intake can damage the fetus when the caffeine crosses the placental barrier. Epidemiological and experimental animal studies report that caffeine can cross the placental barrier and cause reproductive and developmental toxicities, including intrauterine growth retardation (IUGR) [2, 3].. However, it may cause also pregnancy complications such as pre-eclampsia by inducing oxidative stress formation. It was found that long bone dysplasia can be induced in juvenile rats in the case of prenatal caffeine exposure (PCE), accompanied by overexposure to maternal glucocorticoid. At the same time, it was found that endochondral ossification delay occurred with the suppression of chondrocyte terminal differentiation and the chondrocyte apoptosis rate decreased in the chondrocyte region [4,5]. On the other hand, high caffeine intake causes toxic effects in the kidney and therefore constitutes the basis for kidney diseases. In a study conducted in 2019, high levels of maternal glucocorticoids induced by PCE have been reported to cause podocyte development toxicity in offspring through gene expression programming of renal KLF4 [6].
Vitamin E is a powerful dietary antioxidant that is available in eight different forms and dissolves in fat. Vitamin E has been found to play a protective role in both mother and fetus during pregnancy under normal conditions. Low plasma vitamin E levels have been associated with pregnancy outcomes such as fetal growth [7].. It is thought that antioxidant function and membrane stabilizing effect mediate the molecular mechanism of vitamin E action, which plays a role in various physiological and biochemical functions [8].
The renin–angiotensin system (RAS) was originally considered to be a circulating system that regulated sodium and fluid balance and hemodynamics [9]. Angiotensin II is a potent vasoconstrictor and acts on the angiotensin receptors. Agtr2 (Angiotensin II Receptor Type 2) is part of the renin-angiotensin signaling (RAS) pathway that has been widely studied for its role in blood-pressure regulation [10]. In the present study, also we investigated the effect of high dose vitamin E and caffeine on the Agtr2 gene expression in the placenta of rats.However, when the necessary literature review was conducted, there were not enough studies investigating the effect of vitamin E, a powerful antioxidant against oxidative stress occurring in the fetus as a result of the use of high doses of caffeine in pregnants. In this context, the possible effects of vitamin E against the effects caused by maternal caffeine intake in the fetus organs; was investigated in terms of double skeletal staining, biochemical parameters, real-time PCR method and the number of pyramidal cells in the hippocampus.
Our study was approved by Erciyes University Animal Experiments Local Ethics Committee's decision dated 14.11.2018 and numbered 18/138. The care, feeding, agents applications of animals and sacrification of animals at the end of the experiment were carried out within the Experimental Research Application and Research Center.
Selection and Mating of Experimental Animals
In the study, 25 Wistar Albino female rats weighing an average of 185-200 g and at least 8 weeks old were used. Female rats to be used in the study were kept separately from male rats for 20 days. At the end of this period, the female rats, which were found not to be pregnant, were placed in the same cage together with the male rats (1 male rats to 2 female rats) in order to conceive. In the next step, vaginal smear samples from female rats were examined under a microscope. Female rats with spermium in vaginal smear samples were determined as 0.5 days pregnant.
Preparation of Injections
Caffeine powder (Sigma Aldrich USA (Cat number: 200-362-1)) and Vitamin E (Sigma Aldrich USA (Cat number: 500862)) were obtained from and both substances were prepared daily and no stock solution was made.
Experiment Groups
Details of the experimental groups are given in (Table 1, Fig. 1).

Manipulation of Rats and Obtaining Fetuses
Pregnant rats were anesthetized with ketamine (75 mg/kg) + xylazine (10 mg/kg) on the 20th day of pregnancy. Fetuses were dissected together with the placenta.
Skeletal Staining in Fetuses
All fetuses taken after the experiment were kept in 70% ethyl alcohol for 4-7 days and tissues were freed from water content. After this process, was kept in pure acetone for 1-3 days and degreased. Fetuses extracted from acetone were taken into a double staining solution formed with Alizarin Red-S (100 mg) and Alcian Blue (300 mg) in glass containers. The tissues were stained by incubating for 7 days. At the end of the 7th day, the fetuses were washed under running tap water for 2 hours and allowed to react with water. Then, 1% KOH solution was used to make the tissues transparent. These tissues were then transferred to 20%, 50% and 80% glycerin solutions, then into pure glycerin, respectively. For morphometric measurements, fetus extremities were photographed on a stereomicroscope with Nikon E5700 camera. Then, the obtained photos were transferred to computer. The length and area measurements of the bone to be examined in the transferred photographs were measured using Image J program.
Homogenization and Total Protein Extraction
For biochemical analyzes, after placenta liver and bone tissues were homogenized, was centrifuged at 14000 rpm for 15 minutes at +4 °C and supernatants were collected. Protein content of all samples was measured by Bradford method.
Antioxidant Indices and Cytokines Measurements
Activities of superoxide dismutase (SOD), the levels of glutathione (GSH) and glutathione disulfide (GSSG) were measured in tissue samples by the modified methods of Öztürk and Oztürk (2004) (11). Colorimetric kits (Relassay,Elabscience) were used to measure the levels of TAS,TOS, TNF-α, each sample was analyzed in duplicate. Glutathione content was calculated using the formula GSH = T-GSH − (2 × GSSG). The levels of GSH was calculated by the formula: GSH = GSHt−2 × GSSG. The results of GSHt, GSH, and GSSG were normalized to the total protein content and were expressed as nmol of GSH or GSSG per mg of protein (nmol GSH/mg protein or nmol GSSG/mg protein). OSI value was calculated using the formula: OSI = (TOS (μmol H2O2 equiv./l) / TAS (μmol trolox equiv./l) × 100). Lipid peroxidation, as an indicator of oxidative stress, was estimated by the measurement of TBARS in tissue homogenates as previously described by Buege [12]. Protein samples were thawed, and commercial ELISA kits were used for the quantitative measurement of TNF-α (Cat. No: E-EL-R0019, Elabscience USA), IL-1β (Cat. No: E-EL-R0012, Elabscience USA), IL-6 (Cat. No: E-EL-R0015, Elabscience USA) levels, according to the manufacturer’s instructions. Results are expressed in milligram per milliliter of proteins. ELISA was performed with protein samples extracted from tissues, according to the manufacturer’s instructions. Total Ca2+ concentration was evaluated by using calcium colorimetric assay kit (ab102505; Abcam) according to the manufacturer’s datasheet [13]. 25 µL of standard solution and 25 µL of supernatant extracted from tissue, diluted 1:10, were mixed with 45 µL of chromogenic reagent and 30 µL assay buffer. The mixture was incubated at room temperature for 15 minutes in the dark. The signal was screened at 575 nm (Thermo Varioscan). The concentration of calcium in the samples was calculated according to Sen 2018 (14). Vitamin D analysis was determined using the commercial ELISA kit (EIA 5396 DRG, Germany). Commercial enzyme-linked immunosorbent (ELISA) assay kits were used to measure the serum levels of cytokines (IL-6, TNF-α (Elabscience, MD, USA)).
Stereological Procedure
Optical disector method was applied to determine the number of pyramidal cells in the CA region of the hippocampus [28, 29]. The number of pyramidal neurons in the CA region of the hippocampus was calculated by cross-section sampling rate. We used a stereology workstation (Kayseri, Turkey) for stereological analyses. This system consisted of a CCD digital camera, an image capture card, a personal computer, a computer-controlled motorized specimen stage (Prior Scientific, Cambridge, UK), a microcator (Heidenhein Traunreut, Germany), and a light microscope (Leica, Nubloch, Germany). We used a software program (Macrobrightfield) to measure and record stereological data and to capture digital images of the sections. The system generated microscopy images (a 100× Leica HCX Plan Apo objective) and displayed them on a computer monitor to count the total number of pyramidal cells in the hippocampal CA regions. The total pyramidal neuron number in the CA region (N) of the hippocampus was calculated using the formula: N = Σ Q.

(N:Total neuron number,
ΣQ:Total disector neuron number,
ssf; Section sampling fraction,
asf:Area sampling fraction,
tsf:Thickness sampling fraction).
Briefly, if the largest nuclear profile came into focus within the unbiased virtual counting frames spaced randomly and systematically throughout the delineated regions, then the pyramidal cell was counted. The total pyramidal cell numbers were computed based on the number of pyramidal cells counted and the sampling probability [15, 16].
mRNA Gene Expression Studies
Total RNA was extracted from placental tissues with PureZole reagent (Biorad, USA, Cat. No: 732-6890) according to the manufacturer’s protocol. Then, RNA amount and RNA purity were quantified for each RNA sample by Nanodrop ND-1000 spectrophotometer V3.7. All the RNA samples were reverse transcribed into cDNA from 1 µg of total RNA (iScript Reverse Trancription Supermix Biorad, USA, Cat. No:170884) under the following conditions: One cycle at 25°C for 5 minutes, 46°C for 20 minutes and 95°C for 1 minute.
Agtr2 mRNA expression analysis performed by Rotor Gene-Q (Qiagen, Hilden, Germany). Appropriate dilued cDNA’as were added to a master mixture according to the manufacturer’s protocol (SsoAdvanced Universal Inhibitor-Tolerant SYBR Green Supermix, Biorad, USA, Cat. No: 172-50-16). Oligonucleotide primers were designed by Oligomere (Ankara, TURKEY) based on following primer sequences: Rat-Agtr2-F: 5’-TAACTGCTCACACAAACCGG-3’, Rat-Agtr2-R: 5’-CAAGACTTGGTCACGGGTAA-3’ (Rattus norvegicus angiotensin II receptor, type 2 (Agtr2), NCBI Reference Sequence: NM_012494.3); Gapdh-F5’-CTCTCTGCTCCTCCCTGTTC-3’,Gapdh-R5’-GCCAAATCCGTTCACACCG-3’. (Rattus norvegicus glyceraldehyde-3-phosphate dehydrogenase (Gapdh), NCBI Reference Sequence: NM_017008.4). We used the following RT-PCR protocol: 98°C for 3 minutes initial denaturation followed by 40 cycles of 98°C for 15 seconds and 61°C for 30 minutes.
Statistical Analysis
SPSS 22 program (IBM SPSS Statistics Premium Authorized User V 22) was used for statistical analysis. One-way ANOVA test and Pearson Chi-Square Test were used to evaluate bone total length and area showing ossification (bone length, ossification percentage). For biochemical parameters, the results are presented as mean ± standard deviation of the three replicates. Data in all experiments were analyzed for statistical significance using variance analysis (One-way ANOVA). Post hoc analyzes were performed to compare the parameters of the different groups. Statistical analysis related genetics were performed using REST 2009 V2.0.13 Software.
P less than 0.05 was considered statistically significant. Kruskal Wallis test was used for comparisons between pyramidal cells in the hippocampus CA area. Data were expressed as mean ± standard deviation for each group.
Long bones of the upper and lower extremities (humerus, radius, ulna, femur, tibia and fibula) were evaluated. When 50 mg/kg caffeine was given, there was a significant decrease in ossification and length of ossicles (p <0>
Assessment of Oxidative stress parameters
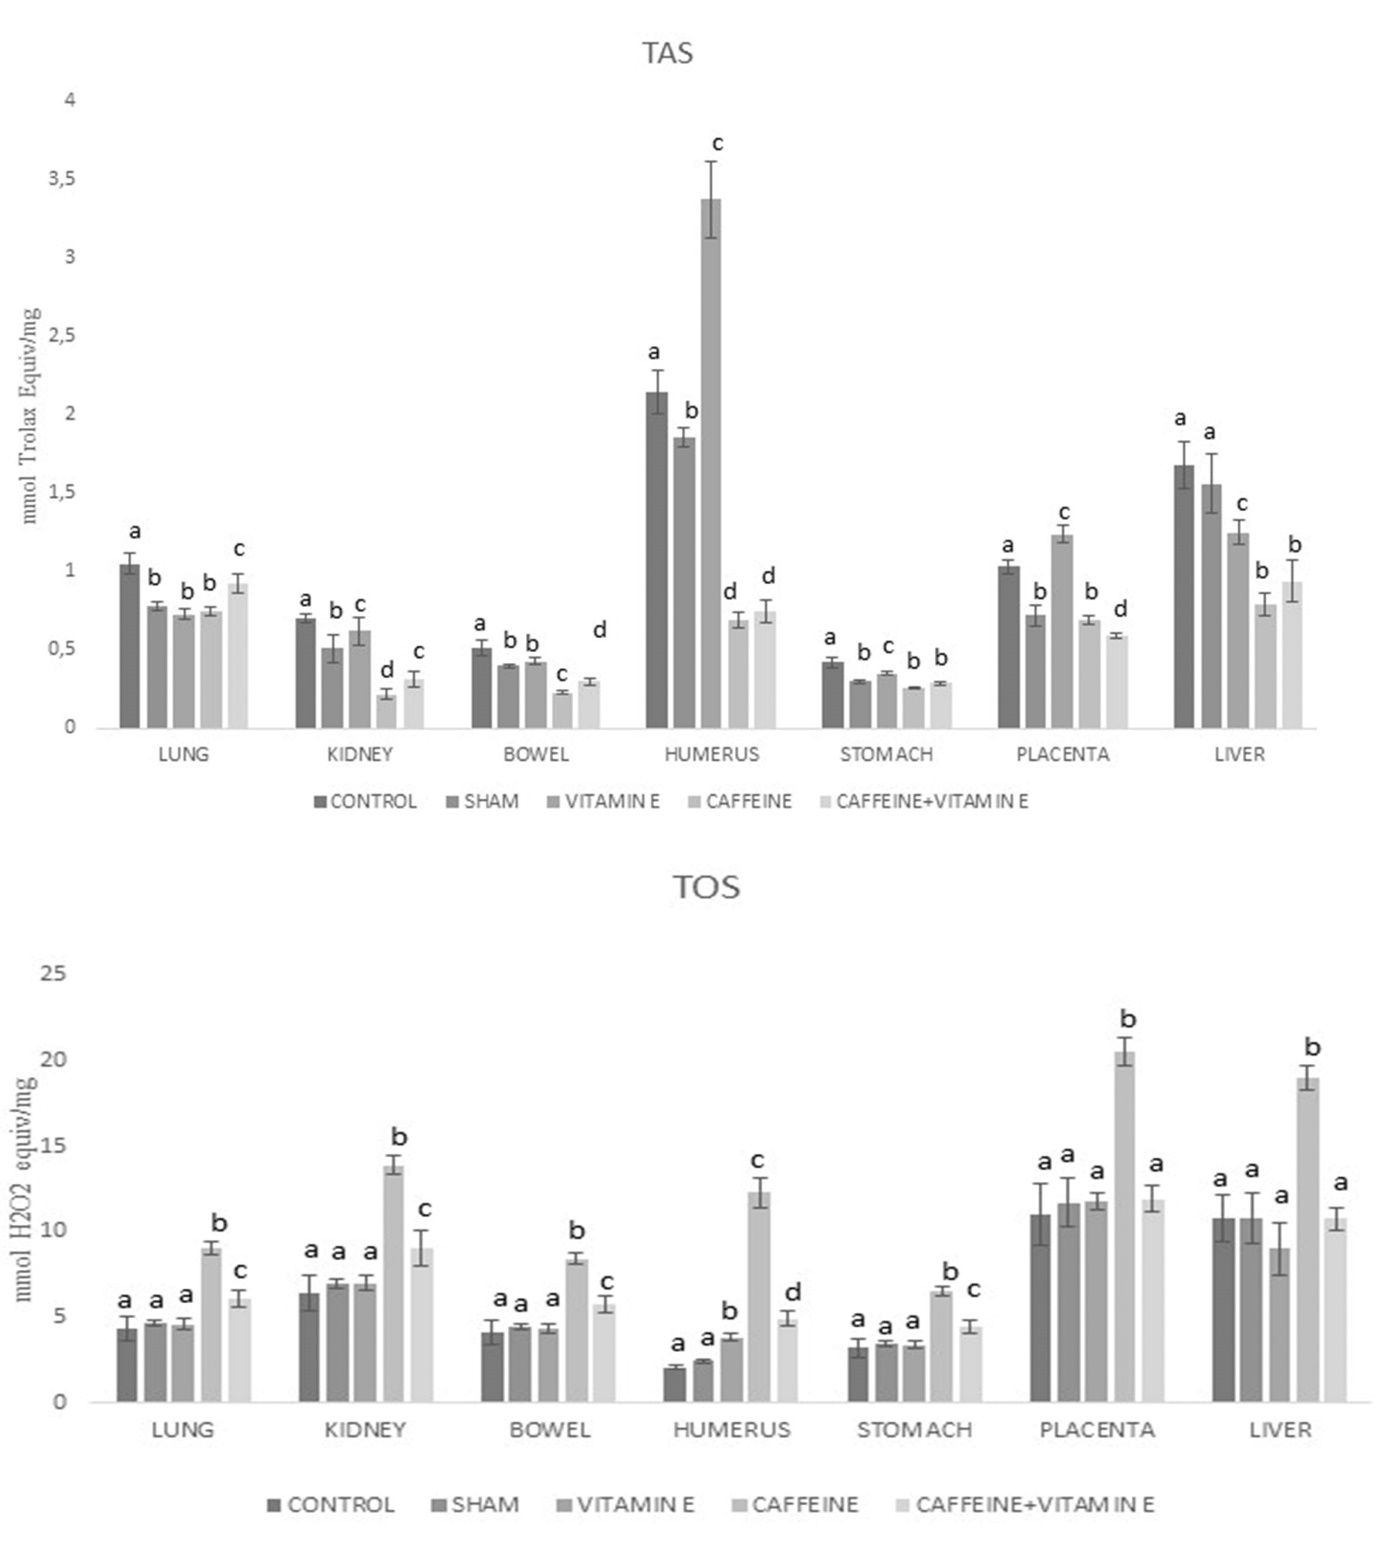
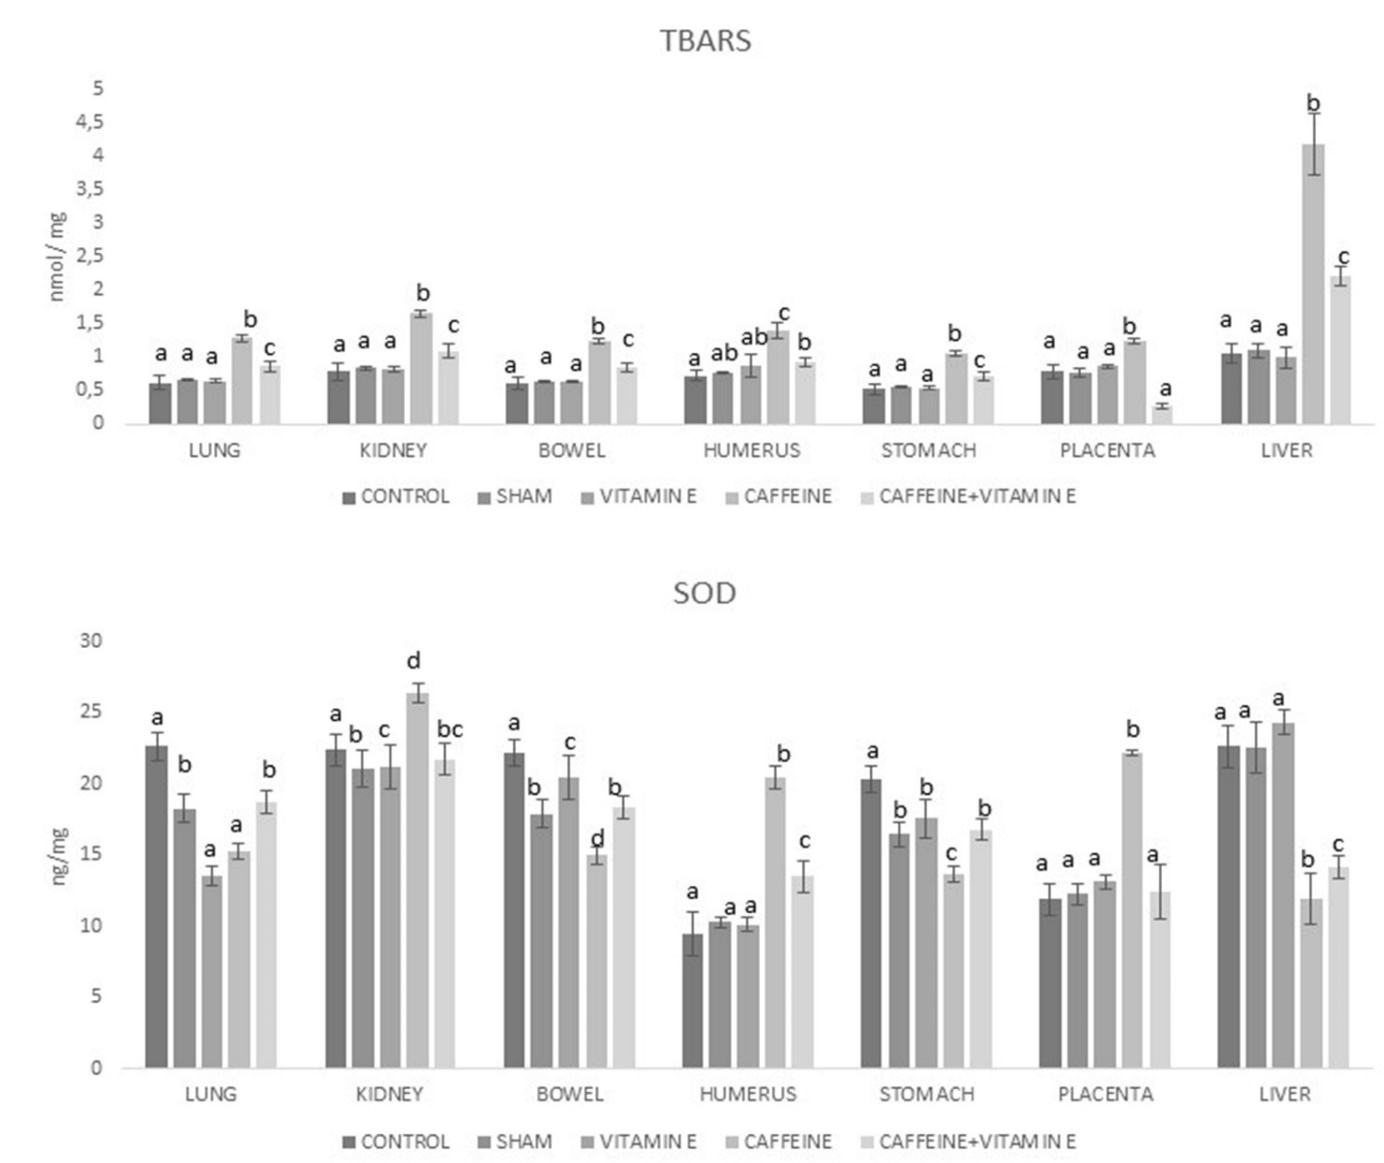
The highest TAS value obtained at Vitamin E group whereas the highest TOS value obtained at caffeine group. Vitamin E administration increased antioxidant status significantly in caffeine group. Vitamine E showed more antioxidant effect while used without caffeine. TOS values showed that the highest oxidant effect observed at caffeine group. Control group has the lowest TBARS, TOS and OSI values. Oxidative stress index was calculated as ratio of TOS and TAS. OSI was in caffeine group considerably higher than the other groups. OSI decreased in vitamin E administrated groups. In caffeine group SOD and TBARS has highest value compared to the other groups. (Fig. 3-5).

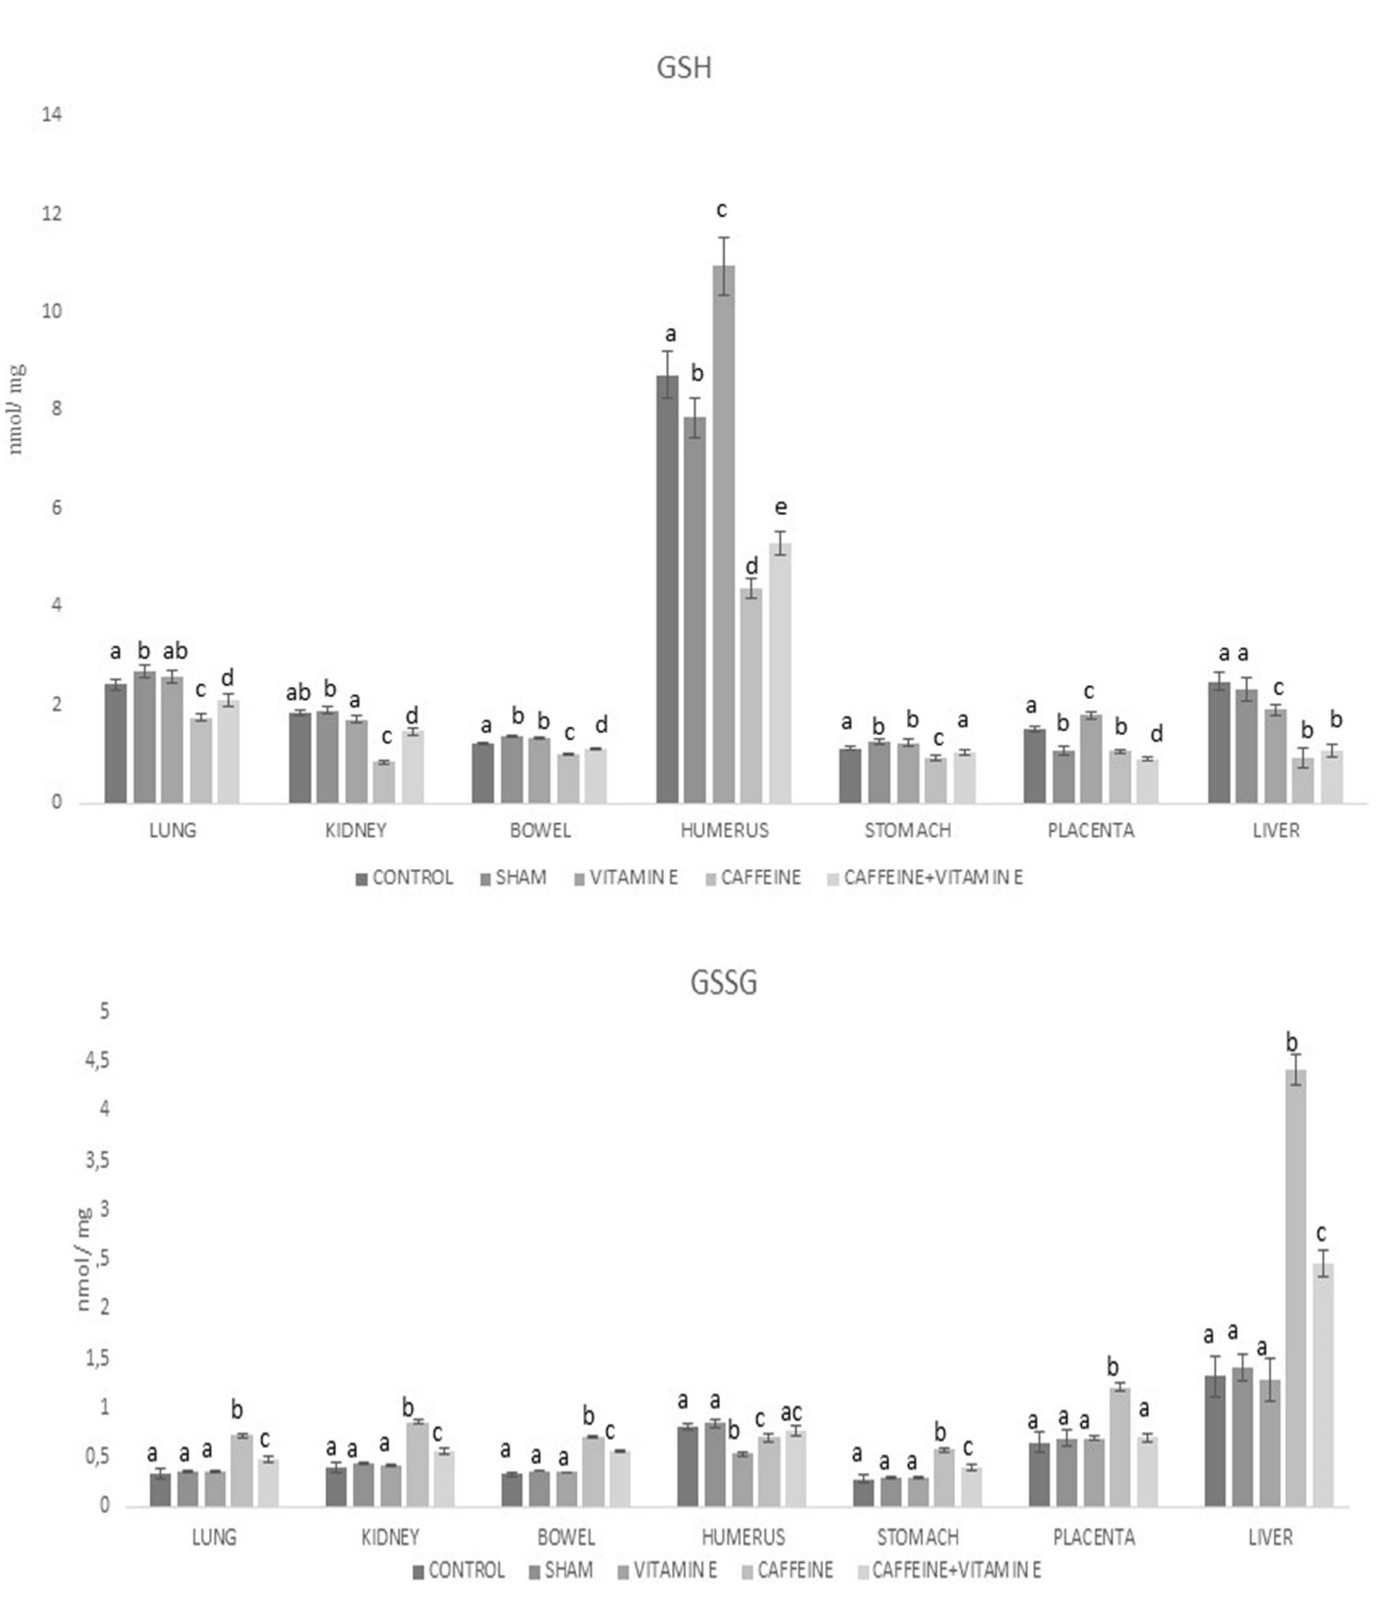
GSH level in humerus is the highest in vitamin E conditions, while in other organs, it is the lowest in caffeine groups. GSSG also has the highest value in the liver in the Caffeine group. Vitamin E increased GSH value while decreased GSSG values comparing Caffeine and control groups respectively (Fig.6). According to these results Vitamin E markedly decreased oxidative stress via stimulating antioxidant system.
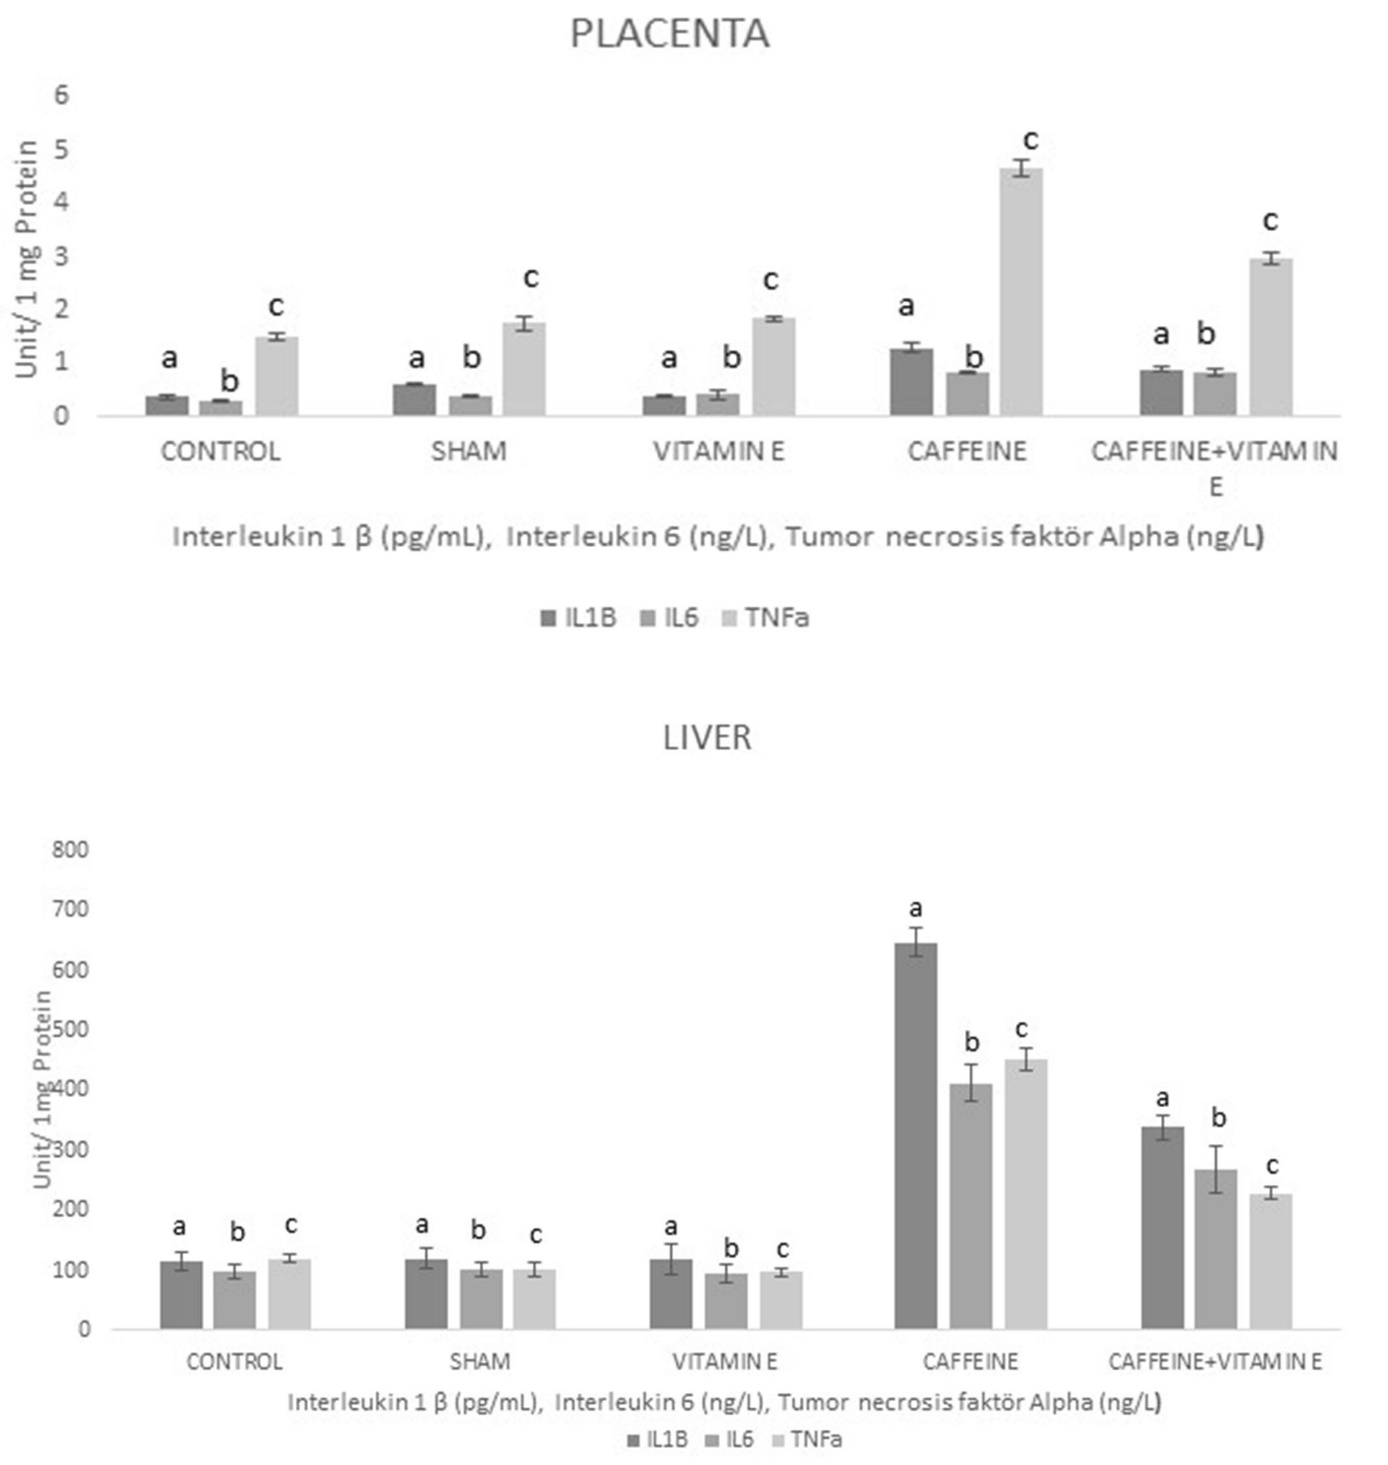
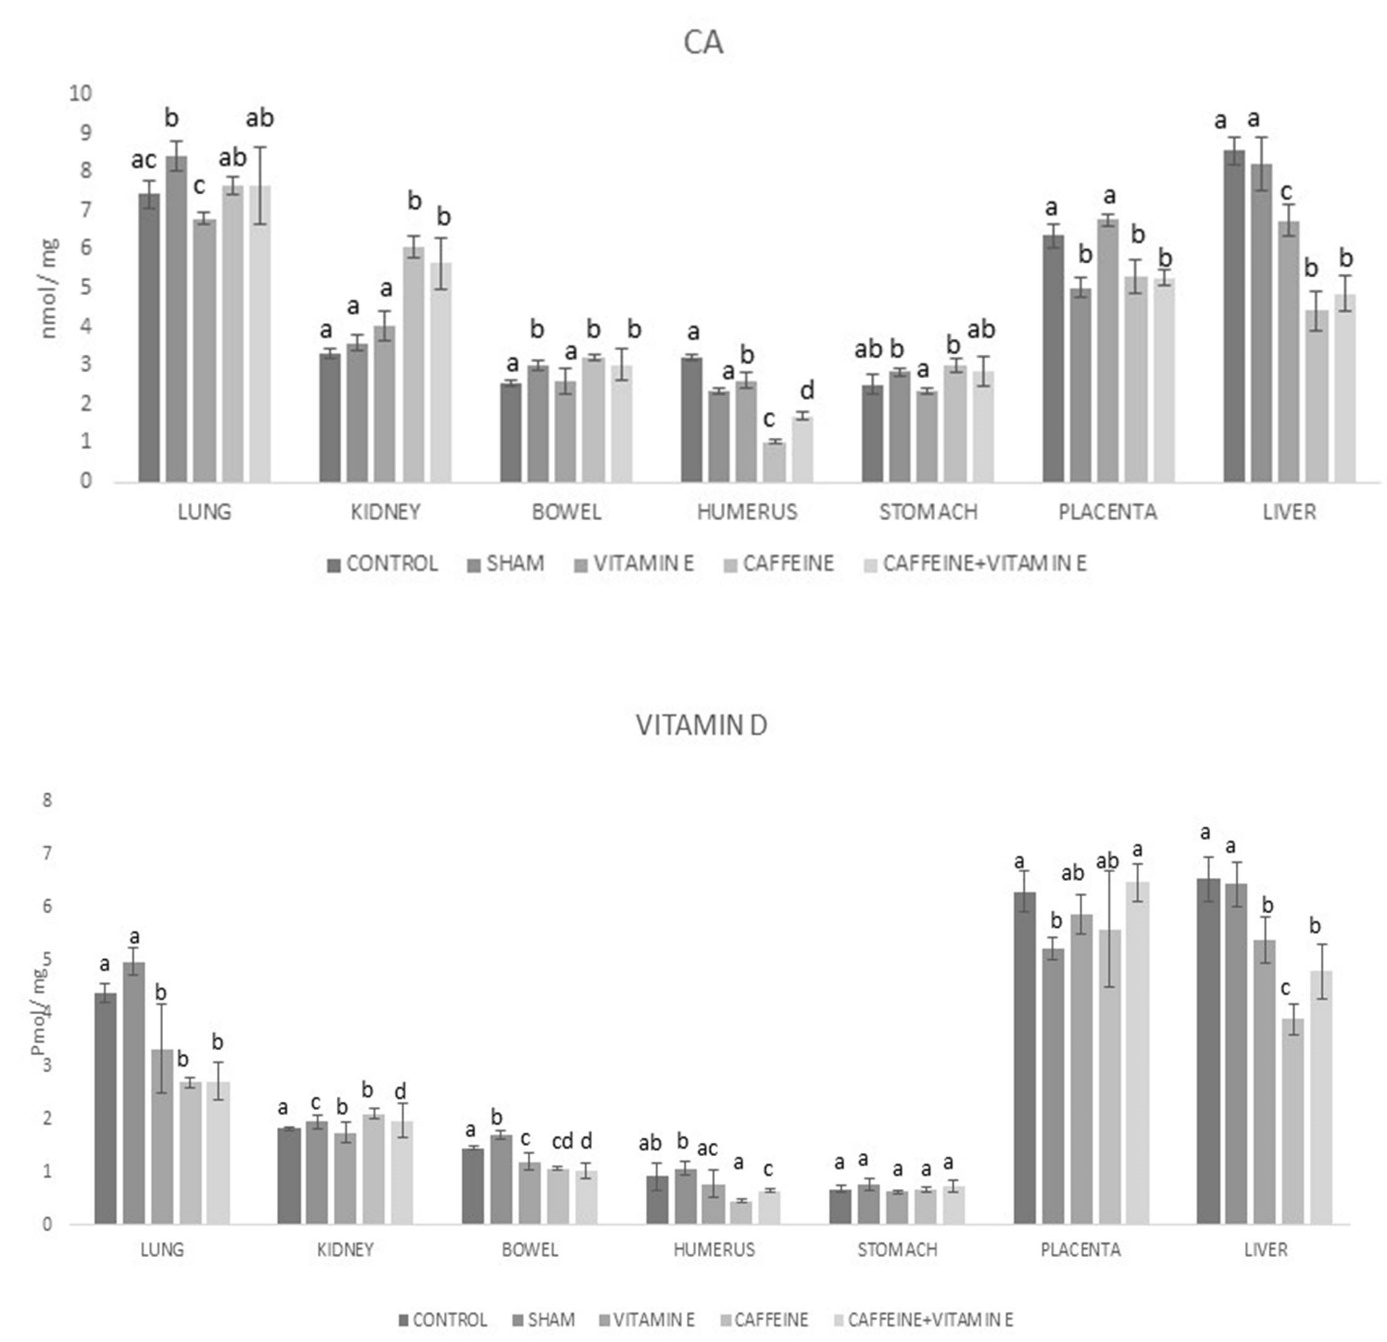
IL-1β, IL-6 and TNF-α values were notably higher in caffeine group than in all the other groups (Fig.7).Vitamin E particularly showed an anti-inflammatory effect against caffeine via reducing tissue levels of IL-1β IL-6 and TNF-α. In vitamin E group, the level of Ca2+in the humerus, placenta and liver of the fetuses was found higher than the other groups. In Vitamin E group, Vitamin D value has the highest level (Fig.8).
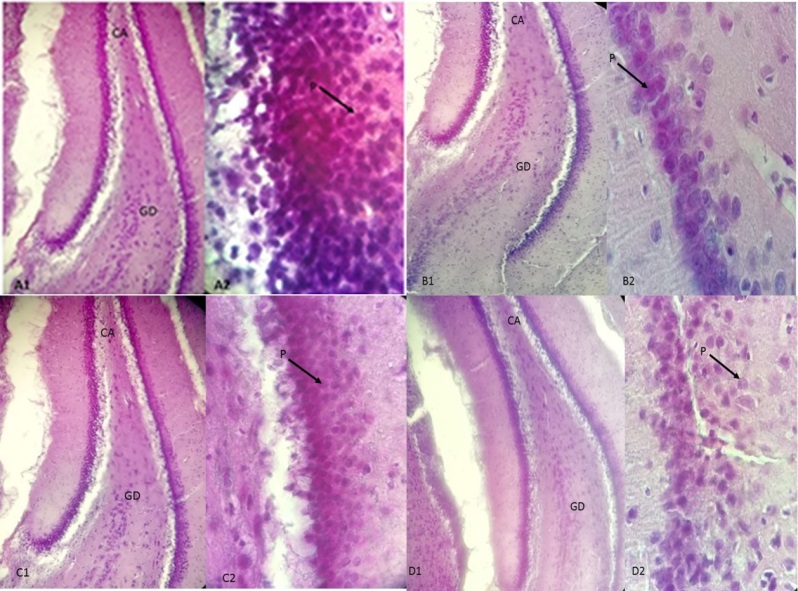
Pyramidal Cells in the Hippocampus
Average pyramidal cell numbers were calculated for the groups. The average number of pyramidal cells in the control group was found to be 601,231. In previous studies, the average number of pyramidal cells was expressed between 650,000-700,000 and in our study it was slightly less than these results [30, 31]. (Table 4). Possible differences in these measurement results are thought to result from the particle distribution in the Z axis of the tissues in the paraffin block. It is seen that the total number of pyramidal cells in the Caffein group is lower than the control group. There is a statistically significant difference between the control group and other groups (Fig.9).
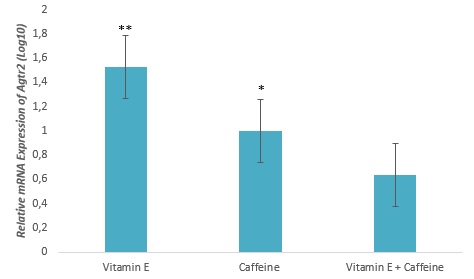
Placental Gene Expression of Agtr2
The gene expression levels of Agtr2 were significantly increased in the placentas exposed to Vitamin E (p<0>0,05) compared to the controls
Current studies in the literature show that caffeine intake cause toxicological effects especially on the fetus [17]. Cytochrome P450 1A2, the primary enzyme responsible for caffeine metabolism, is not found in both the plesanta and the fetus. This situation causes the metabolic rate of caffeine, which can pass through the plesanta barrier, to be completely dependent on the metabolic capacity of pregnant women and results in the longevity of caffeine [18]. Lamy et al. (2020), in their study, they investigated the caffeine usage of pregnant women and their possible effects on newborns in France and stated that mothers who took at least 100 mg of caffeine per day had shortened birth times. In the study, pregnant rats were administered caffeine and a significantly increased oxidative stress was observed compared to the control group. It is predicted that vitamin E, a powerful antioxidant, will prevent the toxic effect of caffeine in fetal organs [19]. Tomaszewski et al. (2016), in their study, they gave 30 mg/kg caffeine orally to pregnant rats and examined the bone / cartilage ratio of fatuses by the double skeletal staining method. As a result of their studies, they reported that the bone ratio of fetuses exposed to caffeine was lower than the control group [20]. Yılmaz et al. (2018), investigated the protective effects of melatonin against the effects of nicotine on bones in their study; and found that the percentage and rate of ossification was low in the upper and lower extremity bones of the group to which 6 mg/kg nicotine was administered (31.42 ± 10.33) compared to the control group (43.71 ± 2.33). In their study, they stated that this ratio was close to the Control Group in the melatonin group [21]. Goyal et al. (2010), reported that, placental insufficiency is associated with increased expression of many RAS genes. Also, it is reported that, the Agtr2 appears to be re-expressed or up-regulated after vascular injury, myocardial infarction, cardiac failure or wound healing, possibly reflecting re-activation of a foetal genetic programme [22]. The renin-angiotensin system (RAS) in the placenta is a key player in the regulation of maternal-fetal blood flow during pregnancy. It is well known that placental vascular dysfunction negatively affects fetal growth [23]. Angiotensin II is the key effector hormone of the renin–angiotensin system (RAS), causing vasoconstriction, increased afterload, and sodium and fluid retention. All of these actions affect the cardiovascular system and increase blood pressure [24]. Also, AT2 is involved in apoptosis, reduction of endothelial cell growth, cell migration, vasodilation, and reduction of vascular injury [25]. It is reported that the function of the AT2 receptor involved in antiproliferative effects and programmed cell deathAT2 receptor stimulation results in a decrease in MAP kinase activity [26]. The antiproliferative character of the AT2 receptor is reflected in the inhibition of MAP kinase activity [27]. de Gasparo and Siragy, (1999) reported that, Agtr2 is expressed at low density in adult tissues but up-regulated in pathological circumstances and the Angiotensin II receptor plays a role in the pathogenesis and remodeling of cardiovascular and renal diseases [28]. In our study, the results demonstrated that there was an upregulation of mRNA of Angiotensin II receptor expressed in placentas which exposed to E vitamine, caffeine and join effect.
It was determined that there was a decrease in bone development and ossification rate in fetuses of pregnant rats exposed to caffeine. Vitamin E were given to rats against caffeine and it was observed that the ossification increased. Vitamin E supplementation significantly improved anatomical and biochemical and pyramidal cells number findings after caffeine administration and prevented oxidative stress and inflammation. According to these data, we think that vitamin E can be used as a potential therapeutic agent to prevent bone loss induced by caffeine and that our results will be useful in model studies on vitamin E and caffeine.
Data available on request from the authors. The data that support the findings of this study are available from the corresponding author upon reasonable request.
The authorsdeclare no potential conflict of interests.
No funding source was obtained from anywhere in the study, and an experimental study was conducted with our own means.
Dear Editorial Team, Clinical Medical Reviews and Reports. My experience with the journal was highly positive. The peer-review process was rigorous, constructive, and completed in a timely manner. The reviewers provided valuable comments that helped improve the quality and clarity of our manuscript. The editorial office was professional, responsive, and supportive throughout all stages of the publication process. Communication was clear and efficient, and any questions were addressed promptly. Overall, I found the journal to maintain high scientific standards and an excellent publication workflow. I would be pleased to consider submitting future work to this journal. Best wishes from, Elena Popa.

It was my pleasure to submit my testimonial concerning the Reviewer Board of our Scientific Journal “Brain and Neurological Disorders”. The Reviewers focused on some modifications and their contribution was helpful. The ladies of our Editorial Office were also supported my efforts. It was my honor to have such a co-operation and I am looking forward for more collaboration.

Dear Grace Pierce, Editorial Coordinator of Journal of Clinical Research and Reports, Thank you for the speedy and efficient peer review process. I appreciate the fact that your peer reviewers do not take months to respond like with some other journals. I would also like to thank the editorial office for responding quickly to my questions. It is an excellent journal. I plan to submit more manuscripts in the future. Best wishes from, Robert W. McGee

Dear Grace Pierce, Editorial Coordinator of Journal of Clinical Research and Reports, Working with you and your team on our recent publication in JCRR has been a truly wonderful and enjoyable experience. The responses were prompt, and the reviewers were patient, constructive, and highly professional. One reviewer in particular gave me the feeling that a professor was carefully reading and commenting on my coursework, which was deeply touching. The entire process was straightforward and hassle‑free, with no tedious online forms to complete. I highly recommend this journal. Best wishes from, DR Aibing Rao, Head of R&D

I Appreciate the Opportunity to Share my Experience with the Journal of Clinical Research and Reports. The peer review process was timely and constructive, and the feedback provided helped improve the quality of our manuscript. The editorial office was professional, responsive, and supportive throughout the process, ensuring smooth communication and efficient handling of the submission. Overall, it was a positive experience collaborating with your team.

Dear Mercy Grace, Editorial Coordinator of Obstetrics Gynecology and Reproductive Sciences, We would like to express our gratitude for your help at all stages of publishing and editing the article. The editors of the magazine answer all the necessary questions and help at every stage. We will definitely continue to cooperate and publish other works in the Obstetrics Gynecology and Reproductive Sciences! Best wishes from, Alla Konstantinovna Politova,
