
Research Article | DOI: https://doi.org/10.31579/2766-2314/131
1,2 Department of Physiology, Faculty of Medicine, Sabratha University, Libya
3 Department of Biomedical Sciences, School of Basic Sciences, Libyan Academy, Tripoli, Libya
*Corresponding Author: Azab Elsayed Azab, Department of Physiology, Faculty of Medicine, Sabratha University, Libya.
Citation: Azab E. Azab, J. M. Jbireal, and Ruwaydah A. Salem, (2024), Effect of Covid-19 Infection on Haematological and Immune Antibodies Titer among Infected Patients in the Maitega Isolation Centers, Tripoli, Libya, J, Biotechnology and Bioprocessing, 5(1); DOI:10.31579/2766-2314/131
Copyright: © 2024, Azab Elsayed Azab. This is an open access article distributed under the Creative Commons Attribution License, which permits unrestricted use, distribution, and reproduction in any medium, provided the original work is properly cited.
Received: 02 January 2024 | Accepted: 12 January 2024 | Published: 19 January 2024
Keywords: coronavirus disease 2019, hematological parameters, immune antibodies titer, d-dimer, crp
Background: Coronavirus disease 2019 (COVID-19) caused by severe acute respiratory syndrome coronavirus 2 (SARS-CoV- 2) has become a global pandemic causing significant mortality and morbidity.
Objectives: This study aimed to examine the alterations in hematological parameters and immunoglobulin levels in COVID-19 patients and determine any potential correlation between the changes in specific hematological variables and the severity of COVID-19 infection among infected patients in the Maitega Isolation Centers, Tripoli, Libya.
Subjects and Methods: This cross-sectional study was conducted between September 2021 and March 2022. Among 50 infected patients (26 males & 24 females) and 50 healthy individuals (23 males& 27 females) without any chronic disease or respiratory symptoms were recruited for the control group. Structured questionnaires were used to obtain data. 5 ml of venous blood was collected from each participant for estimation of complete blood count (CBC), serum COVID-19 IgM and COVID-19 IgG, Ferritin, C Reactive Protein, and D-dimer using CBC PKL analyzer and The Fluorecare instrument.
Results: The results showed that patients with COVID-19 had a significant (P<0.05) decrease in lymphocytes count and RBCs count at first day of the infection to 7 days, and after 14 days of infection, respectively compared with the healthy individuals, non-statistically significant (P>0.05) changes were observed in hemoglobin concentration, WBCs, granulocytes, and platelets counts compared with the healthy individuals. The patients with COVID-19 had a significant (P<0.0001) increase in IgM levels during 1-7 days of infection compared with healthy individuals, respectively compared with the healthy individuals. Also, IgG levels were showed a gradual significantly (P<0.0001) increase during COVID-19 Virus Infection among COVID-19 patients after 14 days compared with the controls. additionally, coronavirus infection caused a significant (P<0.0001) increase in D-dimer, CRP, and Ferritin levels compared with the healthy control individuals,
Conclusion: It can be concluded that coronavirus infection caused a significant decrease in Lymphocytes count and an increase in IgM, IgG, D-dimer, CRP, and Ferritin levels at different periods compared to the controls. Further studies are needed to confirm these results. COVID-19 specific immunoglobulins and some inflammatory factors in COVID-19 patients. These changes in IgM, IgG, D-dimer, CRP, and Ferritin levels during COVID-19 Virus Infection among COVID-19 patients may help clinicians to better understand COVID-19 and provide more clinical treatment options.
The emergence of the coronavirus disease 2019 (COVID-19) in Wuhan, China marked the beginning of a highly transmissible virus that rapidly spread across the world, leading to a global pandemic (1). This virus, officially known as severe acute respiratory syndrome coronavirus 2 (SARS-CoV-2), has posed a significant health challenge due to its high mortality rate and rapid spread (2). As of November 2022, the World Health Organization (WHO) has reported over (637.737.550) confirmed cases of COVID-19 globally, with 6.611.874 recorded deaths (3). Coronaviruses are a family of large viruses within the Corona viridae family (4). These viruses have a single-stranded RNA genome (5) and are surrounded by a helical capsid and a lipoprotein envelope that contains several spicules of glycoprotein, giving the virus a crown-like appearance (6). The SARS-CoV-2 virus can cause severe clinical complications, particularly in elderly patients and those with underlying comorbidities such as diabetes (7), cardio and cerebrovascular diseases (8), obesity, cancer, and pathologies of the digestive, endocrine, nervous, and respiratory systems (9).
SARS-CoV-2, a member of the Coronaviridae family, is a type of coronavirus that has been identified in avian hosts as well as several other species (10). Effective management of COVID-19 infection requires early diagnosis, appropriate treatment, and future control measures to limit the spread of the virus. Result of Laboratory parameters play a crucial role in confirming COVID-19 diagnosis and can help discriminate between severe and non-severe cases, as well as those at high or low risk of mortality (11).
The role of white blood cells, hemoglobin, and platelets in the manifestation of signs and symptoms of coronavirus disease 2019 (COVID-19) has been documented (12). Serological testing, which detects antibodies, is another common laboratory diagnostic tool that can aid in the diagnosis of the disease (13). The detection of IgM and IgG antibodies is particularly useful for serological diagnosis and for understanding the prevalence of the infection in the population, as well as for implementing control measures (14, 15). Antibody testing for SARS-CoV-2 is rapid and sensitive, making it a valuable adjunct for the diagnosis of COVID-19 (15).
During the early stages of (COVID-19) 2019, inflammatory biomarkers such as C-reactive protein (CRP) and Ferritin are notably elevated. Therefore, it is important to screen for inflammation-associated biomarkers and coagulation tests including Ferritin, C-reactive protein, and D-dimer to help in the diagnosis of the disease (16). Recent clinical studies have suggested that CRP and other factors like Ferritin, Coagulation Factors and Inflammatory indexes may be associated with the severity of COVID-19 (17). Many studies found that C-reactive protein is a reliable diagnostic tool for predicting the severity of coronavirus disease 2019 in its early stages. In summary, the available literature suggests that CRP levels could be an indicator of disease severity during the early stage of COVID-19 (18).
This study aimed to examine the alterations in hematological parameters and immunoglobulin levels in COVID-19 patients and determine any potential correlation between the changes in specific hematological variables and the severity of COVID-19 infection among infected patients in the Maitega Isolation Centers, Tripoli, Libya
3.1 Study Type and Design
This study utilized a descriptive cross-sectional observational design.
3.2. Study Population:
The study population included both male and female COVID-19 infected patients from different age groups. Healthy individuals were also included as a control group for comparison purposes.
3.3. Sample Size:
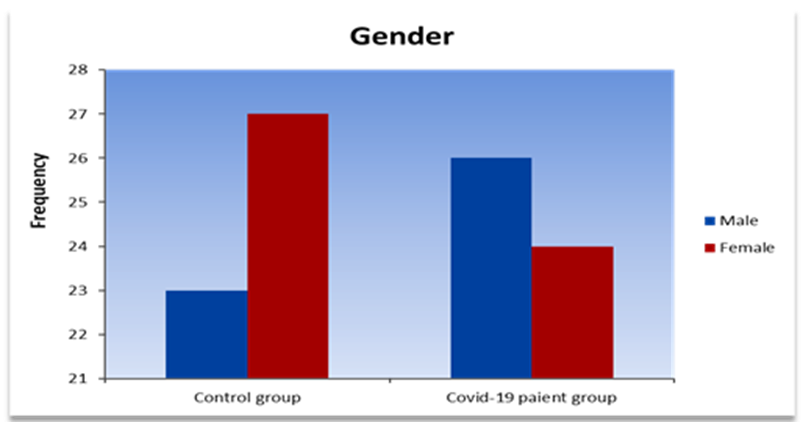
In this study, a total of 150 blood samples were collected from individuals infected with COVID-19, with 100 samples representing cases in the study group. Among the study group, 50 samples were collected within the first 7 days of infection, while another 50 were collected after 14 days. Furthermore, a control group consisting of 50 healthy individuals matched for age and gender was included for comparison purposes. Out of the 50 COVID-19 patients, 26 (52%) were male and 24 (48%) were female, while the control group consisted of 23 (46%) males and 27 (54%) females (Table. 1).
Groups Gender | Control group | Covid-19 patients | ||
| Frequency | Percent (%) | Frequency | Percent (%) | |
| Males | 23 | 46% | 26 | 52% |
| Females | 27 | 54% | 24 | 48% |
Table. 1: Distribution of gender among control group and Covid -19 patients
3.4. Ethical Considerations
This study was conducted with ethical approval from the ethical committee of the Libyan Academy of Science and the Maitega Isolation Centers, which was used as a point for sample collection. Informed consent was obtained from all participants and their families before they were included in the study, ensuring compliance with ethical standards.
3.5. Sample Collection:
Each participant provided a 5 ml venous blood sample in an EDTA tube for complete blood count (CBC) analysis. An additional 3 ml of blood was collected in a plain tube for measurement of ferritin, D-dimer, C-reactive protein (CRP), and Covid-19 IgM, and IgG.
3.6. Hematological Study:
The blood samples for CBC were analyzed using an automated blood analyzer (PKL), following the manufacturer's instructions. Further investigations were conducted for ferritin, D-dimer, CRP, and Covid-19, IgM & Covid-19IgG using manual kit and automatic measurement methods by Flurocare.
3.7. Statistical Analysis:
The normal continuous variables were presented by means and standard errors (SE), the non-normal continuous variables were presented by medians and interquartile range (IQR), categorical variables were presented as counts and percentages. The statistical tools used for analyzing the data is SPSS 27 and Graph Pad Prism 8. The Shapiro-Wilk test is used to assess the normality of the distribution of the continuous variables. The statistical significance of the difference between groups were evaluated by t-test and ANOVA for normal variables, whereas for non-normal continuous variables; Kruskall-Wallis H test is used for comparing more than two independent samples, Mann-Whitney U test is used for comparing two independent samples, and Willcoxon signed rank test is used for comparing two related samples. Chi-square statistical analysis was performed to determine significant values. Pearson correlation coefficient is used to evaluate the relations between continuous variables and spearman rank correlation is used to evaluate the relations between categorical variables. A P-value of less than 0.05 is considered statistically significant.
This study included 150 blood sample from patients infected with COVID-19, 100 of them represented cases (study group): 50 during the first 7 day of infection ,50 repeated test after 14 day, and (50) represented healthy age and gender matched subjects were included as compare group (control group). Out 50 patients with COVID-19, 26 (52%) males and 24(48%) females, were the (control group), 23 (46%) males and 27(54%) females (Figure.1).
The mean ages of the patients was 30% years (40-50) years; while the control group mean age was 24%(60-70) years (Table.2 & Figure.2).
Groups Age Groups | Control group (n=50 | COVID-19 patients’ group (n=50) | ||
| Frequency | Percent (%) | Frequency | Percent (%) | |
| 30 - 40 | 10 | 20 | 1 | 2 |
| 40 - 50 | 9 | 18 | 15 | 30 |
| 50 - 60 | 9 | 18 | 7 | 14 |
| 60 - 70 | 12 | 24 | 14 | 28 |
| 70 - 80 | 5 | 10 | 6 | 12 |
| 80 - 90 | 5 | 10 | 6 | 12 |
| > 90 | 0 | 0 | 1 | 2 |
Table.2: Distribution of age among control group and Covid-19 patients.
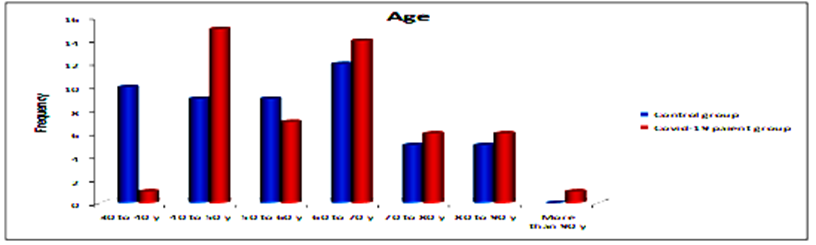
Figure.2: Descriptive of control group and patients according to ages
Table.3 and Figure.3 Shows that (60%) of control group were vaccinated with two doses while (48%) of the patients were, (20%) of control group were vaccinated with one dose while (18%) of the patients were, and (20%) of control group were not vaccinated while (34%) of the patients were non vaccinated.
| Groups | Control group | COVID-19 patients | ||
| Vaccinations | Frequency | (%) | Frequency | ( (% |
| unvaccinated | 10 | 20% | 17 | 34% |
| single dose | 10 | 20% | 8 | 16% |
| 2 doses | 30 | 60% | 25 | 50% |
| Total | 50 | 100% | 50 | 100% |
Table 3: Disripution of vaccinated items of control group and patients
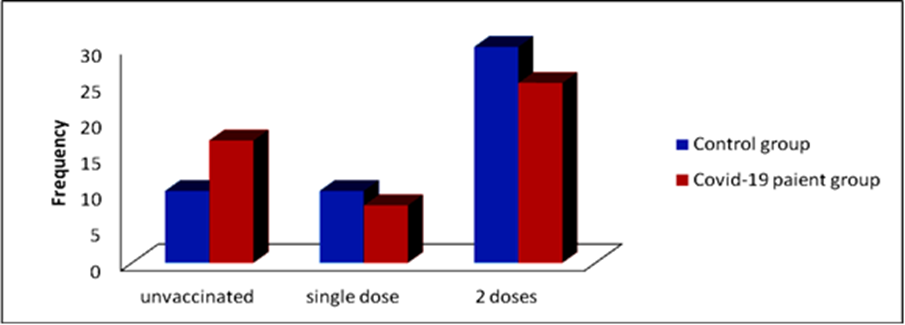
Figure 3: Distribution of control group and patients according to vaccination
Table.4 shows that the IgG means for control group and the patients after 7 days and then after 14 days 0.4004±0.08 and the IgG means for control group and the patients after 7 days and then after 14 days are 0.862±0.32 and 21.49±4.05, respectively (Figures. 4-6).
| P Value | F | 14 days | 7days | Control | Groups Parameters |
| Mean±SE | Mean±SE | Mean±SE | |||
| <0> | 22.07 | 0.032±0.01 | 12.50±2.68 | 0.00±0.00 | Serum IgM (AU/mL) |
| <0> | 26.10 | 21.49±4.05 | 0.862±0.32 | 0.4004±0.08 | Serum IgG (AU/mL) |
Table.4: Serum IgM and IgG levels in control and at 7 and 14 days of COVID-19 Virus Infection
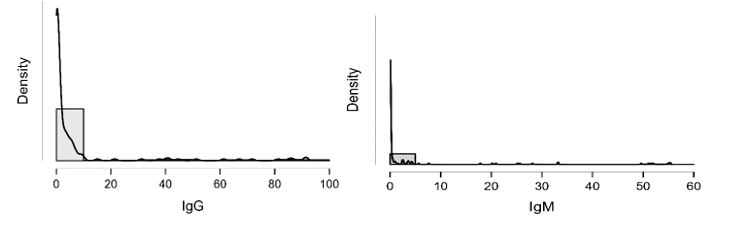
Figure 4: shows the densities of IgG and IgM which is clearly not normally distributed
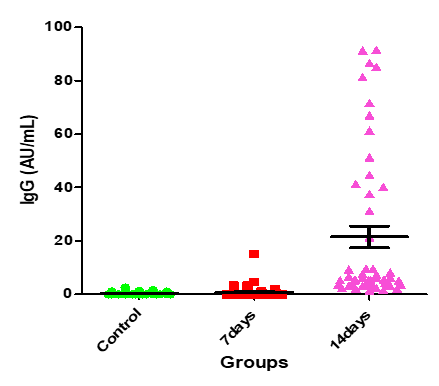
Figure 5: Medians (IQR) of IgG count in control group and the patients group during covid-19 virus infection
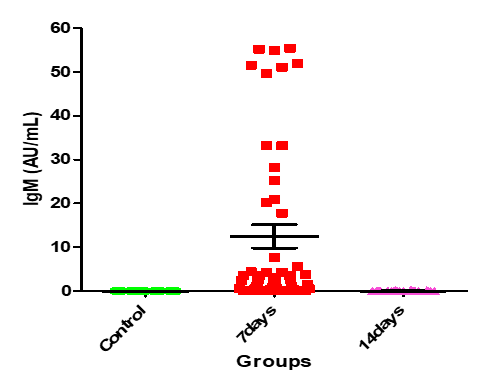
Figure 6: Medians (IQR) of IgM count in control group and the patients group during COVID-19 virus infection
In Table.5, Kolmogorov-Smirnov Z test shows that the IgG of the two independent groups (control group, patients through the first 7 days group) are similar in the shape (have the same distribution) since p-value > α, consequently; Mann-Whitney U test shows that the distributions of the two groups are equal and then there is no significant difference between the medians of the IgG of the two groups. Again, Kolmogorov-Smirnov Z test shows that the IgG of the two independent groups (control group, patients after 14 days group) differs in shape since p-value < α, and then according to Mann-Whitney U test the mean ranks of the two groups differ significantly. Similarly, for the IgM; Kolmogorov-Smirnov Z test shows that the IgM of the two independent groups (control group, patients through the first 7 days group) and again of the two independent groups (control and patients after 14 days) differs in shapes since p-values < α, and then according to Mann-Whitney U test the there is a significant difference between mean ranks of each pair of groups.
| Control | |||||
Group
| Kolmogorov-Smirnov Z | Mann-Whitney U | |||
| parameters | Statistic | p-value | Statistic | p-value | |
| IgG | 0-7 days | 1.000 | 0.270 | 1125.500 | 0.391 |
| 14 days | 4.800 | <0> | 8.000 | <0> | |
| IgM | 0-7 days | 4.700 | <0> | 75.000 | <0> |
| 14 days | 2.900 | <0> | 525.000 | <0> | |
Table 5: Mann-Whitney test for the significance of the differences in ranks of IgG and IgM between controls and patients
From Wilcoxon signed rank test for the paired samples (patients through the first 7 days and patients after 14 days), it is clear that there are statistically significant differences between the ranks of the two groups for IgG and IgM (Table.6)
| N | Mean Rank | Wilcoxon Z | p-value | ||
| IgG14 – IgG7 | Negative Ranks | 3 | 15.00 | -5.720 | <0> |
| Positive Ranks | 47 | 26.17 | |||
| Ties | 0 | ||||
| IgM14 - IgM7 | Negative Ranks | 46 | 24.35 | -5.884 | <0> |
| Positive Ranks | 1 | 8.00 | |||
| Ties | 3 | ||||
Table.6:Wilcoxon signed rank test for the significancy of differences in ranks of IgG and IgM of the patients group during covid-19 virus infection
The IgG mean for non-vaccinated is (9.888±3.477) with median (0.568) and IQR (5.4515), and the IgG mean for one-dose vaccinated is (7.975±3.499) with median (0.861) and IQR (5.2525), whereas the IgG mean for two-dose
vaccinated is (6.143±1.933) with median (0.886) and IQR (3.1548). And the IgM mean for non-vaccinated is (5.376±2.154) with median (0.0135) and IQR (0.522), and for one-dose vaccination is (4.059±2.133) with median (0.0095) and IQR (2.082) (Table.7).
| Mean | Std. Error | Std. Deviation | Min | Max | Median | IQR | ||
| IgG | Not | 9.888 | 3.477 | 23.063 | 0.000 | 91.524 | 0.568 | 5.4515 |
| 1-dosage | 7.975 | 3.499 | 18.516 | 0.020 | 41.325 | 0.861 | 5.2525 | |
| 2-dosages | 6.143 | 1.933 | 17.072 | 0.000 | 86.654 | 0.886 | 3.1548 | |
| IgM | Not | 5.376 | 2.154 | 14.287 | 0.000 | 54.910 | 0.0135 | 0.5220 |
| 1-dosage | 4.059 | 2.133 | 11.285 | 0.000 | 55.210 | 0.0095 | 2.0823 | |
| 2-dosages | 3.710 | 1.306 | 11.530 | 0.000 | 55.400 | 0.000 | 0.1398 |
Table.7: Descriptives of IgG and IgM according to number. of dosages vaccination
Table.8 shows that there are no significant differences In IgG and IgM according to the levels of vaccination and vaccination has a weak effect upon IgG and IgM. For the non-vaccinated individuals, as like as 1-dose vaccinated and 2-dose vaccinated individuals; Kolmogorov-Smirnov Z test shows that the IgG of the two independent groups (control group, patients through the first 7 days group) .there is no significant difference between the distributions of the two groups) since p-value greater than α, consequently; Mann-Whitney U test shows that the distributions of the two groups are equal and
then there is no significant difference between the medians of the IgG of the two groups. But for the two independent groups (control group and the patients after 14 days group) are differ in shape (there is significant difference between the distributions of the two groups) for non-vaccinated, 1-dose vaccinated and 2-dose vaccinated individuals since p-values less than α, consequently; Mann-Whitney U test shows that the distributions of the two groups are not equal; i.e., there is a significant difference between the two groups in mean ranks since p-values less than α.
| Vaccinated | N | Mean Rank | Kruskal-Wallis H | p-value | |
| IgG | NonVaccinated | 44 | 75.92 | 0.302 | 0.860 |
| 1_Dos | 28 | 79.16 | |||
| 2_Dos | 78 | 73.95 | |||
| IgM | Non | 44 | 78.17 | 0.644 | 0.725 |
| 1_Dos | 28 | 78.45 | |||
| 2_Dos | 78 | 72.94 |
Table 8: Kruskal-Wallis signed rank test for the significancy of differences in ranks of IgG and IgM of the patients group during covid-19 virus infection
For the non-vaccinated individuals, as like as 1-dose vaccinated and 2-dose vaccinated individuals; Kolmogorov-Smirnov Z test shows that the IgG of the two independent groups (control group, patients through the first 7 days group) .there is no significant difference between the distributions of the two groups) since p-value greater than α, consequently; Mann-Whitney U test shows that the distributions of the two groups are equal and then there is no significant difference between the medians of the IgG of the two groups. But for the two independent groups (control group and the patients after 14 days group) are differ in shape (there is significant difference between the distributions of the two groups) for non-vaccinated, 1-dose vaccinated and 2-dose vaccinated individuals since p-values less thanα, consequently; Mann-Whitney U test shows that the distributions of the two groups are not equal; i.e., there is a significant difference between the two groups in mean ranks since p-values less than α (Table.9).
| Group | N | Mean Rank | Kolmogorov-Smirnov Z | p-value | Mann-Whitney U | p-value | ||
IgG
| Non vaccinated | Control | 10 | 13.40 | 0.768 | 0.598 | 79.000 | 0.763 |
| 0-7 days | 17 | 14.35 | ||||||
| Control | 10 | 5.50 | 2.509 | <0> | 0.000 | <0> | ||
| 14 days | 17 | 19.00 | ||||||
| 1-dose vaccinated | Control | 10 | 9.20 | 0.846 | 0.471 | 37.000 | 0.513 | |
| 0-7 days | 17 | 10.89 | ||||||
| Control | 10 | 5.50 | 2.176 | <0> | 0.000 | <0> | ||
| 14 days | 17 | 15.00 | ||||||
| 2-dose vaccinated | Control | 30 | 26.38 | 0.700 | 0.711 | 326.500 | 0.560 | |
| 0-7 days | 24 | 28.90 | ||||||
| Control | 30 | 15.67 | 3.408 | <0> | 5.000 | <0> |
Table 9: The significancy of differences between control group and patients group in IgG according to vaccination levels
From Wilcoxon Z test for related samples there is a significant difference between the level of IgG of the patients through the first 7 days and the level of IgG of the patients after 14 days in favor of the last for each of the levels of vaccination, since p-values < α as it shown in Table .10
| IgG14 – IgG7 | N | Mean Rank | Wilcoxon Z | p-value | |
| Not vaccinated | Negative Ranks | 1 | 12.00 | -3.053 | 0.002 |
| Positive Ranks | 16 | 8.81 | |||
| Ties | 0 | ||||
| 1-dose vaccinated | Negative Ranks | 0 | 0.00 | -2.666 | 0.008 |
| Positive Ranks | 9 | 5.00 | |||
| Ties | 0 | ||||
| 2-dose vaccinated | Negative Ranks | 2 | 3.50 | -4.086 | <0> |
| Positive Ranks | 22 | 13.32 | |||
| Ties | 0 | ||||
Table 10: The significancy of differences between patients group through the first 7 days and after 14 days in IgG according to vaccination levels
At table .11 Kolmogorov-Smirnov Z test shows that there is a difference between the distributions of the two independent groups (control and patients through the first 7 days) for the three levels of vaccination since p-values < α, and then by Mann-Whitney U test there is a significant difference between the mean ranks of the two groups since p-values < α. Whereas for the two independent groups (control and patients after 14 days) Kolmogorov-Smirnov Z test shows that there is no difference between the distributions of the two groups for the non-vaccinated and 1-dose vaccinated individuals and then by Mann-Whitney U test there is a significant difference between the
medians since p-value < α, but for the 2-dose vaccinated individuals there is a significant difference between the distributions of the two groups by Kolmogorov-Smirnov Z test since p-value < α, and by Mann-Whitney U test there is a significant difference between mean ranks of the two groups.
Similarly, there is a significant difference between the level of IgM of the patients through the first 7 days and the level of IgM of the patients after 14 days in favor of the first for each of the levels of vaccination, since p-values < α as it shown in table.11.
| Group | N | Mean Rank | Kolmogorov Smirnov Z |
p-value | Mann-Whitney U | p-value | ||
| IgM | Non vaccinated | control | 10 | 6.50 | 2.214 | <0> | 10.000 | <0> |
| 0-7 days | 9 | 18.41 | ||||||
| control | 10 | 9.50 | 1.328 | 0.059 | 40.000 | 0.007 | ||
| 14 days | 9 | 16.65 | ||||||
| 1-dose vaccinated | control | 10 | 5.50 | 2.176 | <0> | 0.000 | <0> | |
| 0-7 days | 9 | 15.00 | ||||||
| control | 10 | 7.00 | 1.451 | 0.030 | 15.000 | 0.003 | ||
| 14 days | 9 | 13.33 | ||||||
| 2-dose vaccinated | control | 30 | 16.00 | 3.499 | <0> | 15.000 | <0> | |
| 0-7 days | 24 | 41.88 | ||||||
| control | 30 | 20.50 | 2.130 | <0> | 150.000 | <0> | ||
| 14 days | 24 | 36.25 |
Table 11: The significance of differences between controls and patients in IgM according to vaccination levels
Shapiro-Wilk test table.12 shows that RBC and Granulocytes are normally distributed such that p-value > 0.05, and the others are not distributed normally since p-value < α. It can be seen clearly in figure.7 that the probability densities of RBC and GRAN are near to norma while the others are much differ of the normal distribution.
| Parameters | WBC | RBC | HGB | PLT | Lymphocytes | Granulocytes | D-dimer | CRP | FerrItin |
|---|---|---|---|---|---|---|---|---|---|
| Test | |||||||||
| Shapiro-Wilk | 0.676 | 0.984 | 0.929 | 0.955 | 0.375 | 0.990 | 0.589 | 0.498 | 0.424 |
| P-value | < 0.001 | 0.075 | < 0.001 | < 0.001 | < 0.001 | 0.338 | < 0.001 | < 0.001 | < 0.001 |
Table12: Shapiro-Wilk test for normality of the distributions of the parameter
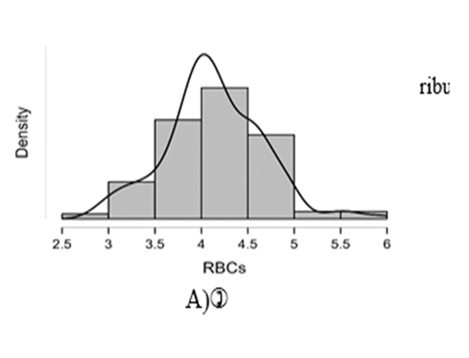
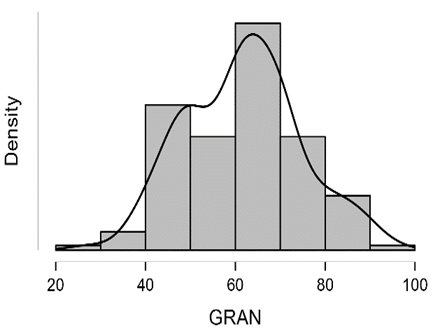
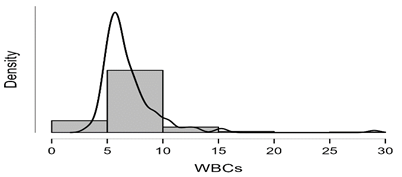
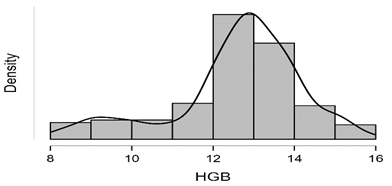
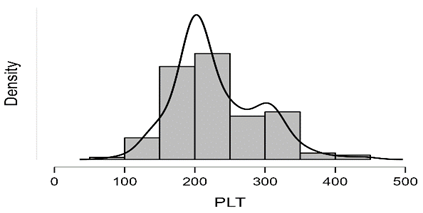
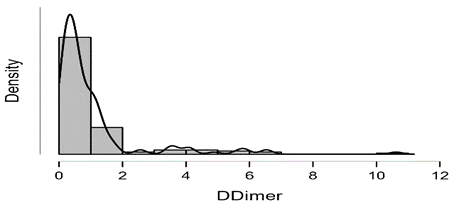
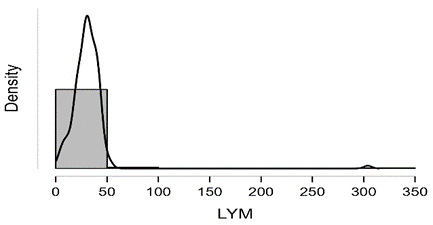
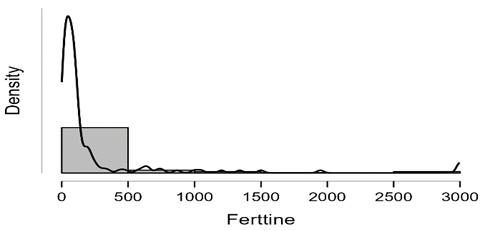
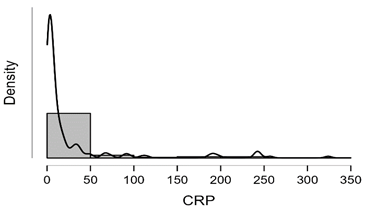
Figure7: Desities of parameters distributions
t-test for independent samples table.13 and figure 8-13 show that there are significant differences between the means of RBC for control and patients through first 7 days, as such as for controls and patients after 14 days such that p-values < α. While from t-test for paired samples there is no significant difference between means of RBC for the patients through the first 7 days and after 14 days as p-value > α. The last figures showed that t test for the paired samples (patients through the first 7 days and patients after 14 days), it is clear that there are no statistically significant differences between the ranks of the two groups for WBC, HGB, PLT and Lymphocytes since p-values > α.
| P Value | F | 14 days of infection | 7days of infection | Control | Groups Parameters |
| Mean±SE | Mean±SE | Mean±SE | |||
| 0.0014 | 6.899 | 4.21±0.07 | 4.27±0.07 | 3.92±0.08 | RBCs count (x 106/μL) |
| 0.1408 | 1.987 | 12.44±0.24 | 12.38±0.27 | 12.95±0.14 | Hemoglobin (g/dl) |
| 0.1848 | 1.708 | 6.47±0.21 | 7.15±0.42 | 6.52±0.20 | WBCs count (x 103/μL) |
| 0.0017 | 6.671 | 29.19±1.08 | 26.34±1.83 | 33.46±1.13 | Lymphocytes % |
| 0.094 | 2.403 | 63.98±1.36 | 62.29±2.29 | 58.52±1.63 | Granulocytes % |
| 0.8495 | 0.1633 | 232.00±11.24 | 232.00±11.24 | 224.90±7.00 | Platelets Count (x103/µL) |
Table 13: Variations in hematological parameters
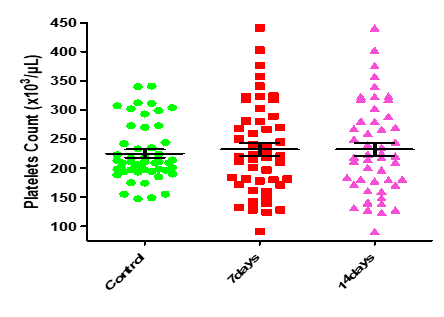
Figure8: Means (std.dev.) of RBC count in control group and the patients group during covid-19 virus infection
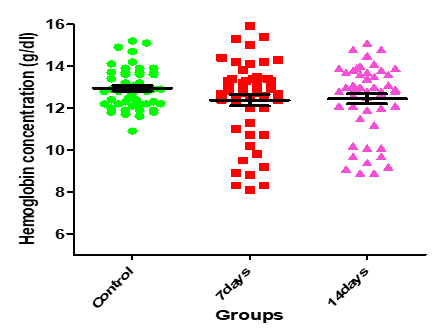
Figure 9: Medians (IQR) of HGB count in control group and the patients group during COVID-19 virus infection
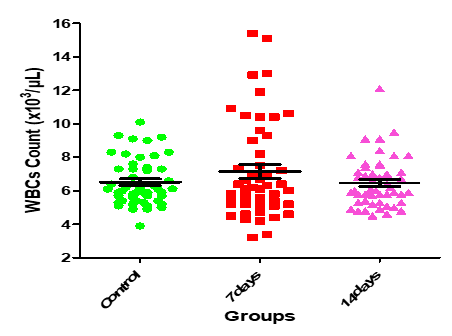
Figure10: Medians (IQR) of WBC count in control group and the patients group during covid-19 virus infection
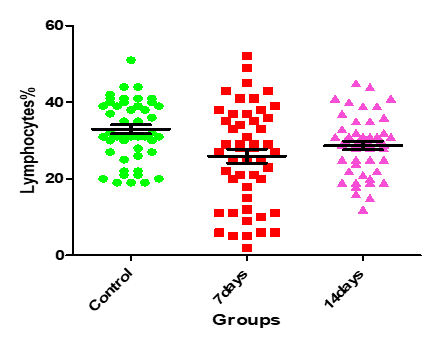
Figure11: Medians (IQR) of Lymphocgtes count in control group and the patients group during COVID-19 virus infection
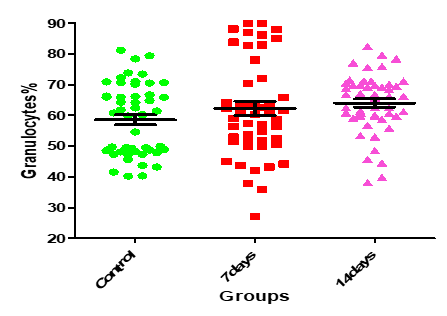
Figure12: Means (std.dev.) of Granulocytes count in control group and the patients group during covid-19 virus infection

Figure 13: Medians (IQR) of PLT count in control group and the patients group during covid-19 virus infection
Table.14 shows that the mean of RBC for the non-vaccinated individuals is 4.255 with std. deviation OF 0.610, while the mean value of RBC after the 1-dose vaccinated individuals is 4.229 with std. deviation 0.515, whereas the mean value of RBC after the 2-dose vaccinated individuals is 4.033 with std. deviation 0.470.
| RBC | N | Mean | Std. Deviation | Std. Error | Minimum | Maximum | |
| Non | 44 | 4.255 | 0.610 | 0.0919 | 2.860 | 5.930 | |
| 1_Dos | 28 | 4.229 | 0.515 | 0.0973 | 3.210 | 5.380 | |
| 2_Dos | 78 | 4.033 | 0.470 | 0.0532 | 2.970 | 5.010 | |
| Total | 150 | 4.135 | 0.530 | 0.0433 | 2.860 | 5.930 |
Table 14: Descriptive of RBC according to vaccination levels
ANOVA test.15 shows that there is no any significant difference between the means of RBC according to vaccination levels as p-value < α, and the vaccination has a weak effect upon RBC since η2=0.04 less than 0.06
| Sum of Squares | df | Mean Square | F | p-value | |
| Between Groups | 1.690 | 2 | 0.845 | 3.095 | 0.048 |
| Within Groups | 40.139 | 147 | 0.273 | ||
| Total | 41.829 | 149 |
Table 15: ANOVA test for the significance of differences between the means of RBC according to the vaccination levels
Table .16 shows that the mean of Granulocyte for the non-vaccinated individuals is 60.90 with std. deviation 13.98, while the mean of Granulocytes for the 1-dose vaccinated individuals is 58.63 with std. deviation 12.50, whereas the mean of GRAN for the 2-dose vaccinated individuals is 63.05 with std. deviation 12.30.
| N | Mean | Std. Deviation | Std. Error | Min | Max | ||
| Non-Vaccinated | 44 | 60.8955 | 13.97762 | 2.10721 | 27.00 | 89.90 | |
| 1_Dos | 28 | 58.6250 | 12.50471 | 2.36317 | 39.80 | 89.90 | |
| 2_Dos | 78 | 63.0535 | 12.29573 | 1.39222 | 40.20 | 94.70 | |
| Total | 150 | 61.5938 | 12.87490 | 1.05123 | 27.00 | 94.70 |
Table 16: Descriptives of Granulocytes according to vaccination levels
From table.17 we can easily observe that for the non-vaccinated individuals the mean of WBC is 6.759 with std. deviation 2.332 and the median is 6.1, for HGB the mean is 12.322 with std. deviation 2.198 and median is 12.95, the PLT mean is 219.55 with std. deviation 57.368 and median is 207.5 and the LYM mean is 20.269 with std. deviation 10.478 and median is 31.5. For the 1-dose vaccinated individuals the WBC mean is 6.096 with std. deviation 1.55 and median is 5.8, the HGB mean is 12.841 with std. deviation 1.117
and median is 12.8, the PLT mean is 243.07 with std. deviation 63.822 and median is 223 and the LYM mean is 32.504 with std. deviation 10.004 and median is 31.6. finally for the 2-dose vaccinated individuals the WBC mean is 7.154 with std. deviation 3.224 and median is 6.2, the HGB mean is 12.65 with std. deviation 1.301 and median is 12.8, the PLT mean is 231.78 with std. deviation 61.072 and median is 211 and the LYM mean is 31.827 with std. deviation 32.572 and median is 28.6.
| Vaccinated | Mean | Std. Deviation | Min | Max | median50% | IQR | |
| WBC | Non | 6.759 | 2.332 | 3.40 | 15.40 | 6.10 | 1.88 |
| 1_Dose | 6.096 | 1.550 | 3.20 | 9.60 | 5.80 | 1.70 | |
| 2_Dose | 7.154 | 3.224 | 4.40 | 29.00 | 6.20 | 2.70 | |
| HGB | Non | 12.322 | 2.198 | 8.10 | 15.90 | 12.95 | 3.57 |
| 1_Dose | 12.841 | 1.117 | 10.20 | 15.10 | 12.80 | 1.60 | |
| 2_Dose | 12.650 | 1.301 | 8.90 | 15.40 | 12.80 | 1.30 | |
| PLT | Non | 219.55 | 57.368 | 91 | 358 | 207.50 | 78 |
| 1_Dose | 243.07 | 63.822 | 132 | 376 | 223.00 | 103 | |
| 2_Dose | 231.78 | 61.072 | 128 | 441 | 211.00 | 74 | |
| LYM | Non | 30.269 | 10.478 | 5.40 | 49.90 | 31.50 | 12.90 |
| 1_Dose | 32.504 | 10.004 | 5.00 | 52.90 | 31.60 | 10.80 | |
| 2_Dose | 31.827 | 32.572 | 2.90 | 304.00 | 28.60 | 15.41 |
Table 17: Descriptives of WBC, HGB, PLT and Lymphocytes according to vaccination levels
Table .18 shows that there are no significant differences in WBC, HGB, PLT and Lymphocytes according to the levels of vaccination and vaccination has a weak effect upon WBC, HGB, PLT and Lymphocytes since ε2 less than 0.04.
| Vaccinated | N | Mean Rank | Kruskal-Wallis H | p-value | |
| WBC | Non-Vaccinated | 44 | 75.22 | 3.494 | 0.174 |
| 1_Dos | 28 | 62.46 | |||
| 2_Dos | 78 | 80.34 | |||
| HGB | Non | 44 | 75.31 | 0.057 | 0.972 |
| 1_Dos | 28 | 77.25 | |||
| 2_Dos | 78 | 74.98 | |||
| PLT | Non | 44 | 69.09 | 2.270 | 0.322 |
| 1_Dos | 28 | 84.89 | |||
| 2_Dos | 78 | 75.74 | |||
| LYM | Non | 44 | 78.61 | 4.459 | 0.108 |
| 1_Dos | 28 | 88.54 | |||
| 2_Dos | 78 | 69.06 |
Table 18: The significance of differences in WBC, HGB, PLT and Lymphocytes according to the levels of vaccination
Table.19 ad figures 14-16 show that the distributions of D-dimer for the two groups are differ in shape by t test Z test since p-values < controls> α, there is no significant difference between the distributions of the groups controls and the patients after 14 days as p-values < α, i.e. there is no significant difference between the controls and the patients after 14 days Ferritin level.
| P value | F | 14 days of inf. | 7days of inf. | Control | Groups Parameters |
| Mean±SE | Mean±SE | Mean±SE | |||
| <0> | 10.10 | 1.221±0.21 | 1.584±0.28 | 0.333±0.04 | Serum D-dimer (µg/ml) |
| <0> | 11.82 | 24.89±6.33 | 57.03±12.05 | 3.31±0.30 | Serum C-Reactive Protein (mg/L) |
| 0.0008 | 7.451 | 203.8±49.28 | 457.8±117.4 | 61.02±7.18 | Serum Ferritin (µg/L) |
Table 19: Serum D-dimer, C- reactive protein (CRP), and Ferritin levels in control and at 7 and 14 days of COVID-19 Virus Infection.
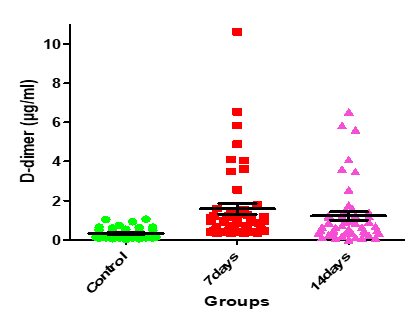
Figure 14: Medians (IQR) of D-dimer count in control group and the patients group during COVID-19 virus infection
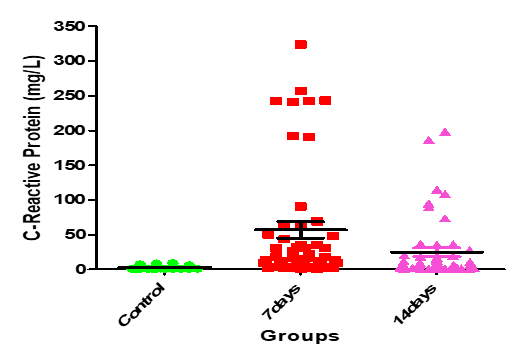
Figure 15: Medians (IQR) of CRP count in control group and the patients group during COVID-19 virus infection
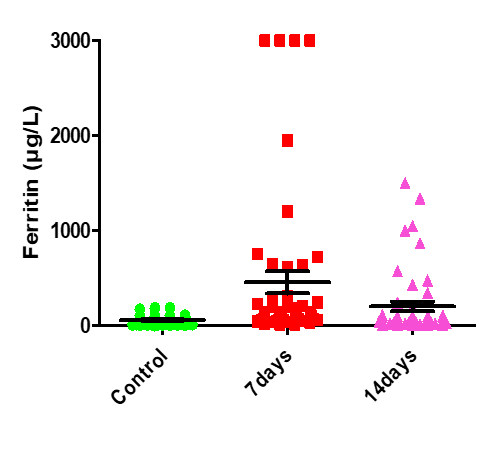
Figure 16: Medians (IQR) of Ferritin count in control group and the patients group during COVID-19 virus infection
Table.20 shows that, for the non-vaccinated individuals the mean of D-dimer is 1.456 with std. deviation 1.698 and the median is 0.638, for CRP the mean is 36.001 with std. deviation 67.75 and median is 5.255, the Ferritin mean is 351.141 with std. deviation 702.675 and median is 93.595. For the 1-dose vaccinated individuals the D-dimer mean is 0.530 with std. deviation 0.333
and median is 0.450, the CRP mean is 13.556 with std. deviation 20.869 and median is 5.020, the Ferritin mean is 102.837 with std. deviation 151.601 and median is 67.335. Finally for the 2-dose vaccinated individuals the D-dimer mean is 1.000 with std. deviation 1.616 and median is 0.591, the CRP mean is 29.460 with std. deviation 63.401 and median is 5.985, the Ferritin mean is 226.616 with std. deviation 518.658 and median is 78.450.
| Parameters | Vaccinated | Mean | Std. Deviation | Min | Max | 50% | IQR | |
| D-dimer | Non-Vaccinated | 1.456 | 1.698 | 0.012 | 6.531 | 0.638 | 1.951 | |
| 1_Dos | 0.530 | 0.333 | 0.021 | 1.212 | 0.450 | 0.379 | ||
| 2_Dos | 1.000 | 1.616 | 0.053 | 10.620 | 0.591 | 0.889 | ||
| CRP | Non-Vaccinated | 36.001 | 67.750 | 0.600 | 243.40 | 5.255 | 26.333 | |
| 1_Dos | 13.556 | 20.869 | 0.840 | 90.700 | 5.020 | 11.942 | ||
| 2_Dos | 29.460 | 63.401 | 0.931 | 323.91 | 5.985 | 16.292 | ||
| Ferritin | Non-Vaccinated | 351.141 | 702.675 | 11.00 | 3000.0 | 93.595 | 167.85 | |
| 1_Dos | 102.837 | 151.601 | 6.99 | 724.00 | 67.335 | 56.54 | ||
| 2_Dos | 226.616 | 518.658 | 3.22 | 3000.0 | 78.450 | 112.11 | ||
Table 20: Descriptive of D-dimer, CRP and Ferritin according to vaccination levels
Table.21 shows that there are no significant differences in D-dimer, CRP and Ferritin according to the levels of vaccination, and vaccination has a weak effect upon D-dimer, CRP and Ferritin since ε2 less than0.04.
| Parameters | Vaccinated | N | Mean Rank | Kruskal-Wallis H | p-value |
| D- Dimer | Non | 44 | 85.28 | 4.017 | .134 |
| 1_Dos | 28 | 64.91 | |||
| 2_Dos | 78 | 73.78 | |||
| CRP | Non | 44 | 76.95 | .450 | .799 |
| 1_Dos | 28 | 70.55 | |||
| 2_Dos | 78 | 76.46 | |||
Ferritin | Non | 44 | 81.63 | 1.826 | .401 |
| 1_Dos | 28 | 67.55 | |||
| 2_Dos | 78 | 74.90 |
Table 21: The significancy of differences in D-dimer, CRP and Ferritin according to the levels of vaccination
Table.22 shows that there are statistically significant strong positive relations between; CRP and D-dimer with correlation coefficient r = 0.796, Ferritin and D-dimer with r = 0.712, CRP and Ferritin with r = 0.703. Furthermore, it shows that there are a statistically significant moderate relations between; RBC and HGB with r = 0.530, WBC and Ferritin with r = 0.515, WBC and
CRP with r = 0.503, WBC and D-dimer with r = 0.451, Granulocytes and CRP with r = 0.521, Granulocytes and D-dimer with r = 0.499, Granulocytes and Ferritin with r = 0.419. Again, there are statistically significant weak positive relations between; Granulocytes and WBC with r = 0.363, IgM and PLT with r = 0.306, IgM and CRP with r = 0.265, PLT and WBC with r = 0.187, Lymphocytes and HGB with r = 0.165. Moreover, there are statistically significant weak negative relations between; HGB and D-dimer with r = -0.435, HGB and Ferritin with r = -0.381, HGB and Granulocytes with r = -0.349, HGB and CRP with r = -0.339, HGB and WBC with r = -0.279, Again between Lymphocytes and Granulocytes with r = -0.411, Lymphocytes and CRP with r = -0.268, Lymphocytes and D-dimer with r = -0.263, Lymphocytes and ferritin with r = -0.233, finally, between RBC and Granulocytes with r = -0.244.
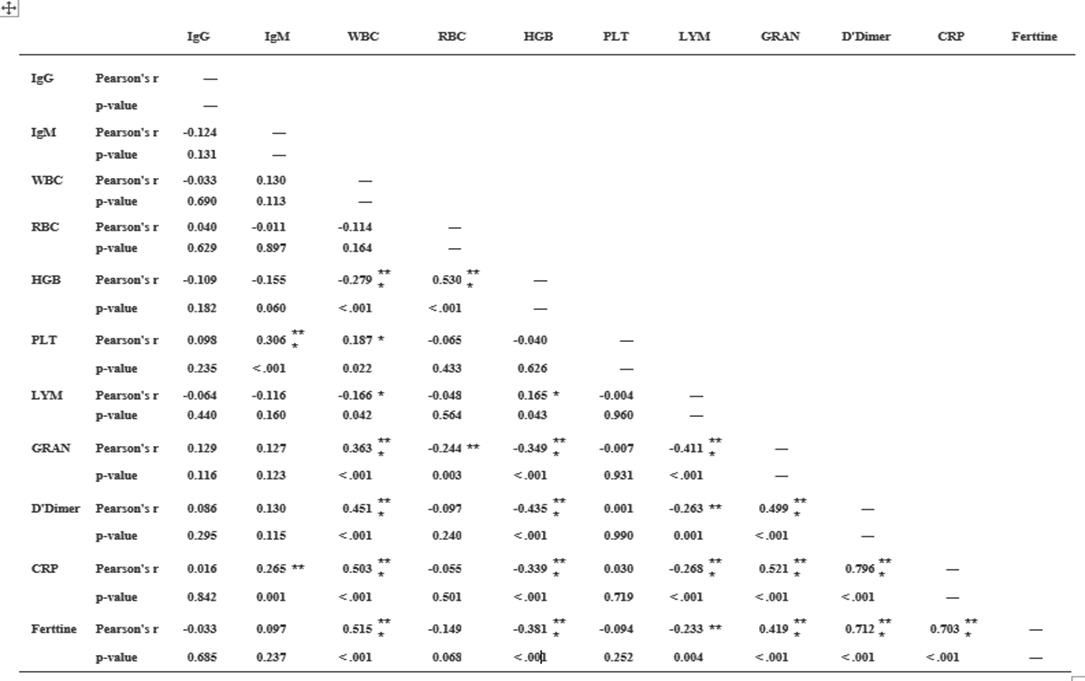
Table.22: Correlation Matrix
The current study showed that there was a statistically significant variation in the hematological parameters of COVID-19 patients between the 1st weeks (infection week) and 2nd week (a peak week). The current study demonstrated that there was decrease in lymphocytes and RBCs count that might be due to inflammatory responses, and these changes expanded as the disease progresses. Lymphocytopenia is frequent in patients with COVID- 19, which indicates a decadence of immunity during COVID-19 infection. It is observed that the decrease of lymphocytes was below the normal range in most infected patients; this concurs with the Gao et al. (19), and Zhou et al. (20) results.
On the other hand, there were no statistically significant (P>0.05) changes observed in the, hemoglobin concentration, WBCs, granulocytes, and platelets counts. Furthermore, Guan et al.(21), study showed low thrombocyte and leukocyte. Another study by Assiri et al., (22) and Xu et al. (23), noted thrombocytopenia in the patients and leukopenia in a different study. In addition, a study reported that thrombocytes decrease significantly in pneumonia patients and this reduction is proportionate with the clinical case of the patient. Several potential reasons have been suggested for thrombocytopenia in coronavirus patients as failure in thrombocyte production from classic cytokine storm in infection or attacking directly on hematopoietic stem cells, high destruction of platelet in circulating blood and decreased peripheral PLT secondary to lung damage (24). In the Chinese population, Duarte et al. (25), and Tan et al. (26), studies have reported the presence of leucopenia on hospital admission, basically at the expense of moderate to severe lymphopenia and mild thrombocytopenia, as well as a
decrease in hemoglobin, absolute monocyte counts and even tend to develop neutrophilia during hospitalization, with a peak in this period of ICU stay. Analysis of the baseline CBC parameters of the study population showed that 4 cases (12.9%) showed neutrophilia, 3(9.6%) cases showed lymphopenia, and 5 cases (16.1%) showed monocytosis. However, the baseline total leucocyte count was not increased (27). In contrast to the other studies conducted in China, whereby 63% of cases showed lymphopenia and 42
It can be concluded that coronavirus infection caused a significant decrease in lymphocytes, and RBCs count However, there were no statistically significant (P>0.05) changes observed in the, hemoglobin concentration, WBCs, granulocytes, and platelets counts in comparison to the healthy individuals. Also, COVID-19 caused a significant increase in IgM, IgG, D-dimer, CRP, and Ferritin levels at different periods compared to the controls. Further studies are needed to confirm these results. COVID-19 Specific Immunoglobulin's and Some hematological variables and Inflammatory factors in COVID-19 Patients These changes in IgM, IgG, D-dimer, CRP, and Ferritin levels during COVID-19 Virus Infection among COVID-19 patients may help the clinicians to better understand the COVID-19 and provide more clinical treatment options.
1 -Ministry of Health should develop an infectious disease preparedness and response plan that can help guide protective actions against COVID-19.
2 - Vaccination programs should be implemented including targeted to all people especially individuals with chronic diseases and pregnancy women, through all media and channels for spreading the needed Information.
3 – More studies should be conducted in order to have knowledge about the behavior of the new virus (COVID-19).
Dear Editorial Team, Clinical Medical Reviews and Reports. My experience with the journal was highly positive. The peer-review process was rigorous, constructive, and completed in a timely manner. The reviewers provided valuable comments that helped improve the quality and clarity of our manuscript. The editorial office was professional, responsive, and supportive throughout all stages of the publication process. Communication was clear and efficient, and any questions were addressed promptly. Overall, I found the journal to maintain high scientific standards and an excellent publication workflow. I would be pleased to consider submitting future work to this journal. Best wishes from, Elena Popa.

It was my pleasure to submit my testimonial concerning the Reviewer Board of our Scientific Journal “Brain and Neurological Disorders”. The Reviewers focused on some modifications and their contribution was helpful. The ladies of our Editorial Office were also supported my efforts. It was my honor to have such a co-operation and I am looking forward for more collaboration.

Dear Grace Pierce, Editorial Coordinator of Journal of Clinical Research and Reports, Thank you for the speedy and efficient peer review process. I appreciate the fact that your peer reviewers do not take months to respond like with some other journals. I would also like to thank the editorial office for responding quickly to my questions. It is an excellent journal. I plan to submit more manuscripts in the future. Best wishes from, Robert W. McGee

Dear Grace Pierce, Editorial Coordinator of Journal of Clinical Research and Reports, Working with you and your team on our recent publication in JCRR has been a truly wonderful and enjoyable experience. The responses were prompt, and the reviewers were patient, constructive, and highly professional. One reviewer in particular gave me the feeling that a professor was carefully reading and commenting on my coursework, which was deeply touching. The entire process was straightforward and hassle‑free, with no tedious online forms to complete. I highly recommend this journal. Best wishes from, DR Aibing Rao, Head of R&D

I Appreciate the Opportunity to Share my Experience with the Journal of Clinical Research and Reports. The peer review process was timely and constructive, and the feedback provided helped improve the quality of our manuscript. The editorial office was professional, responsive, and supportive throughout the process, ensuring smooth communication and efficient handling of the submission. Overall, it was a positive experience collaborating with your team.

Dear Mercy Grace, Editorial Coordinator of Obstetrics Gynecology and Reproductive Sciences, We would like to express our gratitude for your help at all stages of publishing and editing the article. The editors of the magazine answer all the necessary questions and help at every stage. We will definitely continue to cooperate and publish other works in the Obstetrics Gynecology and Reproductive Sciences! Best wishes from, Alla Konstantinovna Politova,
