
Research Article | DOI: https://doi.org/10.31579/2639-4162/238
Jose Luis Turabian, Health Center Santa Maria de Benquerencia. Regional Health Service of Castilla la Mancha (SESCAM), Toledo, Spain.
*Corresponding Author: Jose Luis Turabian, Health Center Santa Maria de Benquerencia. Regional Health Service of Castilla la Mancha (SESCAM), Toledo, Spain.
Citation: Jose L. Turabian, (2024), Covid-19 Time Series from October 2022 to October 2024. Sars-cov-2 Is Not seasonal, but covid-19 Shows Seasonal Patterns of Social and Immune Origin, J. General Medicine and Clinical Practice, 7(19); DOI:10.31579/2639-4162/238
Copyright: © 2024, Jose Luis Turabian. This is an open-access article distributed under the terms of the Creative Commons Attribution License, which permits unrestricted use, distribution, and reproduction in any medium, provided the original author and source are credited.
Received: 02 November 2024 | Accepted: 05 November 2024 | Published: 07 November 2024
Keywords: covid-19; sars-cov-2; seasonal variation; time factors; epidemiology
Background: The seasonal variations in the community of covid-19 cases in the current endemic situation are unknown.
Objective: To study of seasonal variations (those occurring regularly at certain times of the year) of covid-19 cases
Methodology: An observational, longitudinal and prospective study of covid-19 time series of cases from October 1, 2022 to October 1, 2024, in a general medicine office in Toledo, Spain.
Results: 76 cases of covid-19 were included from October 2022 to September 2023, and 54 from October 2023 to October 2024. Three waves with no seasonal pattern were observed: in autumn 2022 (statistically significant vs. autumn cases) 2023), in summer 2023 (not significant compared to summer 2024, which also had a relatively high number of cases), and in spring 2024 (statistically significant vs. cases in spring 2023).
Conclusion: In a general practice setting in Toledo, Spain, the monitoring of covid-19 cases from autumn 2022 to summer 2024 shows variations over time with waves followed by valleys, of irregular distribution in the series, not constituting a seasonal pattern that is repeated every year, except a high number of cases during the summers. However, one must be cautious when extrapolating general rules due to the occurrence of few events and the short observation time frame.
In epidemiology, the study of variations in morbidity includes the study of seasonal variations (those occurring regularly at certain times of the year). Knowledge of these variations can be related to their associated causes or factors, such as natural life cycle of the infectious agent, changes in the opportunity for exposure, human activities, variations in habits, such as diet, other environmental factors as climate and atmospheric phenomena, Influence of sunlight, cold or heat, humidity, barometric pressure, exercise or physical inactivity in winter versus summer, the environmental pollution, variations in neuroendocrine and metabolic function, seasonal movements of the population, etc. This knowledge of the seasonal evolution of the morbidity allows to control or to manage its frequency, and to establish predictions and interventions [1-10].
For most illnesses, in many health systems, the general practitioner (GP) is the first point of contact. So, GP is a best source of information on health problems and their variation, incliding seasonal variations of diseases [11, 12].
It has been postulated that severe acute respiratory syndrome coronavirus 2 (SARS-CoV-2) in its post-pandemic evolution could become seasonal in winter, following a circulation pattern observed among other pre-existing seasonal human coronaviruses and resembling that of other respiratory infections, such as influenza. In this scenario, immune-evading mutations in circulating variants could combine with drops in population-wide immunity to become key drivers of periodic waves of infection [13-15].
There is no exact technical definition of what an epidemic wave is or is not. It is a construction in time whose outline is drawn after the worst has passed. A wave implies an increase in the number of sick individuals, a defined peak and a decline. Waves can be thought of as peaks and valleys, but there is no fixed definition of wave in terms of infectious disease [16].
At present, the fate of the coronavirus disease 2019 (covid-19) remains unclear; Understanding the potential seasonal profiles of infection risks will be critical to inform effective surveillance and control strategies [17].
In this context, a longitudinal study is presented with the aim of describing the seasonal variations of covid-19 over two years, from October 1, 2022 to October 1, 2024 in a general medicine clinic in Toledo, Spain.
Design and emplacement
An observational, longitudinal and prospective study of covid-19 time series of cases was conducted from October 1, 2022 to October 1, 2024, in a general medicine office in the Santa Maria de Benquerencia Health Center, Toledo, Spain, which has a list of 2,000 patients > 14 years of age (in Spain, the GP care for people > 14 years of age, except for exceptions requested by the child's family and accepted by the GP).
Outcome of interest
To describe the seasonal variations of covid-19 over two years, from October 1, 2022 to October 1, 2024 in a general medicine clinic in Toledo, Spain.
Diagnosis of covid-19
The diagnosis was performed with reverse transcriptase polymerase chain reaction oropharyngeal swab tests or antigen testing (18) performed in health services or at home.
Collected variable
Date of covid-19 infection diagnosis.
Covid-19 vaccination and reinfections in the study cases
The vaccination schedule and reinfections were not included in this study (both variables can modify the incidence of cases). On the final data collection date, the included patients could have received 1, 2 doses of vaccine, first booster for fall-winter 2021, fourth dose (second booster) for fall-winter 2022 (19) and fifth dose (third booster) for fall-winter 2023. In our study, only Pizfer / BioNTech, Spikevax (mRNA-1273- Moderna), Vaxzevria, Oxford / AstraZeneca and Janssen (Johnson & Johnson) vaccines were used for the first and second doses. For the first booster, only messenger RNA (mRNA) was used. And only Moderna and Pfizer-BioNTech's bivalent covid-19 vaccines were used for the second booster. Las vacunas adaptadas a ómicron XBB.1.5 Pizfer / BioNTech y Spikevax (Moderna) were used for the third booster in autumn-winter 2023.
Epidemiological and statistical analysis (19)
1. A descriptive analysis of the time series was performed to determine the characteristics of the series. To do this, the series was visualized through a time graph, with the observations on the vertical axis and the time variable on the horizontal axis. This graph is used to try to understand the behavior of the cases and if there is any type of periodicity (patterns and trends in the time series)
2. To test whether or not the time series was stationary (regular patterns that repeat over time; a series is stationary when it is stable over time) bivariate comparisons between seasons (fall 2022 vs. 2023, winter 2022 vs. 2023; spring 2023 vs. 2024, and summer 2023 vs. 2024) were performed using the Chi Square test (X2).
3. Likewise, an explanatory analysis proposing plausible hypotheses was performed trying to explain the reasons that give rise to the behavior observed in the series, based on the graph of data over time.
Ethical issues
No personal data of the patients were used, but only group results, which were taken from the clinical history.
76 cases of covid-19 were included from October 2022 to September 2023, and 54 cases of covid-19 from October 2023 to October 2024. In 2022-2023, two waves were observed: in autumn 2022, and another in summer 2023. In 2023-2024, a single wave was observed in spring 2024. Cases during autumn 2022 were statistically significantly more numerous vs. cases in autumn 2023 [X2= 4.7812. p= .028772]. Likewise, cases during spring 2024 were statistically significantly more numerous vs. cases in spring 2023 [X2= 21.3257. p= < 0>Seasonal Distribution Of Covid-19 Cases
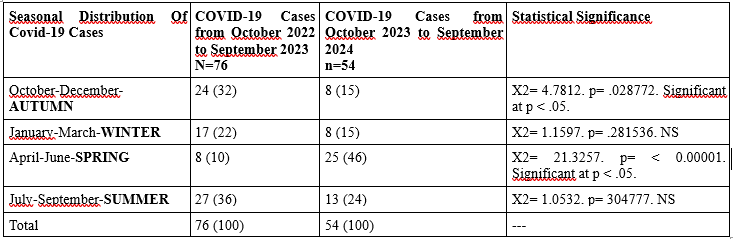
(): Denotes percentages; NS: Not significan
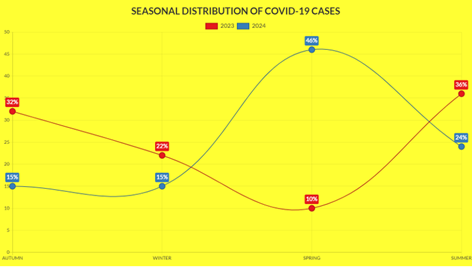
Figure 1
< src>
Figure 2
1. Main findings
In our study, covid-19 cases showed successive peaks and valleys in an irregular manner over time. We found three waves with no seasonal pattern: in autumn 2022 (statistically significant vs. autumn cases) 2023), in summer 2023 (not significant compared to summer 2024, which also had a relatively high number of cases), and in spring 2024 (statistically significant vs. cases in spring 2023). It can be said that in our time series seasonal variations are observed, but they do not seem to constitute a pattern that is repeated every year, except that there seems to be a high number of cases during the summers (and low in winters).
The only stability or repeated pattern of the series over time was that the number of covid-19 cases was relatively high in the summers (and low in winters). In view of these results, it could be hypothesized that the successive waves, which do not follow a seasonal pattern, may be due to changes in the variants of the virus, and the valleys that follow these waves to the effects of natural immunity against reinfection; and the repeated pattern of a relatively high number of cases in the summers may be due due to changes in behaviour and movements during these dates, and to the fact that the effectiveness of the booster shots given at the end of autumn is already waning six months after the injection.
In any case, the results must be evaluated with caution, since April 28, 2022 there was a new "Surveillance and Control Strategy Against Covid-19" that included the non-performance of diagnostic tests, which were focused only on those over 60 years of age [20]. This means that positive cases have been counted with tests carried out in health services and with tests carried out at home and later reported to the GP. Thus, there is probably an underreporting. In addition, it is possible that many of the current infections are occurring with few symptoms or are confusing them with those of other mild conditions [21].
On the other hand, the evolution of the predominant SARS-CoV-2 variants in the context of the study must be taken into account. The omicron variant was the dominant one in Spain November, 2022 [22]. In Spain, the replacement of BA.2 by BA.5 occurred in mid-June 2022. From that moment on, a period of great diversification of the BA.2, BA.4 and BA.5 or recombinant lineages began. The XBB.1.5 lineage became the dominant one globally in February 2023 and in March in Spain [23]. The “Eris” variant (EG.5), a descendant of the omicron, also of the XBB family, spread rapidly since the end of July 2023 throughout the United States, Europe (including Spain) and Asia [21, 23-26].
In November 2023, several recombinant variants were circulating in Spain, particularly XBB arising from two Omicron BA.2 sub lineages [27]. In January 2024 in Spain, XBB.1.5-like + F456L accounted for 42% and BA.2.86 for 44% of positive cases [28]. In July and August 2024, the KP.3 lineage was detected in 84% of cases [29]. In September 2024, the incidence of the XEC variant was increasing markedly in Spain, where it accounted for around 1% of total cases. At that time, it was the second most common strain in cases recorded in September, although still far behind the main KP.3.3, with an incidence of 13% [30, 31]. In the summer of 2024, a new group of closely related covid-19 subvariants emerged, collectively known as “FliRT” and members of the group include KP.2, KP.3, and JN.1.7.1 (32).
If covid-19 becomes endemic, it will be present at a certain level in a population at certain times of the year or throughout the year. A disease that is not eradicated is, by definition, endemic. This does not necessarily mean that it is circulating at low levels [33-35)].A season is a certain period of time and one of the ways in which a year can be divided, with a duration longer than the month, characterized by the typical behavior of some meteorological variable (temperature, precipitation, winds, etc.) [36]. In our study, each year was considered in four parts or seasons.
It is unclear what trajectory SARS-CoV-2 transmission will follow after the initial pandemic wave. One speculation is that SARS-CoV-2 will adapt to a seasonal circulation like influenza virus, and other human coronaviruses [14]. It has been suggested that in the future covid-19 may become a winter disease (15). SARS-CoV-2 has been said to be likely to be more transmissible in winter and to cause greater outbreaks in that season [15, 37, 38]. But, environmental factors such as humidity and temperature do not seem to affect SARS-CoV-2 as much as other viruses, which flourish more in the dry, cold winter months. SARS-CoV-2 can occur in warm, humid places [39].
Thus, an increase in cases has been reported in the summer of 2023 and 2024 in the USA, UK and Spain, among other places [40-45]. Another factor to take into account is that in summer there is no activity by the influenza virus, nor respiratory syncytial virus, so covid-19 has all the ground to be able to cause infections without competition. In addition, summer, being a season of much socialisation and gathering of people, facilitates the spread of this virus [46, 47].
Our results are in line with the fact that the variations in the number of covid-19 cases in this endemic period do not follow a pattern of climatic seasons of the year, having found a wave in autumn and early winter, but also in summer and spring, in the course of the time series.
Covid-19 has not shown clear seasonal patterns since the pandemic began. Since 2021, there have been peaks in summer, but they have also been frequent in the autumn-winter season and there have also been spikes in spring. As it is a relatively new virus that is being fought with massively injected vaccines, it does not have cycles as clear as others, such as influenza [44, 48].
Pretending that incidence rates remain stable throughout the year is impossible, there are factors that cause them to increase: drops in immunity, either due to the time since the last vaccine or infection, combined with social habits; the increase in social interactions, such as at Christmas and spring-summer. And logically, the variants that are more transmissible than the previous ones will prevail. Thus, looking at the incidence curve, one will see valleys and peaks. That pattern will probably continue [16, 49].
Analysis of time series of daily new cases of covid-19 through 2021 revealed both long-term (waves) and short-term (cycles) variations. Determining the cause and mechanism of their cycles is difficult to discern, but this cyclical character probably provides an innate herd defense (50). In our study, this succession of peaks and valleys is observed, non-seasonally throughout the series.
In reality, it is too early to say whether SARS-CoV-2 will become a seasonal virus. To assess whether infections from a particular virus rise and fall with the seasons, researchers typically study its spread in a specific location, several times a year, for many years. Evaluation may be needed for at least five years through natural infection, or less if people are vaccinated. Whether and what a seasonal pattern emerges will depend on many factors that have not yet been understood, including how long immunity lasts, how long recovery takes, and how likely it is that people can be reinfected [37, 50, 51].
In summary, in the current endemic phase the virus has not stabilized in a predictable pattern. The patterns of emergence of covid-19 variants are largely unknown and covid-19 does not simply follow seasonal patterns [52, 53]. Whether and how a seasonal pattern emerges will depend on many factors that are not yet understood [37, 38]. The seasonality of diseases is a poorly understood phenomenon, and the interaction between human immunity and the evolution of SARS-CoV-2 remains highly dynamic. In this scenario, some experts think that in the United States and Europe a bi-seasonal pattern is emerging: covid-19 cases are now concentrated in the winter and summer waves [54]. But over a certain period of time new variants will appear that could then become seasonal. And it is not known whether this will happen in 10 or 100 years [54].
1. The small number of covid-19 cases may make analysis difficult.
2. There may be underreporting of infections.
3. Our results may not directly apply to other covid-19 vaccine platforms.
4. The 2-year time period studied may be insufficient to see trends and patterns.
In the general practice setting in Toledo, Spain, the monitoring of covid-19 cases from autumn 2022 to summer 2024 shows irregular variations in the time series, with waves followed by troughs, but they do not constitute a seasonal pattern that repeats every year, except that there is a high number of cases during the summers (and low in winters). In view of these results, it could be hypothesized that the successive waves, which do not follow a seasonal pattern, may be due to changes in the virus variants, and the troughs that follow these waves to the effects of natural immunity against reinfection; and the repeated pattern of a relatively high number of cases in the summers may be due to social factors due to changes in behavior and movement at those times, and to the fact that the effectiveness of the vaccine boosters given at the end of autumn is already waning six months after the injection. In summary, covid-19 cases show variations in the time series studied, but no repeated annual seasonal pattern linked to meteorological changes is observed. However, one should be cautious when extrapolating general rules due to the occurrence of few events and the short observation time frame. In any case, the GP may be a major source of information on covid-19 seasonal variation in endemic time.
Dear Editorial Team, Clinical Medical Reviews and Reports. My experience with the journal was highly positive. The peer-review process was rigorous, constructive, and completed in a timely manner. The reviewers provided valuable comments that helped improve the quality and clarity of our manuscript. The editorial office was professional, responsive, and supportive throughout all stages of the publication process. Communication was clear and efficient, and any questions were addressed promptly. Overall, I found the journal to maintain high scientific standards and an excellent publication workflow. I would be pleased to consider submitting future work to this journal. Best wishes from, Elena Popa.

It was my pleasure to submit my testimonial concerning the Reviewer Board of our Scientific Journal “Brain and Neurological Disorders”. The Reviewers focused on some modifications and their contribution was helpful. The ladies of our Editorial Office were also supported my efforts. It was my honor to have such a co-operation and I am looking forward for more collaboration.

Dear Grace Pierce, Editorial Coordinator of Journal of Clinical Research and Reports, Thank you for the speedy and efficient peer review process. I appreciate the fact that your peer reviewers do not take months to respond like with some other journals. I would also like to thank the editorial office for responding quickly to my questions. It is an excellent journal. I plan to submit more manuscripts in the future. Best wishes from, Robert W. McGee

Dear Grace Pierce, Editorial Coordinator of Journal of Clinical Research and Reports, Working with you and your team on our recent publication in JCRR has been a truly wonderful and enjoyable experience. The responses were prompt, and the reviewers were patient, constructive, and highly professional. One reviewer in particular gave me the feeling that a professor was carefully reading and commenting on my coursework, which was deeply touching. The entire process was straightforward and hassle‑free, with no tedious online forms to complete. I highly recommend this journal. Best wishes from, DR Aibing Rao, Head of R&D

I Appreciate the Opportunity to Share my Experience with the Journal of Clinical Research and Reports. The peer review process was timely and constructive, and the feedback provided helped improve the quality of our manuscript. The editorial office was professional, responsive, and supportive throughout the process, ensuring smooth communication and efficient handling of the submission. Overall, it was a positive experience collaborating with your team.

Dear Mercy Grace, Editorial Coordinator of Obstetrics Gynecology and Reproductive Sciences, We would like to express our gratitude for your help at all stages of publishing and editing the article. The editors of the magazine answer all the necessary questions and help at every stage. We will definitely continue to cooperate and publish other works in the Obstetrics Gynecology and Reproductive Sciences! Best wishes from, Alla Konstantinovna Politova,
