
Research Article | DOI: https://doi.org/10.31579/2639-4162/172
Specialist in Family and Community Medicine Health Center Santa Maria de Benquerencia. Regional Health Service of Castilla la Mancha (SESCAM), Toledo, Spain.
*Corresponding Author: Specialist in Family and Community Medicine Health Center Santa Maria de Benquerencia. Regional Health Service of Castilla la Mancha (SESCAM), Toledo, Spain.
Citation: Jose Luis Turabian, (2024), Covid-19 Infections with Positive Test at Home Versus in Health Services, In the Period from October 2022 to October 2023, In the General Medicine Office, In Toledo (Spain), J. General Medicine and Clinical Practice, 7(8); DOI:10.31579/2639-4162/172
Copyright: © 2024, Jose Luis Turabian. This is an open-access article distributed under the terms of the Creative Commons Attribution License, which permits unrestricted use, distribution, and reproduction in any medium, provided the original author and source are credited.
Received: 05 April 2024 | Accepted: 18 April 2024 | Published: 26 April 2024
Keywords: covid-19; sars-cov-2; covid-19 testing; covid-19 self-testing; point of care testing; epidemiology; general practice
Background: Since the disappearance of the health alarm in many countries covid-19 tests are carried out in health services only in certain situations, so people with symptoms in the community frequently choose to be tested at home.
Objective: To compare the cases of covid-19 with a positive test carried out in health services with at home and subsequently communicated to the General Practitioner.
Methodology: An observational, longitudinal and prospective case series study of adult patients with covid-19 infections in general medicine from October 1, 2022 to October 1, 2023
Results :76 cases of covid-19 were included: 18 cases of covid-19 with a test 19 performed in health services, and 58 cases of covid-19 with a test performed at home. The cases with testing at home versus the cases with testing in health services were younger, with more female, were milder and had less risk; There were no significant differences in symptoms or chronic diseases. They only differed significantly in that there were fewer health care workers, and in that they were vaccinated with 3 doses in a higher percentage. Cases with home testing were more frequent throughout the year, except in the summer of 2023 during the largest wave of cases.
Conclusion: In the general practice setting in Toledo, Spain, from October 1, 2022 to October 1, 2023, covid-19 cases were diagnosed 3 times more with tests at home than in health services. If the official statistics only collect tests in health services, these data should be multiplied by 3 to get closer to the real number of cases.
The evolution towards an endemic phase of coronavirus disease 2019 (covid-19) is usually described as "favourable." Many people are becoming comfortable living alongside covid-19, even though the average number of daily deaths is still two to four times the long-term average for influenza, and higher on a seasonally adjusted basis [1-3]. But it is difficult to estimate the true magnitude of the current situation and to understand what the transition from the severe acute respiratory syndrome coronavirus (SARS-CoV-2) to an endemic virus will look like. Many countries are now transitioning to strategies to manage covid-19 as an endemic disease (when it exists at a predictable level that does not require special socio-sanitary interventions) [4]. Unfortunately, in the current phase, many of the community surveillance studies that track infection levels have ended. In many countries, such as Spain [5], they no longer publish their covid-19 case counts, it is not clear how many people are infected, nor can the evolution of new waves be evaluated. Thus, it is not known exactly how many real infections there are now. And the virus circulates confused between allergies and other mild viruses. In this scenario, in many places, there could be an "under-reporting" of cases [6]. Additionally, covid-19 testing has increasingly shifted toward an at-home model. So it is difficult to estimate the true magnitude of the current situation [4]. In this “dark” situation, it is problematic to predict how covid-19 will develop in the coming months [4]. However, having a good surveillance system to monitor and track emerging variants of the virus is very important, as cycles of infection will continue to occur [7]. In this context, a possible set of alternative indicators, in addition to the number of hospitalizations, have been suggested to provide early warning of future waves: 1) SARS-CoV-2 levels in wastewater; 2] consumer purchases of home tests [4]; 3) the frequency of visits to the general practitioner (GP) for upper respiratory tract infection and/or to report a positive covid-19 test at home [8]; 4] the estimation of the community risk, which at any time is a function of the immunity of its members (although the level of immunity of each individual cannot be measured in real time, estimates of the level of risk in the community can be based on what is known about vaccination rates and previous infections) [9, 10]. In this scenario, where official figures probably imply significant under-reporting and the incidence of covid-19 and its evolution over time in the community is truly unknown, frequently people with a positive test at home do communicate this circumstance to their general practitioner, to seek treatment and/or sick leave. In this way, knowing the incidence of covid-19 cases with a positive test at home that is reported to the GP, allows the official under-reporting to be corrected (although it will still represent a minimal incidence, since could have sick people who do not take a test at home and who, even if they are positive at home, they do not report it to the GP) [11]. We present a longitudinal and prospective study of covid-19 re-infections was conducted from October 1, 2022 to October 1, 2023 in a general medicine office, with the objective of comparing a set of selected clinical-epidemiological variables of covid-19 cases with a positive test carried out in health services with the covid-19 cases with a positive test at home and subsequently communicated to the GP.
An observational, longitudinal and prospective study of covid-19 re-infections was conducted from October 1, 2020 to October 1, 2023 in a general medicine office in the Santa Maria de Benquerencia Health Center, Toledo, Spain, which has a list of 2,000 patients > 14 years of age (in Spain, GPs care for people > 14 years of age, except for exceptions requested by the child's family and accepted by the GP).
Outcome of interest
To compare the cases of covid-19 with a positive test carried out in health services with cases of covid-19 with a positive test at home and subsequently communicated to the GP
Collected variables
The following variables were collected:
-Age and sex
-Chronic diseases (defined as "any alteration or deviation from normal that has one or more of the following characteristics: is permanent, leaves residual impairment, is caused by a non-reversible pathological alteration, requires special training of the patient for rehabilitation, and / or can be expected to require a long period of control, observation or treatment” [12], classified according to the International Statistical Classification of Diseases and Health-Related Problems, CD-10 Version: 2019 [13]
-If they were Health Care Workers
-Social-occupancy class (according to the Registrar General's classification of occupations and social status code) [14, 15]
-Problems in the family context and low-income household based on the genogram and in the experience of the GP for their continuity of care and knowledge of the family (genogram is a schematic model of the structure and processes of a family, which included the family structure, life cycle and family relational patterns. It was understood that "complex" genograms present families with psychosocial problems) [16, 17]
-Ethnic minority (defined as a “human group with cultural, linguistic, racial values and geographical origin, numerically inferior compared to the majority group”) [18]
-Disease severity (classified according to: 1. mild cases: clinical symptoms are mild and no manifestation of pneumonia can be found on images; 2. moderate cases: with symptoms such as fever and respiratory tract symptoms and the manifestation of pneumonia can be seen on the imaging tests; and 3. severe cases: respiratory distress, respiratory rate ≥ 30 breaths / min., pulse oxygen saturation ≤ 93% with room air at rest, arterial partial pressure of oxygen / oxygen concentration ≤ 300 mmHg.) [19]; to simplify comparison, moderate and severe cases were counted together;
-Date of covid-19 infection diagnosis
-Presence of re-infection (defined as a documented infection occurring at least 90 days after a previous infection) [20-22]
-Vaccination status against covid-19 at the date of acute infection: vaccinated with 2 doses of vaccine [23], vaccinated with first booster [24], vaccinated with fourth dose (second booster) for fall-winter 2022 [25]
Diagnosis of covid-19
The diagnosis was performed with reverse transcriptase polymerase chain reaction (PCR) oropharyngeal swab tests or antigen testing [26]
Sample size
All patients who met the criteria for covid-19 infection from October 1, 2022 to October 1, 2023 and who were treated in the general medicine consultation object of the study, were included.
Statistical analysis
The bivariate comparisons were performed using the Chi Square test (X2) with Yates correction or Fisher Exact Test, when necessary, (according to the number the expected cell totals) for percentages, and the student test for the mean.
Ethical issues
No personal data of the patients were used, but only group results, which were taken from the clinical history.
76 cases of covid-19 were included: 18 cases of covid-19 with a test performed in Health Services, and 58 cases of covid-19 with a test performed at home. This means that a proportion of 3 tests at home for every test in health services were found. The cases with testing at home versus the cases with testing in health services only differed significantly in that there were fewer socio-health care workers [X2 with Yates correction= 10.0348. p= .001536. Significant at p < .05], and in that a higher percentage were vaccinated with 3 doses [X2= 4.588. p= .032196. Significant at p < .05]. The Covid-19 cases with testing at home versus testing in health services were younger, there were more women, they had a lower level of labour specialization, they had milder severity, fewer chronic diseases, and fewer problems in the family context, but with less vaccinated with 4 doses, and had fewer re-infections; but none of these comparisons were statistically significant (TABLE1).
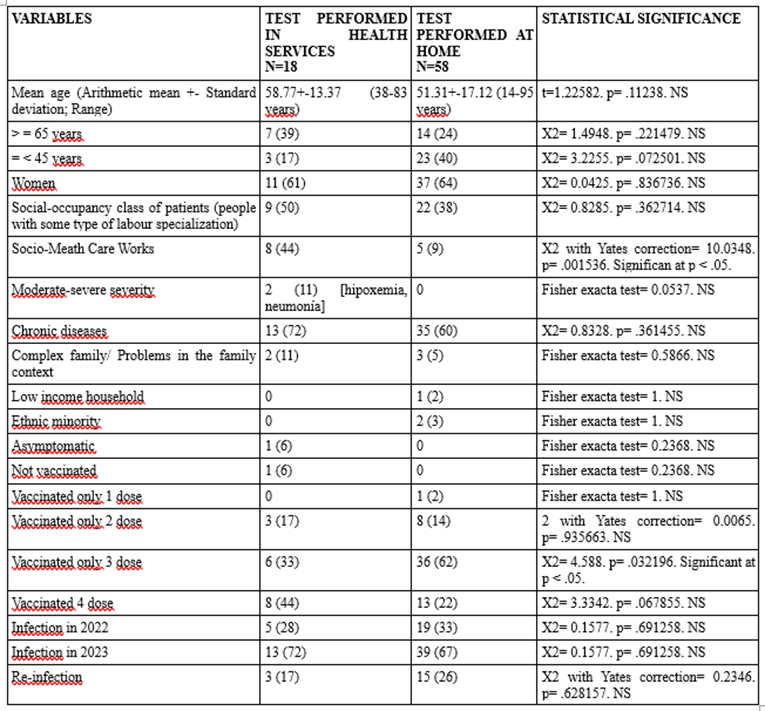
Table 1- (): Denotes percentages; NS: Not significant
Comparison Of Variables Between Covid-19 Infections with Test Performed in Health Services and Test Performed at Home in The Period from October 2022 to October 2023
According to the seasonal distribution, cases with home testing were more frequent in autumn, winter and spring, but statistically significantly less frequent in summer 2023, where the main wave of cases occurred [X2= 4,131. p= .042105. Significant at p < .05] (TABLE 2).
| SEASONAL DISTRIBUTION OF COVID-19 CASES | TEST PERFORMED IN HEALTH SERVICES N=18 | TEST PERFORMED AT HOME N=58 | STATISTICAL SIGNIFICANCE |
| October 2022-December 2023-AUTUMN | 5 (28) | 19 (33) | X2= 0.1577. p= .691258. NS |
| January 2023-March 2023-WINTER | 2 (11) | 15 (26) | X2 with Yates correction= 0.9766. p= .323033. NS |
| April 2023-June 2023-SPRING | 1 (5) | 7 (12) | Fisher exact test= 0.6716. NS |
| July 2023-September 2023-SUMMER | 10 (56) | 17 (29) | X2= 4.131. p= .042105. Significant at p < .05. |
| Total | 18 (100) | 58 (100) | --- |
Table 2- (): Denotes percentages
Comparison Of Covid-19 Infections with Test Performed in Health Services and Test Performed at Home According to Seasons of The Year from October 2022 to October 2023
There were no significant differences in symptoms or chronic diseases between covid-19 infections with covid-19 test performed in health services and covid-19 test performed at home (TABLE 3, TABLE 4).
SYMPTOMS COVID-19 INFECTION* ACCORDING TO WHO, ICD-10 GROUPS
| TEST PERFORMED IN HEALTH SERVICES N=18 | TEST PERFORMED AT HOME N=58 | STATISTICAL SIGNIFICANCE |
| General (discomfort, asthenia, myalgia, fever, artralgias) | 24 (40) | 71 (37) | X2= 0.1551. p= .693669. NS |
| Respiratory (cough, dyspnea, chest pain) | 19 (32) | 50 (26) | X2= 0.69. p= .406153. NS |
| ENT (anosmia / ageusia, odynophagia, aphonia, rhinorrhea, pharyngeal dryness-mucus, ear pain) | 11 (18) | 53 (28) | X2= 2.1306. p= .14438. NS |
| Digestive (anorexia, nausea / vomiting, diarrhea, abdominal pain) | 0 | 6 (3) | Fisher exact test= 1. NS |
| Neurological (headache, dizziness, photopsia, dysarthria, syncope) | 5 (8)
| 9 (5) | X2= 0.5532. p= .456999. NS |
| Psychiatric (anxiety, insomnia) | 0 | 1 (0.5) | Fisher exact test= 1. NS |
| Skin (chilblains, flictenas, rash) | 0 | 0 | Fisher exact test= 1. NS |
| Urological ( dysuria, frequency) | 1 (2) | 1 (0.5) | Fisher exact test= 0.4217. NS |
| Total symptoms* | 60 (100) | 191 (100) | --- |
Table-3: Denotes percentages; NS: Not significant; * Patients could have more than one symptom. The percentages are over the total of symptoms
Comparison Of Symptoms Between Covid-19 Infections with Test Performed in Health Services and Test Performed At Home In the Period from October 2022 to October 2023
CHRONIC DISEASES* ACCORDING TO WHO, ICD-10 GROUPS | TEST PERFORMED IN HEALTH SERVICES N=18 | TEST PERFORMED AT HOME N=58 | STATISTICAL SIGNIFICANCE |
| -I Infectious | 0 | 1 (1) [VIH] | Fisher exact test= 1. NS |
| -II Neoplasms | 1 (2) | 3 (3) | Fisher exact test= 1. NS |
| -III Diseases of the blood | 1 (2) | 2 (3) | Fisher exact test= 1. NS |
| -IV Endocrine | 9 (21) | 19 (16) | X2= 0.5055. p= .477103. NS |
| -V Mental | 4 (10) | 11 (9) | X2 with Yates correction= 0.0893. p= .765057. NS |
| -VI-VIII Nervous and Senses | 2 (5) | 11 (9) | X2 with Yates correction= 0.4091. p= .52241. NS |
| -IX Circulatory system | 12 (29) | 18 (15) | X2= 3.322. p= .06836. NS |
| -X Respiratory system | 0 | 6 (5) | Fisher exact test0 0.1933. NS |
| -XI Digestive system | 4 (10) | 18 (16) | X2= 0.9589. p= .327461. NS |
| -XII Diseases of the skin | 1 (2) | 2 (2) | Fisher exact test= 1. NS |
| -XIII Musculo-skeletal | 1 (2) | 7 (6) | Fisher exact test= 0.6828. NS |
| -XIV Genitourinary | 7 (17) | 17 (15) | X2 0.0843. p= .771516. NS |
| TOTAL chronic diseases* | 42 )100) | 115 (100) | --- |
Table-4: Denotes percentages; NS: Not significant; *Patients could have more than one chronic disease. The percentages of chronic diseases are over the total of chronic diseases
Comparison Of Chronic Diseases Between Covid-19 Infections with Test Performed In Health Services And Test Performed At Home In The Period From October 2022 To October 2023
Discusión
1. Main findings
Our study has 3 main results:
2. Comparison with other studies
The emergency of the covid-19 pandemic is over, but the virus continues to circulate. And it won't stop doing so in the near future. Therefore, periods of increased infections can be expected. However, the measurement is no longer as comprehensive as in the first two years and, since the summer of 2022, the up and down oscillations of the transmission were no longer listed in many places, so there is no data to base on when predicting how covid-19 will develop in the coming months [27]. In Spain, since March 2022, cases were no longer measured in the general population and monitoring was restricted to those over 60 years of age. On June 2023, the Health Minister decided that the mask would go from mandatory to only recommended in pharmacies, health centres and social health centres, and it stopped publishing reports on all detected cases, to focus on the same method that has been used for the flu for years. It is calculated with an estimate made with data reported by selected health centres and hospitals. Furthermore, the number of tests sold in pharmacies has been multiplying week after week during the summer, although their results are not officially recorded or made public [28]. Our study indicates that women, young people, milder patients and those with lower risk, perform (and report it to the GP) covid-19 tests at home more frequently. In this way, cases of covid-19 are estimated with tests carried out in health services. But, frequently (although predictably not 100%), people with a positive test at home do communicate this circumstance to their GP, to seek treatment and/or sick leave. In this way, knowing the incidence of covid-19 cases with a positive test at home that is reported to the GP, allows the official under-reporting to be corrected (although it will still represent a minimal incidence since some sick people do not take a test or they do not report it to the GP). In fact, the sales data for antigen tests for Covid-19 has been proposed as an indicator of the variation in incidence in the community [29]. The predominant variants in Spain during the period of our study were those of the XBB family. The XBB.1.5 lineage became dominant globally in February 2023 and in March in Spain. “Eris” variant (EG.5) descendant of omicron, also from the XBB family, spread rapidly since the end of July 2023 in the United States, Europe (including Spain) and Asia. And, in a very small proportion, there is currently another variant that is advancing in the world, the BA.2.86, which has been named as Pirola [1, 28, 30-34]. None of these variants have been shown to cause greater severity or greater escape from vaccines and symptoms remain largely similar to previous omicron variants [35, 36].
The extension of the Eris variant during the summer of 2023 has led to an increase in cases in Spain. In the Community of Madrid (Spain), in mid-August 2023, cases of covid-19 had increased by 20% among the population over 60 years of age; but they also increased in all age groups throughout Europe especially since August 2023. In Spain, some communities reported a significant increase in hospitalizations due to SARS-CoV-2 among the vulnerable population. However, the figures are very far from the great explosion (the second of Omicron) in the summer of 2022. However, it is possible that many of the current infections are occurring with few symptoms or confused with those of other mild conditions. In this scenario, sales of antigen tests increased [28, 32]. Our study shows that home testing was more frequent in autumn, winter and spring, but statistically significantly less frequent in the summer of 2023, where the main wave of cases occurred. Possibly, this higher incidence could have led to more consultation in health services. Furthermore, in that wave there were predictably more serious cases and it affected socio-health workers more who performed their test in health services.
Although severe covid-19 is rare, populations remain vulnerable to future waves of reinfection with emerging SARS-CoV-2 variants despite high vaccination and infection rates [37]. Scientists say that having a good surveillance system to monitor and track emerging variants of the virus is very important, as cycles of infection will continue to occur [7]. However, it seems that political decisions are going in the opposite direction[5, 7]. Policymakers, governments and individuals need data on incidence rates in vaccinated people, to assess the impact of additional doses of vaccines (38, 39). In our study cases with testing at home were more vaccinated with 3 doses, but not with 4 doses. Four doses were mainly given to older and more at-risk people, and so they could be more frequent tested in health services.
In short, public health authorities may need to look at a broader range of indicators to support their disease planning and management efforts. Because in some countries, such as Spain, GPs are the gateway for all patients to the system, and each person is assigned a family doctor (40), an indicator could be the frequency of reporting to GP a positive covid-19 test at home [8, 33]. This data can correct current statistics and give a more realistic view of the number of covid-19 cases in the community.
Limitations and strengths of the study
In the general practice setting in Toledo, Spain, from October 1, 2022 to October 1, 2023, covid-19 cases were diagnosed 3 times more with tests at home than in health services. If the official statistics only collect tests in health services, these data should be multiplied by 3 to get closer to the real number of cases. The cases with testing at home were younger, female, with less severity, vaccinated with 3 doses, but not with 4 doses, and were more frequent than those tested in health services throughout the entire year, except in the largest wave of cases.
Dear Editorial Team, Clinical Medical Reviews and Reports. My experience with the journal was highly positive. The peer-review process was rigorous, constructive, and completed in a timely manner. The reviewers provided valuable comments that helped improve the quality and clarity of our manuscript. The editorial office was professional, responsive, and supportive throughout all stages of the publication process. Communication was clear and efficient, and any questions were addressed promptly. Overall, I found the journal to maintain high scientific standards and an excellent publication workflow. I would be pleased to consider submitting future work to this journal. Best wishes from, Elena Popa.

It was my pleasure to submit my testimonial concerning the Reviewer Board of our Scientific Journal “Brain and Neurological Disorders”. The Reviewers focused on some modifications and their contribution was helpful. The ladies of our Editorial Office were also supported my efforts. It was my honor to have such a co-operation and I am looking forward for more collaboration.

Dear Grace Pierce, Editorial Coordinator of Journal of Clinical Research and Reports, Thank you for the speedy and efficient peer review process. I appreciate the fact that your peer reviewers do not take months to respond like with some other journals. I would also like to thank the editorial office for responding quickly to my questions. It is an excellent journal. I plan to submit more manuscripts in the future. Best wishes from, Robert W. McGee

Dear Grace Pierce, Editorial Coordinator of Journal of Clinical Research and Reports, Working with you and your team on our recent publication in JCRR has been a truly wonderful and enjoyable experience. The responses were prompt, and the reviewers were patient, constructive, and highly professional. One reviewer in particular gave me the feeling that a professor was carefully reading and commenting on my coursework, which was deeply touching. The entire process was straightforward and hassle‑free, with no tedious online forms to complete. I highly recommend this journal. Best wishes from, DR Aibing Rao, Head of R&D

I Appreciate the Opportunity to Share my Experience with the Journal of Clinical Research and Reports. The peer review process was timely and constructive, and the feedback provided helped improve the quality of our manuscript. The editorial office was professional, responsive, and supportive throughout the process, ensuring smooth communication and efficient handling of the submission. Overall, it was a positive experience collaborating with your team.

Dear Mercy Grace, Editorial Coordinator of Obstetrics Gynecology and Reproductive Sciences, We would like to express our gratitude for your help at all stages of publishing and editing the article. The editors of the magazine answer all the necessary questions and help at every stage. We will definitely continue to cooperate and publish other works in the Obstetrics Gynecology and Reproductive Sciences! Best wishes from, Alla Konstantinovna Politova,
