
Research Article | DOI: https://doi.org/10.31579/2690-8808/114
Department of Nursing and Physiotherapy, Faculty of Nursing and Physiotherapy, Universidad de Salamanca, Salamanca, Spain.
*Corresponding Author: Rocío Llamas-Ramos, Department of Nursing and Physiotherapy, Faculty of Nursing and Physiotherapy, Universidad de Salamanca, Salamanca, Spain
Citation: Fátima Pérez-Robledo, Beatriz María Bermejo-Gil, Rocío Llamas-Ramos, Juan Luis Sánchez-González and Inés Llamas-Ramos. (2022). Covid-19 impact on Spanish population. Symptom´s prevalence and protocols followed. Journal of Clinical Case Reports and Studies 3(5); DOI: 10.31579/2690-8808/114
Copyright: © 2022 Rocío Llamas-Ramos, This is an open access article distributed under the Creative Commons Attribution License, which permits unrestricted use, distribution, and reproduction in any medium, provided the original work is properly cited.
Received: 12 May 2022 | Accepted: 25 April 2022 | Published: 04 June 2022
Keywords: covid-19, prevalence, symptom, survey, spanish population
Introduction: The SARS-CoV-2 generates a global health emergency due to the high incidence of diagnosed cases of Covid-19. Spain has been one the most affected countries. The information about the evolutionand complications of this new and unpredictable disease is low. Epidemiological studies made necessary to establish the most appropriate treatments.
Objective: To establish the Spanish population characteristics in relationto Covid-19, symptoms,diagnosis and quarantine mean days.
Design: Epidemiological study.
Methods: The questionnaire was designed with Covid-19 questions and demographic data of the sample. It had several sections, as an informative sheet and informed consent, participant´s demographic data, Covid-19 diagnosis, hospital admissions and quarantine among others.
Results: 1500 answers have been collected via WhatsApp, social networks and email among all the Spanish population. The most affected age was people between 40-65-years old (53,9%), being more prevalent in women (67.8%); the blood group more prevalent was A+ (31.5%) and the most frequent symptoms were severe tiredness (68.2%), myalgia (65%) and headaches (64.6%).
Conclusion: The study provides relevant data about the general Spanish population on the third wave in relation to Covid- 19 patients. The online survey has been the safest method for collecting information from the general population. More epidemiological studies on the general are needed to collect information on Covid-19 symptoms.
The current outbreak of SARS-CoV-2 in the Wuhan province of China has spread to almost all the countries of the world, generating a global health emergency due to the high incidence of diagnosed cases of Covid- 19.
Currently, a total of 83 millionpeople has been infected by the virus.The incidence increases by 4 millioncases, with 76,000deaths each week [1]. Spain is one of the most affected countries. During the first wave of the pandemic, more than 200,000 cases of infected people were recorded, of which 12% died because of the disease [2]. Nowadays, more than 2 million cases of infected people have been counted [3].
On December 27. 2020, Spain presents a total of 12.172 people admitted for Covid-19,filling 10.04% of hospital beds. Likewise, 2.022 people are admitted to the Intensive Care Units (ICU) filling 21.14% of the beds in these units [4]. Regarding mortality, it is estimated that around 48.926 have died [5]. These data guide us that we would be at the door of a third wave.
The most common symptoms of the disease are fever, dry cough and fatigue. Other less common symptoms are muscle aches and pains, sore throat, conjunctivitis, loss of sense and smell, and skin rashes or loss of color on the fingers, as well as gastrointestinal disorders and asymptomatic infections [6-9]. Regarding the incubation period, some studies estimate that it oscillates around 3-5 days [10].
Considering diagnosis, the main methodis the collection of samplesfrom the upper respiratory tract using nasopharyngeal and oropharyngeal swabs [8].
To determine the consequences of the pandemic, online surveys have become a promising method of synthesizing the situation of the population [11, 12]. There are more and more studies that use this type of survey to assess how the population is perceiving this Covid-19 outbreak or to analyze the prevalence and impact due to the disease [12-14].
The aim of this study has been to apply a rapid online survey to determine the Spanish situation on the third wave of thepandemic.
Epidemiological study to establish the Spanish population´s characteristics in relation to Covid-19, symptoms, diagnosis, and quarantine mean days to determine the most appropriate action protocol.
The questionnaire included Covid-19 questions about a representative population sample.
The questionnaire was designed through "Google Forms". Prior to its completion, the participants read an information sheet (first section), where the objectives were described, and the questionnaire characteristics were reported.
The questionnaire consisted of 5 sections: "participant’s information", "demographic data", "Covid-19", "Covid-19 positive" and "acknowledgement". All sections had to be completed. Finally, an acknowledgement section for the collaboration in the study was presented. The sections are explained below.
First section: information for participants. Study design description, objective, questionnaire brief description, benefits and risks of filling it, confidentiality and research team information. At the end of the section, participants must check the box for informed consent acceptance to confirm the information reading and understanding, as well as their voluntary participation before accessing the questionnaire.
Second section: demographic data, birth date (day, month, year), gender (woman or man), blood group (A+, A-, B+, B-, AB+, AB-, 0+, 0-, don't know); previous diagnosed illnesses were asked with the following options: diabetes, arterial hypertension, heart disease, asthma, chronic obstructive pulmonary disease, allergy,vascular disorders, stroke,cancer, transplantation, hepatitis and psychiatric illness; region and province residence (19 and 52 options respectively), live area (“rural” or “urban”) and people who make up your family unit / coexist with you.
Third section: Covid-19. This section consisted of a single question: "Have you suffered from Covid-19? With 3 possibleanswers: "yes", "no" and "I don't know".
Fourth section: Covid-19 positive. In this section 9 questions have been included. "What month did you suffer from the disease in?" was asked and the 12 possible options corresponding to the 12-year months. Diagnosis was the next question. In this case, the question asked was "Indicate how were you diagnosed" with 4 answers’ options "PCR (swab in nose)", "Antigen test with capillary blood sampling (finger prick)", "Antigen test with nasopharyngeal" and "Serology (analytical)". The answer selection was dichotomous "yes" or "no". The following question was: "Was the test repeated?" and the possible answers were "yes" or "no". The next one: "How many days elapsed between the tests?" with a short text answer as an option. Symptoms conformed to the following section: "Have you suffered any of these symptoms?" A list of 17 symptoms was described and the answer had to be "yes" or "no" for each symptom. The symptoms were: "fever", "chills", "cough", "sore throat",
"headache", "anosmia (loss of smell)", "ageusia (loss of taste)", "myalgia (muscle aches)", "severe tiredness", "dyspnea (feeling short of breath)", "chest pain or pressure", "nausea, vomiting, diarrhea", "cyanosis (bluish lip color)", "confusion or drowsiness", "skin rashes", "other symptoms" and "asymptomatic". Information was also collected on "How many days did the symptoms last?". The next question was: "Did you have to be hospital admitted?" with 2 possible answers "yes" or "no". Finally, quarantine information was requested: "How many days did you have to quarantine?". The last question was: "Were you able to remain separated from others in your home during the quarantine?" In this case the options were "yes", "no" or "not applicable".
Fifth section: Acknowledgment. An acknowledgment section was included after conducting the survey for the collaboration offered. Participants who answered "No" or "I don't know" in the third section were directly managed to this one.
All questionnaire questions were mandatory except those mentioned above aboutthe time elapsedbetween the 2 tests in the eventof not having performed a second diagnostic test and the one related to the symptom’s duration, since the participants may not have had any symptoms. Both in section 4.
A first draft was made, and external collaborators were requested for opinion to carry out a pilot test. After this test, all those erroneous or confusing aspects were collected and corrected in the next questionnaire version. A second test was performed to ensure that the questionnaire collected those variables that were to be measured. Sections were well understood and there were no errors in questions formulation.
An informative sheet and the questionnaire were distributed via WhatsApp, social networks and email. Present a mobile device to complete the questionnaire and have full mentalfaculties to be able to fill it out were the inclusioncriteria. No exclusioncriteria were established in relation to age, level of education or training or geographical location. The questionnaire was registered in clinical trials with the registry number: NCT04659473.
The sample recruitment was carried out in December 2020. If any participant had doubts, they were able to contact the research team through the email located in the information sheet in the first section of the questionnaire.
IBM-SPSS Statistics (version 26) was employed for Statistical analysis. A descriptive analysis was performed, using the mean and standard deviation as descriptors for quantitative data and counts and percentages in the case of qualitative variables. A 95% safety level was considered. Cross tables were also made to see the relationship between some variables.
A total of 1500 participants completed the online survey of our study, 67.8% of them were women and the mean age of the sample was 41.97 ±
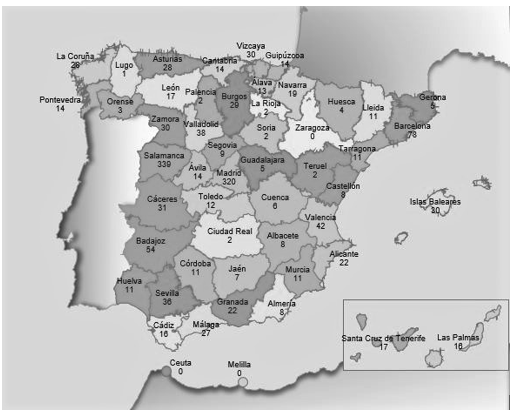
12.8 years-. 32% of the participants were from Castilla y León, with 21.7% of the sample from Salamanca. 21% of the participants belonged to the Community of Madrid, and the rest were distributed among the other regions of our country (Figure 1). 81.7% of the sample lived in urban areas, with an averagenumber of cohabitants in each familyunit of
2.91 ± 1.16 people.
Regarding their clinical history, a low prevalence of the evaluated diseases was observed, being more frequent the presence of allergies (26.4%), asthma (9.2%) and arterial hypertension (7.2%). The rest of the diseases were not representative. The most frequent blood groups were A+ and 0+, accounting for 59.2% of the sample between them. The rest was distributed among the rest of the groups or those participants who did not know it (Table 1).
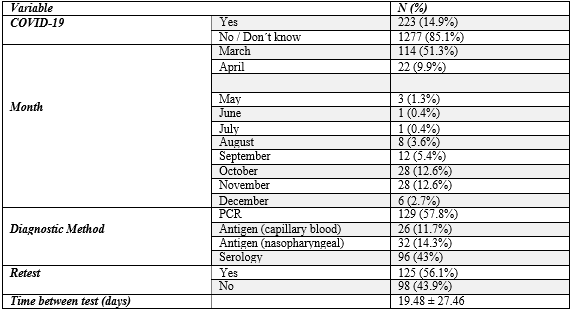
14.9% of the participants of our sample suffered from Covid-19 at some moment, March, October, and November were the most prevalent months.
The diagnosis tests more used were PCR and serology. More than half of the Covid-19 patientshad the test repeated to check the persistence of the virus with a mean time between tests of 19.48 ± 27.46 days.
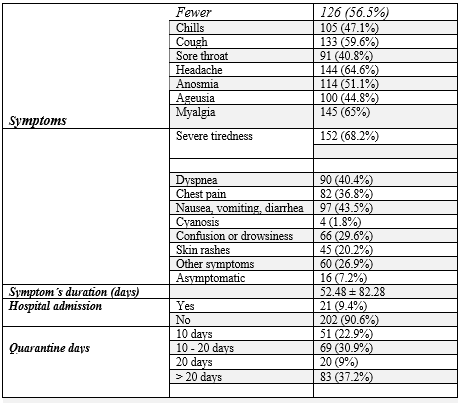
The most frequent symptoms were intense tiredness, myalgia, headache, cough, fever and anosmia,which appeared in more than half of the people who suffered from the disease. The rest of the symptoms did not appear in so many cases, skin conditions was the leastpresent (1.8%). Only 7.2% of our sample turned out to be asymptomatic. These symptoms remained in the patients for a mean time of 52.48 days. The symptom´sseverity led to admission to 9.4% of the participants with Covid-19.
Most Covid-19 patients had to quarantine for more than 10 days, and in many cases, they had no problem staying separated from other people at home (Table 2).
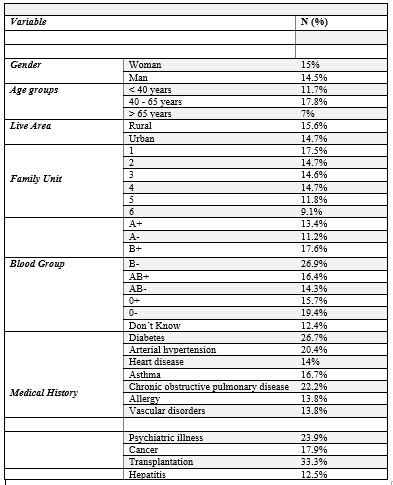
Both men and women had a similar proportion of infected people around 15%. The age group with the highest proportion of positive cases were
those between 40 and 65 years old, followed by those under 40 years of age and lastly, the elderly. The area of residence did not influence the number of infections, both of which presented a percentage of around 15%. No differences were observed in terms of the number of partners in the home.
Women had more frequent cough, fever and myalgia, while men had headache, severe fatigue and myalgia. People under 65 years of age presented to a greater extent intense fatigue, myalgia, headache and cough, while the elderly were affected mainlyby fever and myalgia (7%).
In relation to the blood group, groups B- and 0- were the ones with the highest proportion of people with the disease (26.9% and 19.4%).People with transplantation, diabetes, psychiatric illness, chronic obstructive pulmonary disease and arterial hypertension were more likely to contract the virus (>20%) (Table 3).
Finally, considering the symptoms distribution in relation to the blood groups, the people with groups A had myalgia (8.4% and 11.2%) to a greater extent (6.7% and 9.2%), those with group 0 had intense fatigue (12% and 13.9%), and in the rest of the groups there was a greater distribution of symptoms without any predominant (Table 4).
| Fever | Chills | Cough | Sore throat | Headache | Anosmia | Ageusia | Myalgia | Severe tiredness |
| Dyspnea | Chest pain | Nausea | Cyanosis | Confusion | Skin rash | Other symptom | Asymptomatic | ||
Gender | Women | 8.1% | 7.2% | 8.7% | 6.6% | 10.2% | 8.3% | 7.3% | 10.1% | 11% |
| 6.4% | 6% | 7.1% | 0.3% | 4.6% | 3.1% | 4.3% | 0.9% | |
Men | 9% | 6.6% | 9.3% | 4.8% | 8.1% | 5.9% | 5.2% | 8.6% | 8.1% |
| 5% | 4.3% | 5% | 0.2% | 3.8% | 2.7% | 3.4% | 1.6% | ||
Age group | <40> | 4.9% | 3.7% | 6.2% | 4.9% | 6.3% | 6% | 5.1% | 6.2% | 6.6% |
| 3.2% | 3.9% | 3.7% | 0.2% | 1.8% | 2% | 1.8% | 0.9% | |
40-65 | 11.3% | 9.8% | 11.3% | 7.1% | 12.6% | 9.3% | 8.2% | 12.6% |
|
| 8.5% | 7.1% | 9% | 0.4% | 6.6% | 3.8% | 5.8% | 1.2% | ||
years |
|
|
|
|
|
|
|
| 13.2% |
|
|
|
|
|
|
|
|
| ||
>65 years | 7% | 4.7% | 4.7% | 4.7% | 2.3% | 0 | 2.3% | 7% | 4.7% |
| 0 | 0 | 0 | 0 | 2.3% | 2.3% | 2.3% | 0 | ||
Blood Group | A+ | 6.7% | 5.3% | 6.5% | 4.1% | 7.5% | 5.3% | 4.7% | 8.4% | 8.4% |
| 5.5% | 4.9% | 5.3% | 0 | 3.1% | 1.8% | 3.1% | 1.4% | |
A- | 9.2% | 6.1% | 8.2% | 5.1% | 8.2% | 8.2% | 5.1% | 11.2% |
|
| 5.1% | 3.1% | 3.1% | 1% | 4.1% | 5.1% | 6.1% | 0 | ||
|
|
|
|
|
|
|
|
| 9.2% |
|
|
|
|
|
|
|
|
| ||
B+ | 13.2% | 9.9% | 11% | 5.5% | 14.3% | 8.8% | 7.7% | 8.8% | 13.2% |
| 11% | 6.6% | 12.1% | 1.1% | 6.6% | 5.5% | 6.6% | 1.1% | ||
B- | 15.4% | 19.2% | 19.2% | 15.4% | 15.4% | 19.2% | 19.2 | 15.4% | 11.5% |
| 15.4% | 11.5% | 11.5% | 0 | 7.7% | 7.7% | 3.8% | 0 | ||
|
|
|
|
|
|
| % |
|
|
|
|
|
|
|
|
|
| |||
AB+ | 13.1% | 6.6% | 8.2% | 8.2% | 13.1% | 9.8% | 8.2% | 13.1% | 13.1% | 8.2& | 6.6% | 8.2% | 1.6% | 8.2% | 1.6% | 4.9% | 0 | |||
AB- | 0 | 14.3% | 0 | 14.3% | 14.3% | 14.3% | 14.3% | 14.3% | 14.3% | 14.3% | 14.3% | 14.3% | 0 | 14.3% | 14.3% | 14.3% | 0 | |||
0+ | 8.3% | 9.5% | 9.7% | 7.6% | 11.6% | 9% | 7.9% | 11.6% | 12% | 6% | 6% | 8.3% | 0.2% | 6.3% | 3.7% | 5.1% | 1.9% | |||
0- | 10.2% | 8.3% | 13.9% | 8.3% | 10.2% | 9.3% | 8.3% | 11.1% | 13.9% | 7.4% | 6.5% | 5.6% | 0 | 3.7% | 1.9% | 3.7% | 0 | |||
Don´t know | 7% | 2.2% | 8.6% | 4.8% | 6.5% | 5.9% | 5.9% | 5.4% | 5.9% | 2.2% | 4.3% | 3.2% | 0 | 1.1% | 2.2% | 1.1% | 0.5% | |||
Through the survey responses, we have identified interesting factors that can contribute to the study of the population in this third wave of the pandemic.
First, our study highlights the use of online questionnaires can safely assess the general population, providing data on non-hospitalized patients and reaching larger sample numbers [15].
Our sample tried to have a representation of each region, although this representation was not balanced between all geographical areas. This makes it difficult to clarify precisely the behavior that the virus has had in the different regions. However, regarding the area of residence, although differences were found between the two, they were expected. The Spanish population has been in a rural-urban migration since the 1960s [16], which is observed in the population of our study.
Secondly, it should be noted that the incidence of Covid-19 data obtained in our study (15%) agrees with the data obtained by the Spanish Health Ministry, that estimate the prevalence at 9.9%. Regarding the incidence by autonomous communities, the Health Ministry study observes a marked geographical variability, coinciding with the data obtained in our study [17].
One of the findingsthat differ with the scientific literature is the presence of the same form of infections in the urban and rural population, unlike what was observed in previous stages [18]. It was shown a higher prevalence of the disease in the urban environments.
The diagnostic test most used to detect the virus was the PCR. This makes sense if we consider that it is the gold standard in detection of SARS- CoV-2 [19]. Some medical history predicted the possibility of contagion, such as chronic obstructive pulmonary disease or cardiovascular conditions, which had also previously been related to a worse prognosis [20,21].
Regarding the symptoms, and coinciding with other studies, the most frequent symptomswere intense fatigue,myalgia, headache, cough, fever and anosmia [22]. The mean duration of symptoms was 52.48 days, exceeding 9 months in some cases. These figures are much higher than that reported by different authors, who place the recovery time at approximately 10 days [22]. The prevalence of asymptomatic patients in our sample is much lower than that reported by other studies, which postulate that around 40% of cases may be asymptomatic; evidencing in a way the need for screening to identify these patients [23].
An ABO blood group to SARS-CoV-2 is hypothesized, different authors show an association of group A with a greater number of cases [24-25].
However, in our study, although there was representation of all groups, positive cases had a higher prevalence in subjects with group B and 0, although it is true that the subjects of group A shown more severe symptoms. These data can be explained, since studies on the association between AB0 blood groups and SARS-CoV-2 have been performed in hospital patients [26], showing higher mortality in group A patients [24]. It is possiblethat when our study was conducted in the generalpopulation, the data vary, and the frequency of contagion was shown in another sense bynot analysing only those patientswho had severesymptoms. Our study reviews the results of the frequency of symptoms, not their intensity, it could be that even with fewer symptoms, group A participants had a worse prognosis and a greater probability of ending up in hospital.
Regarding the isolation period, the study shows how the population correctly carried out the necessary period, being even higher, since it is known that the viral load of SARS-CoV-2 viral load appeared to peak in the first week of illness, whereas at days 10–14 not infective virus has been found [27].
One of the greatest strengths of our study is that it was based on the general population, analyzing the situation prior to the third wave in Spain, with a representative simple, collecting information on how they have experienced the situation to face the new waves.
The major limitation was the disparity of participation between communities because some communities had low participation.
This study provides relevant data about the general Spanish population before the third wave. The survey was well received and participated. In addition, it has been the safestmethod for collecting information from the general population.
To Dr. Miguel Marcos and all our participants for their collaboration and questionnaire diffusion.
The authors declared no potential conflicts of interest with respect to the research, authorship, and/or publication of this article.
The authors received no financial support for the research, authorship, and/or publication of this article.
Dear Editorial Team, Clinical Medical Reviews and Reports. My experience with the journal was highly positive. The peer-review process was rigorous, constructive, and completed in a timely manner. The reviewers provided valuable comments that helped improve the quality and clarity of our manuscript. The editorial office was professional, responsive, and supportive throughout all stages of the publication process. Communication was clear and efficient, and any questions were addressed promptly. Overall, I found the journal to maintain high scientific standards and an excellent publication workflow. I would be pleased to consider submitting future work to this journal. Best wishes from, Elena Popa.

It was my pleasure to submit my testimonial concerning the Reviewer Board of our Scientific Journal “Brain and Neurological Disorders”. The Reviewers focused on some modifications and their contribution was helpful. The ladies of our Editorial Office were also supported my efforts. It was my honor to have such a co-operation and I am looking forward for more collaboration.

Dear Grace Pierce, Editorial Coordinator of Journal of Clinical Research and Reports, Thank you for the speedy and efficient peer review process. I appreciate the fact that your peer reviewers do not take months to respond like with some other journals. I would also like to thank the editorial office for responding quickly to my questions. It is an excellent journal. I plan to submit more manuscripts in the future. Best wishes from, Robert W. McGee

Dear Grace Pierce, Editorial Coordinator of Journal of Clinical Research and Reports, Working with you and your team on our recent publication in JCRR has been a truly wonderful and enjoyable experience. The responses were prompt, and the reviewers were patient, constructive, and highly professional. One reviewer in particular gave me the feeling that a professor was carefully reading and commenting on my coursework, which was deeply touching. The entire process was straightforward and hassle‑free, with no tedious online forms to complete. I highly recommend this journal. Best wishes from, DR Aibing Rao, Head of R&D

I Appreciate the Opportunity to Share my Experience with the Journal of Clinical Research and Reports. The peer review process was timely and constructive, and the feedback provided helped improve the quality of our manuscript. The editorial office was professional, responsive, and supportive throughout the process, ensuring smooth communication and efficient handling of the submission. Overall, it was a positive experience collaborating with your team.

Dear Mercy Grace, Editorial Coordinator of Obstetrics Gynecology and Reproductive Sciences, We would like to express our gratitude for your help at all stages of publishing and editing the article. The editors of the magazine answer all the necessary questions and help at every stage. We will definitely continue to cooperate and publish other works in the Obstetrics Gynecology and Reproductive Sciences! Best wishes from, Alla Konstantinovna Politova,
