
Research Article | DOI: https://doi.org/10.31579/IJBR-2021/025
BSc Biomedical Science, USA.
*Corresponding Author: Emmanuel Oluwabori Bajo, BSc Biomedical Science, USA
Citation: Citation: Emmanuel O. Bajo (2022) Comparison of the Clauss and Prothrombin time-derived Fibrinogen Methods in Patients with Dysfibrinogenemia, and Verification of their Reference Interval; International Journal of Biomed Research. 2(1); DOI:10.31579/IJBR-2021/025
Copyright: © 2022, Emmanuel Oluwabori Bajo, This is an open access article distributed under the Creative Commons Attribution License, which permits unrestricted use, distribution, and reproduction in any medium, provided the original work is properly cited.
Received: 08 June 2021 | Accepted: 20 October 2021 | Published: 03 January 2022
Keywords: dysfibrinogenemia, inherited dysfibrinogenemia, acquired dysfibrinogenemia, clauss assay, PT-derived method, verification, reference interval
Dysfibrinogenemia is a coagulation disorder caused by abnormal fibrinogen functions, with ever-growing concern in medical field. Therefore, it is critical to establish and optimise effective methods, both in terms of efficient and accurate clinical diagnosis and cost effectiveness. Fibrinogen assays; PT-derived and Clauss quantification are such method. This study, compared fibrinogen concentrations determined by the Clauss and PT-derived methods in 80 patients (diseased clinical group) and in 20 and 120 healthy patients (pilot and main study respectively). Reference interval verification was done following the Clinical and Laboratory Standards Institute guidelines.
Results: There was a significant difference between Clauss fibrinogen and PT-derived fibrinogen irrespective of sample clinical groups, although, the discrepancy between these two assays appeared to correlate. Normal patients (mean PT-Fib 4.50 vs Clauss 3.07g/l, p <0.0001), r = 0.7567. Liver/renal dysfunction (mean PT-Fib 2.20 vs Clauss 1.75g/l, p = 0.0003), r = 0.8622. Critically-ill (mean PT-Fib 2.7 vs Clauss 2.17g/l, p <0.0001), r = 0.9553 and OAC (mean PT-Fib 3.49 vs Clauss 2.49g/l, p = 0.0004), r = 0.8158. 70% of PT-derived and 95% of Clauss fibrinogen results were within the reference interval 1.5 – 4.5 g/L. Verification of the published reference interval failed as >10% of the PT-derived results were outside the reference interval.
Conclusion: Performing both PT-derived and Clauss methods on all clotting screen requests will prevent missed diagnosis, although, it will provide extra cost of £10,825. Thus, it is necessary to determine fibrinogen reference intervals for both the PT-derived and Clauss methods. Until further studies verify a reference interval for PT-Fib at the IH, the Clauss assay is a preferable diagnostic tool when treating patients with low fibrinogen concentrations. The PT-derived may erroneously report patients’ plasma fibrinogen concentration as normal.
CD: Coagulation disorder
Q.F.A: Clauss assay
PT-Fib: Prothrombin time-derived fibrinogen
PT: Prothrombin time
IH: Ipswich Hospital
CLSI: Clinical and Laboratory Standards Institute
RI: Reference interval
FpA: Fibrinopeptide A
FpB: Fibrinopeptide B
N-terminal: Amino-terminal
C-terminal: Carboxyl group
FGA: Fibrinogen gene alpha
FGB: Fibrinogen gene beta
FGG: Fibrinogen gene gamma
APTT: Activated partial thromboplastin time
TT: Thrombin time
MCF-7: Michigan Cancer Foundation-7
UKAS: United Kingdom Accreditation Service
OAT: Oral anticoagulant treatment
INR: International normalized ratio
ML: Millilitre
RMP: Revolutions per minute
RTF: Recombinant human tissue
P-values: Probability values
NHS: National Health Service
IQC: Internal Quality Control
BHS: British Society for Haematology
V-K: Vitamin-k
IL: Instrumentation Laboratory
VS: Versus
Fibrinogen
Fibrinogen is a major plasma protein (hexametric glycoprotein) with coagulation function and a normal concentration of 1.5 – 4.0 g/L. It is synthesised by the liver and released into the circulation alongside several other coagulation factor proteins in vertebrate’s blood [28]. Fibrinogen is a large heterogeneous family of two trimers, each of which is comprised of three different polypeptide chains: an (alpha) α-chain, encoded by the fibrinogen alpha chain (FGA) gene; a (beta) β‐chain, encoded by the fibrinogen beta chain (FGB) gene; and a (gamma) γ‐chain encoded by the fibrinogen gamma chain (FGG) gene (Figure 1) [2]. The heterogeneity of fibrinogen is due to heterogeneities in all three chains, which may differ from person to person and may affect the obvious fibrinogen concentrations in different assays. All three genes are located on the long (p) arm of human chromosome 4 (at positions 4q31.3, 4q31.3, and 4q32.1, respectively) and may contain mutations that can cause congenital dysfibrinogenemia [32].
The structure of fibrinogen
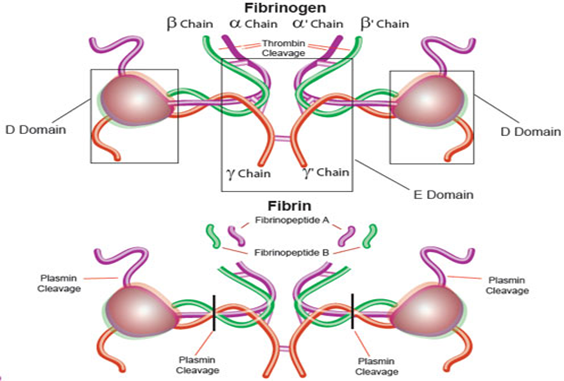
Fibrinogen is a large heterogeneous family of closely related molecules consisting of three different pairs of polypeptide chains: two A alpha-, two B beta- and two gamma-chains. The polypeptide chains are linked by 29 disulphide bridges in such a way that N-terminal regions of the 6-polypeptide chains meet to form a central E-domain. The C-terminal regions [α, β and γ] for the D-domain are joined by α-helical ropes to the central E-domain to give the characteristic fibrinogen structure. Fibrinogen is essential for a variety of processes including blood clot formation, wound healing, inflammation, and blood vessel growth [28]. The heterogeneity of fibrinogen is due to heterogeneities in all three chains, which may differ from person to person and may affect the obvious fibrinogen concentrations in different assays [40].
Note: activation of fibrinogen by thrombin [IIa] cleaves the two short peptides from the N-terminal regions of α and β chains - known as Fibrinopeptide A [FpA] and B [FpB] respectively. Removal of the N-terminal sequences from α and β chains reveals new N-terminal sequences in α and β chains located within the E-domain knowns as 'knobs’. These knobs can interact spontaneously with the D-dimer regions to form fibrin polymers under the influence of factor XIIIa (Franzblau et al., 2012). The cross-linked fibrin polymers and aggregated platelets then block the damaged blood vessel and prevent further bleeding. Adopted from (Merck, 2019).
Fibrinogen and its proteolytic cleavage product, fibrin, are critical plasma proteins with multiple functions in blood clotting. Although the primary function of fibrinogen is in fibrin clot formation, it has a multitude of other functions which include factor XIIIa–mediated fibrin crosslinking, non-substrate thrombin binding, a ligand for platelet glycoprotein IIb/IIIa, platelet aggregation, and fibrinolysis (Figure 3). A variety of structural abnormalities can occur in fibrinogen and can interfere with one or more of its haemostatic roles. Structurally abnormal fibrinogens are collectively termed dysfibrinogenemia (Acharya, 2018; Lewis, Bain and Bates, 2006).
Dysfibrinogenemia
Dysfibrinogenemia is a coagulation disorder caused by a variety of structural abnormalities in the fibrinogen molecule that result in abnormal fibrinogen function within the body. Having abnormal fibrinogen results in defective clot formation and can cause an increased or decreased ability to clot. Dysfibrinogenemia can be inherited (congenital) or acquired. The inherited form is associated with increased risk of bleeding and/ or thrombosis in the same patient or family. The acquired form is diagnosed by demonstrating abnormal liver function and is also associated primarily with pathological bleeding [31].
Inherited dysfibrinogenemia
Pathophysiology
Inherited (congenital) dysfibrinogenemia, frequently caused by heterozygous missense mutations in the coding region of the fibrinogen Aα (FGA), Bβ (FGB), or γ (FGG) genes on chromosome 4 (Figure 2) [6]. A majority of dysfibrinogenemia have an autosomal dominant inheritance. The pathophysiologic mechanism of bleeding in most cases is a result of defective fibrin clot formation. This defect is caused by impaired thrombin-mediated release of fibrinopeptide A and/or fibrinopeptide B from α and β chains of the fibrinogen molecule (Figure 2), as well as impaired fibrin monomer polymerization by the Factor XIIIa (Figure 3) [7; Pietrys et al., 2011).
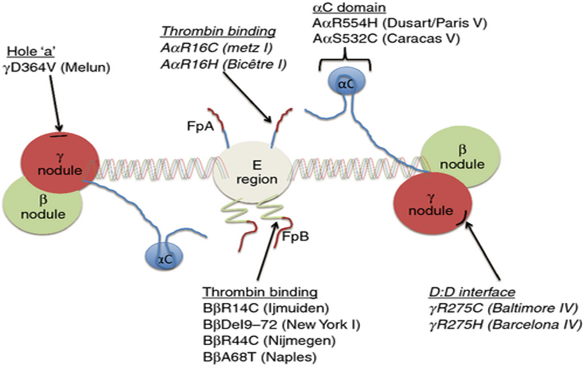
Two general pathophysiological mechanisms were proposed after reviewing the pathophysiological basis of thrombosis (i.e., thrombophilia) in dysfibrinogenemia. The first is impaired anticoagulant function. This impairment is caused by mutations that lead to defective thrombin binding to low-affinity non-substrate binding sites on fibrin (Rogers and Kottke-Marchant, 2018; 7]. This defect presumably results in the release of thrombin into the circulation, leading to increased fibrin clot formation and a tendency toward pathologic thrombosis (Escobar and Roberts, 2013). The second mechanism is impaired profibrinolytic function. This impairment is caused by mutations that lead to; either defective binding of profibrinolytic proteins (tissue plasminogen activator, plasminogen) to fibrin; or resistance of fibrin to the digestive action of plasmin (Cunningham et al., 2002). These defects cause impaired fibrinolysis and a tendency toward pathological thrombosis. The specific mutations that are most likely associated with thrombosis are shown in this figure (Cunningham et al., 2002).
Clinical Features
The prevalence of inherited dysfibrinogenemia reported worldwide is only 200 – 300 patients (Burgess, 2015). Approximately 40% have no symptoms, 50% have a bleeding disorder, and the remaining 10% have a history of bleeding or thrombosis (Escobar and Roberts, 2013). Interestingly, 27% of patients who have had a thrombotic event also have a history of bleeding (Rogers and Kottke-Marchant, 2018). Bleeding in patients tends to be relatively mild or even absent; asymptomatic dysfibrinogenemia is usually brought to clinical attention because of an abnormal laboratory test (i.e., thrombin time) (Yan et al., 2016). Bleeding manifestations include easy bruising, menorrhagia, hematomas, and delayed wound healing. While thrombotic manifestations include myocardial infarction, pulmonary embolism, arterial thrombosis, and a combination of arterial and venous thrombosis (Bithell, 1985; Yan et al., 2017). Symptoms and treatments are individualized depending on their specific mutation and severity in each person [40].
Acquired dysfibrinogenemia
Pathophysiology
Acquired dysfibrinogenemia occurs most often in patients with severe liver disease, autoimmune disease or certain cancers (Gailani et al., 2018). This defect is caused by the impairment of the fibrinogen manufactured in the liver as a result of a structural defect caused by an increased sialylation of carbohydrate side chains of the fibrinogen molecule (Burgess, 2015). The additional sialic acid residues are localized to the β and γ chains. This chemical change increases the net negative charge of fibrinogen, which promotes charge repulsion between fibrin monomers and decreases the rate of fibrin polymerization (Bérubé, 2016). Rarely, dysfibrinogenemia may also be associated with malignancies, mostly in patients with primary or secondary liver tumours. In vitro data suggest that the mechanism of cancer-associated dysfibrinogenemia involves the synthesis and secretion of abnormal fibrinogen by tumour cells. An example is MCF-7 human breast carcinoma tumour cell lines which are capable of synthesising fibrinogen. In the case of MCF-7 cells, the fibrinogen Bβ chain is missing an amino terminal peptide fragment, and the final molecule is defective in assembly (Cunningham et al., 2002; Lewis, Bain and Bates, 2006).
Clinical Features
The prevalence of acquired dysfibrinogenemia is higher in patients with liver disease such as cirrhosis or liver tumours (76% to 86%) than in those with obstructive jaundice (8%) (Gailani et al., 2018). Acquired dysfibrinogenemia is also a paraneoplastic marker of certain malignancies, such as hepatoma and renal cell carcinoma (Cunningham et al., 2002). The dysfibrinogenemia is usually present at the time of diagnosis and disappears when the tumour is in remission. The dysfibrinogenemia can also reappear after tumour relapse. Approximately 50% of patients with severe liver disease have bleeding tendencies secondary to abnormal fibrinogen. The condition tends to worsen as the liver disease worsens (Gailani et al., 2018; Bérubé, 2016).
Laboratory Diagnosis of Dysfibrinogenemia – Measurement of Fibrinogen
Laboratory testing is critical for accurate diagnosis of dysfibrinogenemia. Fibrinogen assays are an important screening tool for blood coagulation disorders or an unexplained prolongation of the activated partial thromboplastin time (APTT) or prothrombin time (PT). The Clauss and PT-derived methods are both coagulable protein methods for quantification of fibrinogen concentrations. Although numerous methods are available, no consensus has been reached as to which method is preferable. Many laboratories automated analysers provide a measure of fibrinogen concentration estimated from the coagulation changes during the PT (PT-derived fibrinogen) (Figure 3). However, it tends to give higher estimates of fibrinogen levels than the Clauss assay [28].
Fibrinogen activity is based on the measurement of fibrin polymerization function. Despite the limitations of the Clauss and PT-Fib, these two remain the most commonly used assays in hospital laboratories. The Clauss method measures the rate of clot formation and resultant change in light absorbance after adding a high concentration of thrombin to citrated plasma (Figure 3). The fibrinogen activity of the patient sample is derived from a standard curve relating the clotting time to plasma standards of known fibrinogen activity. While the prothrombin time–based method assigns a fibrinogen result indirectly using the change in optical density following the addition of recombinant-plastin to the patient sample. The fibrinogen activity of the patient sample is determined from a standard curve relating the maximum turbidity of the clot (derived from the prothrombin time polymerization curve) to plasma standards of known fibrinogen activity [29].
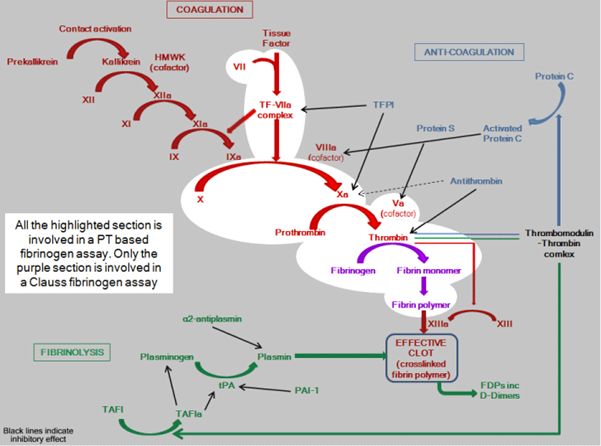
The two phases of coagulation: a) The initiation phase highlighted in red act as a spark for thrombin formation and; b) The propagation, highlighted in purple, acts as a spark for fibrin clot formation. Whereas in green is highlighted fibrin, an essential matrix for regulation of fibrinolysis and facilitation of cell attachment in wound healing (Crosslinking).
The normal process of blood clot formation involves the coordinated operation of two separate pathways (extrinsic and intrinsic pathways) that feed into a final common pathway: 1) primary haemostasis, i.e. the adhesion, activation, and aggregation of circulating blood platelets at sites of vascular injury and 2) secondary haemostasis, i.e. cleavage of the α and β chains of fibrinogen by thrombin to form individual fibrin strands which form a mesh of fibres around the platelet plug and traps blood cells to form a temporary clot. When the damaged region is completely repaired, an enzyme (plasmin) is activated to dissolve the clot (fibrinolysis).
Note: In the laboratory, PT measures the activity of the extrinsic pathways; hence, it is sensitive to abnormalities in factor VII, X, V, II (prothrombin) and fibrinogen. A PT test is performed by adding calcium and thromboplastin, an activator of the extrinsic pathway, to the blood sample then measuring the time (in seconds) required for fibrin clot formation. While APTT measures the activity of the intrinsic pathways, thereby is sensitive to abnormalities in factor XII, XI, IX & VIII. (Practical-haemostasis, 2019).
Fibrinogen Reference Interval in Laboratories Diagnosis of Dysfibrinogenemia
Reference intervals are essential tools if a clinical laboratory test is to be interpreted for the benefit of patient care. The quality of the reference interval determines the quality of the result with nearly 80% of clinician’s medical decisions being based on information provided by laboratory reports [22]. Fibrinogen heterogeneity and sensitivity to environmental factors makes it an ideal subject for discussion regarding the evolutionary hypotheses in humans. Variability in fibrinogen concentrations between two given populations is most commonly due to dynamic heterogeneity of the three different pairs of polypeptide chains and several external factors that affect fibrinogen concentration; including gender, age, body mass index, physical exercise, smoking, stress and alcohol consumption [14].
Variability in fibrinogen concentration between laboratories is much higher because of the major effect of differences in methods and in the composition of reagents. These factors can be specific to different areas of the country; further complicated by the lack of an international fibrinogen standard [41]. The unavoidable variability associated with coagulation assays, makes the use of reliable reference materials and validation of fibrinogen reference intervals, specific to the local area or hospital imperative (Lewis, Bain and Bates, 2006).
To ensure quality of practice, and good patient management: UKAS requirement ensures that all reference intervals must be verified and quote their source (UKAS, 2015). It was discovered that only one reference interval is quoted for PT-Fib and Clauss assays at IH, which is considered a bad practice. Also, due to lack of historic validation data and data source information for the coagulation screen reference intervals, Ipswich haematology department needed to validate their fibrinogen reference interval.
Aims and Objectives
This study aims to review the validity of the current reference interval; and investigate the significance of fibrinogen concentration assessed by a combination of Clauss and PT-derived methods for screening for dysfibrinogenemia at Ipswich Hospital. The screening efficiency of fibrinogen PT-derived/Clauss on dysfibrinogenemia was analysed to determine the most reliable method for general use in clinical laboratories.
First, a validation study (pilot study of 20 samples) of the coagulation screen reference intervals will be attempted using 3 months retrospective patient clotting screen data. The pilot study will attempt to verify the currently used quoted reference interval (2.0- 4.5 g/L) for the coagulation screen; fibrinogen assays (PT-derived fibrinogen and Clauss assay methods).
Secondly, if pilot study failed to validate the fibrinogen reference interval, then a larger study would commence. The main study will establish a non-parametric reference interval for both methods. The non-parametric range will be used to research for a published reference interval similar to it. The latter will be validated.
The objectives were to compare the two different methods of fibrinogen assay statistically. Analysing the pilot study of 20 samples and providing evidence from a larger (main) study of 200 patients to identify whether there is a statistically significant difference between the PT-derived and Clauss method.
This study will also address cost implications of using of using the Clauss assay in comparison to the PT-derived fibrinogen method.
This study was conducted at the Ipswich NHS Trust Hospital Haematology Department in the UK.
2.1. Patient selection
A total of two hundred patients were entered into the study.
2.1.1. Pilot study
Twenty (n = 20) random normal patients were selected from 3 months of past patients clotting screen data on the laboratory information management system. Normal patients were selected by excluding any patients on anticoagulants or who had liver disease.
2.1.2. Main study
To establish the non-parametric reference intervals, 120 healthy normal patients’ blood samples were selected and analysed excluding factors that can cause deranged or high fibrinogen values. Normal patients were selected with no previous history of; disseminated intravascular coagulation, liver disease, congenital hyperfibrinogenemia, acute phase reaction (with sepsis, severe infection, myocardial infarction, severe trauma, chronic jaundice); or patients receiving unfractionated heparin therapy, thrombolytic therapy, or oral anticoagulants (OAC, INR > 2.5).
Samples were also analysed from patients with renal or liver dysfunction (n = 20), critically ill patients (n = 20) and patients receiving oral anticoagulant treatment (n = 20). These patients had previous laboratory results that were consistent with a diagnosis of dysfibrinogenemia.
2.2. Specimen preparation
All blood samples were collected into 3 mL sodium citrate tubes. Plasma was prepared by centrifugation at room temperature, at 4000 RPM for 5 min, to ensure platelet separation from blood cells.
2.3. Analysis of plasma specimens
Samples were subjected to analyses by both the PT-derived method and Clauss fibrinogen assay on the same automatic coagulation analysers; ACL-TOP 750 (Instrumentation Laboratory Company, 2017) (Davis et al, 1969). The quantitative determination of fibrinogen by the Clauss methods was performed using Q.F.A Thrombin (Bovine) reagent (Appendix A & Figure 4). (HemoslL Instrumentation Laboratory, 2017).
The determination of fibrinogen with the PT-derived method was conducted using a high sensitivity thromboplastin reagent based on recombinant human tissue factor (RTF) (Appendix B & Figure 4) (HemoslL Instrumentation Laboratory, 2017). The quality control normal range was established by the manufacturer’s specifications and reagents were used in accordance with the manufacturers’ instructions (HemoslL Instrumentation Laboratory, 2017).
The CLauss and PT-derived methods are both coagulable protein methods carried out on the ACL-TOP 750 analyser (Coagulometer) at the Ipswich Hospital.
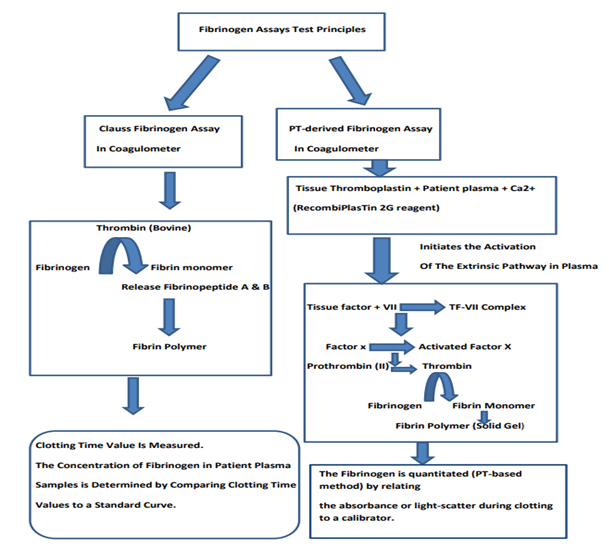
Clauss assay measures fibrinogen in plasma using thrombin, an enzyme that converts fibrinogen to fibrin upon addition. This is done in two steps: First, thrombin mediates proteolysis of fibrinopeptides A and B from fibrinogen, resulting in the formation of fibrinogen is fibrin monomer. Secondly, fibrin monomers polymerize to form fibrin polymer. The formation of the fibrin polymer is recognized in the laboratory as the clotting time end point of the reaction which is measured. The log of the clotting time value is inversely proportional to the log of the fibrinogen concentration. A fibrinogen reference curve is plotted from the clotting time results of the known concentration of fibrinogen having different fibrinogen values. The concentration of fibrinogen in patient plasma samples is determined by comparing clotting time values to the reference curve (HemosIL™, 2008).
The PT is determined by optical density change for a range of plasma dilutions with known fibrinogen levels. In the PT test, the addition of the tissue thromboplastin (RecombiPlasTin 2G reagent) to the patient plasma in the presence of calcium ions initiates the activation of the extrinsic pathway. This results ultimately in the conversion of fibrinogen to fibrin, with formation of a solid gel. The optical change for each different fibrinogen concentration is plotted as a calibration curve. The Fibrinogen is quantitated/derived (PT-based method) by comparing the change in optical density or light-scatter during clotting to the calibration curve (HemosIL®, 2017).
2.4. Statistical/Data analysis
The relationship between two variables were analysed using the Pearson correlation analysis. Paired data were analysed using the non-parametric Wilcoxon test on Analyse-It for Microsoft Excel (Version 4.51), and probability (P) <0>
The published reference interval was verified by examining the first 20 of 120 normal tested subjects’ results. The published reference interval was validated if no more than 2 of 20 (≤10%) tested subjects’ values falls outside the published reported intervals. If 3 or more test results fall outside the published limits, the next 20 reference specimens should be obtained, and compared against the published reference interval. If no more than 2 of these values fall outside the published limits the reference interval may be considered acceptable for use in the laboratory. If less than 90% of the second data cohort falls within the published interval, the reference limits should be not be accepted for use (Clinical and Laboratory Standards Institute, 2018; 22].
3.1. Pilot study
Twenty random “normal” samples were compared with the reference interval currently used at the Ipswich Hospital (IH) laboratory (2.0 – 4.5 g/L). The mean value determined by the Clauss assay was 4.17 g/l, with a range of 1.93 – 8.41 g/L, and PT-Fib assay was 5.84 g/L, with a range of 2.92 – 10.45 g/L (Table 1).
The median fibrinogen determined by the PT-derived fibrinogen method (5.21 g/L) was higher than that of the Clauss assay (3.77 g/L) (Table 1). PT-derived assay and Clauss assay values outside the reference interval were 14/20 and 7/20, respectively (Figure 5).
Thirty percent (30%) of PT-derived method results were within reference interval and 65% of Clauss method results were within the reference interval (Table 1).
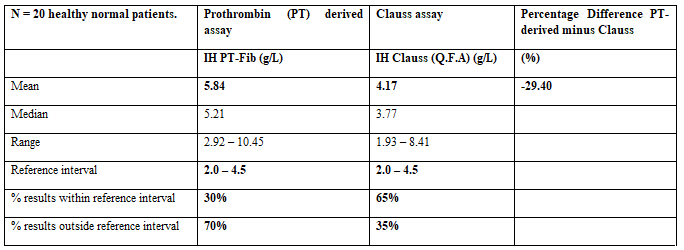
Shown is the percentage difference between PT-derived and Clauss results and their means, medians and range compared to the reference interval (including the percentage of results within and outside the current reference interval. Note: This was the pilot study.
A marked relationship was found when comparing the two methods.
Figure 5 shows that both methods follow the same trend, although, the PT-derived method produced a much higher levels of fibrinogen. Fibrinogen analysed by the PT-derived method correlates positively with Clauss fibrinogen levels, r2 = 0.9684 (Figure 6), but on average, Clauss fibrinogen is 29.4% lower than derived fibrinogen (Table 1).
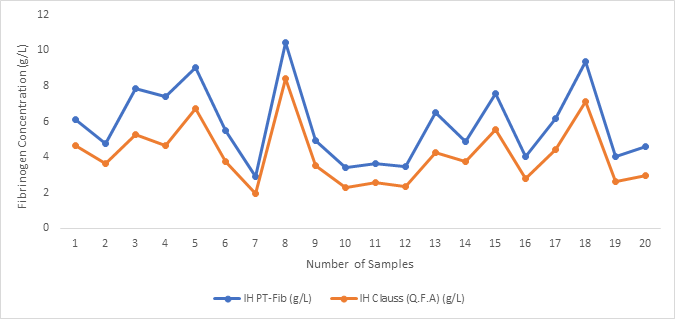
The X-axis plots the number of patient samples and the Y-axis plots the fibrinogen concentrations (assay result values) (g/L). Fibrinogen concentrations are shown in blue: IH PT-Fib (Ipswich Hospital PT-derived fibrinogen); and orange: IH Clauss (Q.F.A) (Ipswich Hospital Clauss Assay). Note that both the Clauss and PT-derived fibrinogen followed the same pattern, but overall PT-Fib levels are higher than Clauss.
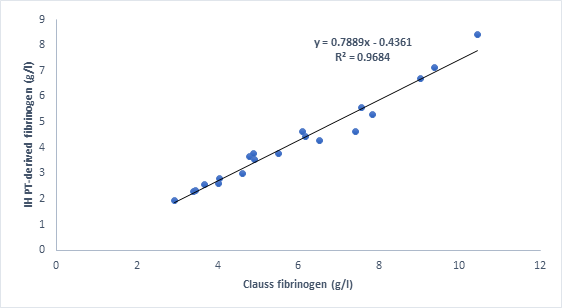
The X-axis plots the Clauss fibrinogen concentrations and the Y-axis plots the PT-derived fibrinogen concentrations (g/L). Correlation equation: y= 0.7889x – 0.4361 where 0.7889 is the gradient of the line and -0.4361 is the y-intercept (where graph crosses the y-axis) if the trend line was extended (extrapolated). This graph shows a strong positive correlation (r2 = 0.9684) between the Clauss assay and PT-derived fibrinogen.
3.2. Main study – (Establishment of non-parametric reference interval and Verification of researched reference interval)
3.2.1. Establishment of non-parametric reference interval
Results from the pilot study failed to validate the reference interval because only 30% of PT-derived and 65% of Clauss assay results were within the current reference interval. The significant positive bias (29.4%) of the PT-derrived fibrinogen assay suggests the; PT-derived assay is not an equivalent test for fibrinogen and should be discarded alongside the invalidated reference interval 2.0 – 4.5 g/L (Clinical and Laboratory Standards Institutes, 2018), although significant relationships between both methods was established. A larger study was performed to resolve this; clinical review of the two fibrinogen assays was performed and a new non-parametric reference interval was determined to compare to a published fibrinogen reference interval (Table 2). A further validation study was then performed to check that the new reference interval was consistent with current patient data (Table 3).
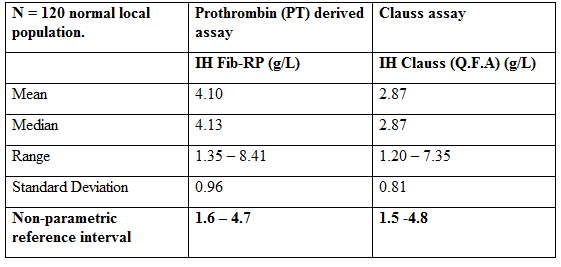
The mean, median, range and their associated standard deviation were calculated to establish the non-parametric reference interval for the two fibrinogen assay methods; PT-derived fibrinogen and Clauss assay (Clinical and Laboratory Standards Institutes, 2018).
The mean and median fibrinogen determined by the PT-derived fibrinogen method (4.10 & 4.13 g/L respectively) was higher than that of the Clauss assay (2.87 & 2.87 respectively g/L) (Table 2).
A literature review (text-book, journal and NHS hospitals guidelines) was performed to find a published fibrinogen reference interval that is most similar to the non-parametric reference interval reported in Table 2. The fibrinogen reference interval (1.5 – 4.5 g/L) was chosen (Spiess et al., 2018; Kamath and Lip, 2003; Cddft.nhs.uk, 2019; Gloucestershire Hospitals NHS Foundation Trust, 2019; Royalwolverhampton.nhs.uk, 2019). In order to use this range in the laboratory it has to be validated. Verification was done using Clinical and Laboratory Standards Institute, (2018) method (Table 3). The published reference interval is verified by testing the confidence limits of the first 20 of 120 normal tested subjects’ values. The published reference interval is validated if no more than 2 of 20 (10%) tested subjects’ values falls outside the published reported intervals.
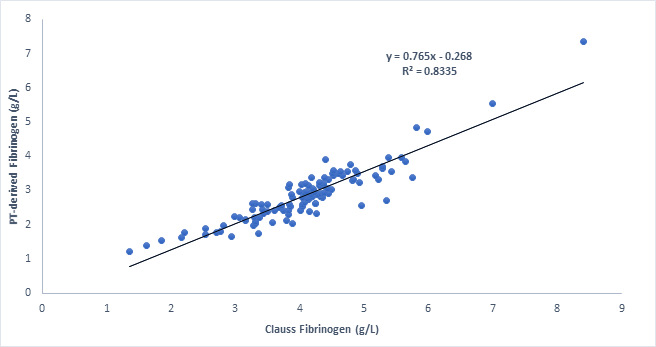
The X-axis plots the Clauss fibrinogen concentrations and the Y-axis plots the PT-derived fibrinogen concentrations (g/L). Correlation equation: y= 0.765x – 0.268 where 0.765 is the gradient of the line and -0.268 is the y-intercept (where graph crosses the y-axis) if the trend line was extended (extrapolated). This graph shows a strong positive correlation (r2 = 0.8335) between the Clauss assay and PT-derived fibrinogen. Overall, as the PT-derived fibrinogen increase, the Clauss assay also increases, but PT-derived fibrinogen levels remain higher than Clauss assay.
3.2.2. Verification of researched published fibrinogen reference interval
In table 3, 70% of PT-derived and 95% of Clauss fibrinogen results were within the reference interval 1.5 – 4.5 g/L. Verification of the published reference interval failed as >10% of the PT-derived results were outside the reference interval of 1.5 - 4.5g/L. However, the reference interval was verified for the Clauss assay as > 90% of the Clauss subject results were within the falls within the reference interval data. Comparison of the two methods shows that PT-derived results are on average higher by 1.43 (38.14%) compared to those of the Clauss assay.
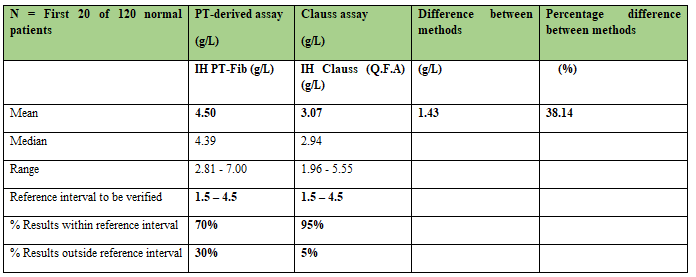
This table shows the difference between methods, percentage (%) difference between the methods. The mean and median results were calculated and % results within and outside published reference interval was deduced by counting values outside the published reference interval to be verified (1.5 – 4.5g/L).
The mean and median fibrinogen determined by the PT-derived fibrinogen method (4.50 & 4.39 g/L respectively) was higher than that of the Clauss assay (3.07 & 2.94 g/L respectively).
3.3 Diseased patients
The influence of clinical group on the relationship between Clauss and PT-derived fibrinogen assay results was evaluated. Results are shown for normal patients, patients with renal or liver dysfunction, critically-ill patients and patients receiving oral anticoagulant treatment (OAC). This was found to be dependent on patient’s clinical group (Table 4 and Figure 8 & 9).
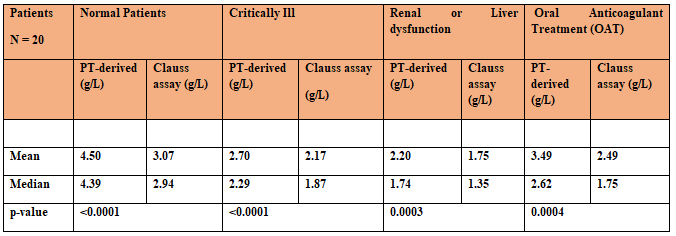
Samples were analysed from normal subjects (n=20); patients receiving oral anticoagulants treatment (n=20); critically-ill patients (n=20) and patients with renal or liver dysfunction (n=20). PT-derived and Clauss assayed was carried out on ACL-TOP analyser following manufacturer instruction (HemoslL Instrumentation Laboratory, 2017). Paired data were analysed using the non-parametric Wilcoxon test on Analyse-It for Microsoft Excel (Version 4.51), and a p-value of < 0>
Statistical observation from Table 4 (i.e mean and p-values < 0 xss=removed xss=removed xss=removed xss=removed xss=removed xss=removed>
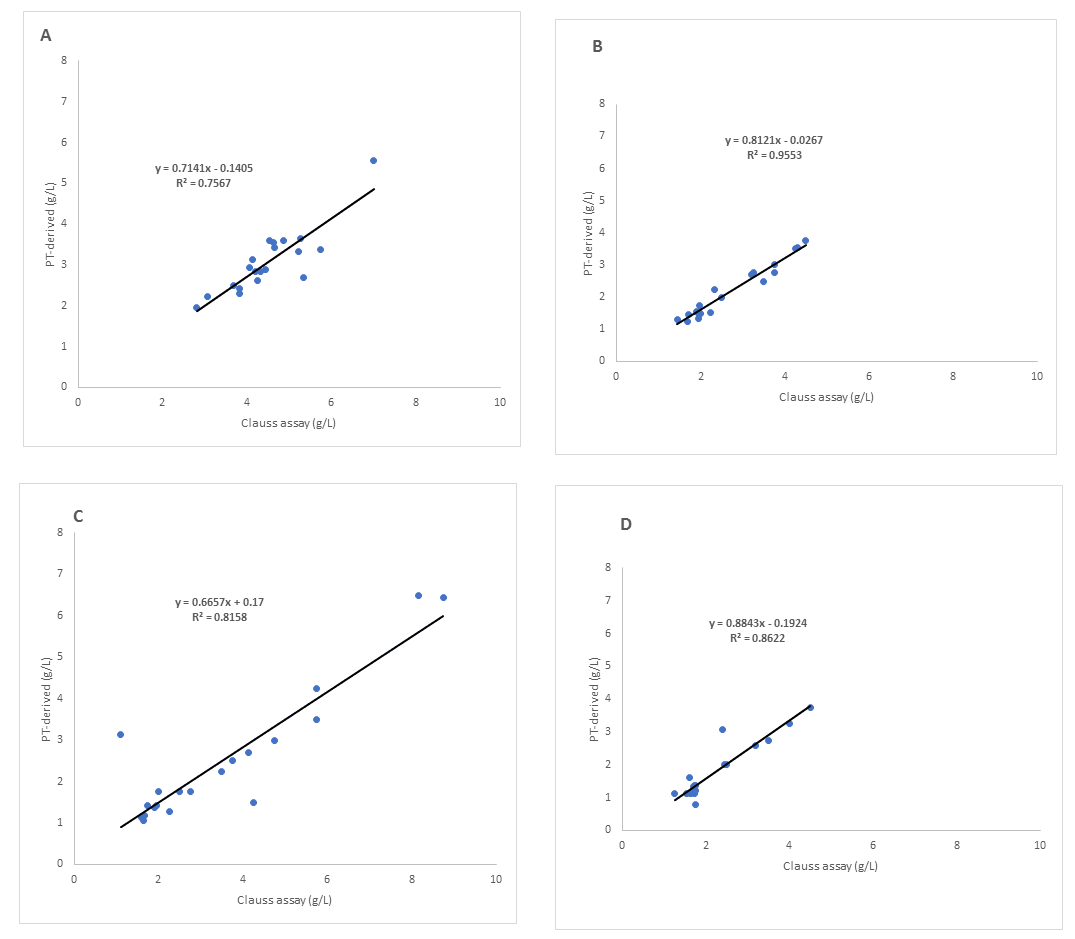
The X-axis plots the Clauss fibrinogen concentrations and the Y-axis plots the PT-derived fibrinogen concentrations (g/L). Samples were analysed from normal subjects (n=20) with r= 0.75, slope = 0.71 and intercept = 0.14; patients receiving oral anticoagulants treatment (n=20) with r= 0.81, slope = 0.0.66 and intercept = 0.17; critically ill patients (n=20) with r= 0.95, slope = 0.81 and intercept = 0.026; and patients with renal or liver dysfunction (n=20) with r= 0.86, slope = 0.88 and intercept = 0.19. PT-derived and Clauss assayed following manufacturer instruction (HemoslL Instrumentation Laboratory, 2017). Also, the graphs show good correlation between the Clauss assay and PT-derived fibrinogen method, although, there is some variation along the line of regression depending on the clinical group.
A good correlation was obtained between Clauss and PT-derived values, although there was a high degree of scatter around regression line, particularly in A and C (Figure 8). Variations in values were particularly obvious in Figure 8. Fibrinogen levels for PT-Fib and Clauss assays followed the same pattern in normal patients and critically-ill patents, although PT-Fib values remains higher throughout (Figure 9). One patient receiving OAT (No. 1 Clauss 3.14 vs PT-Fib 1.10) and one patient with renal or liver dysfunction(No. 20 Clauss 3.06 vs PT-Fib 2.40) had results where Clauss fibrinogen concentrations were higher than PT-Fib (Figure 9).
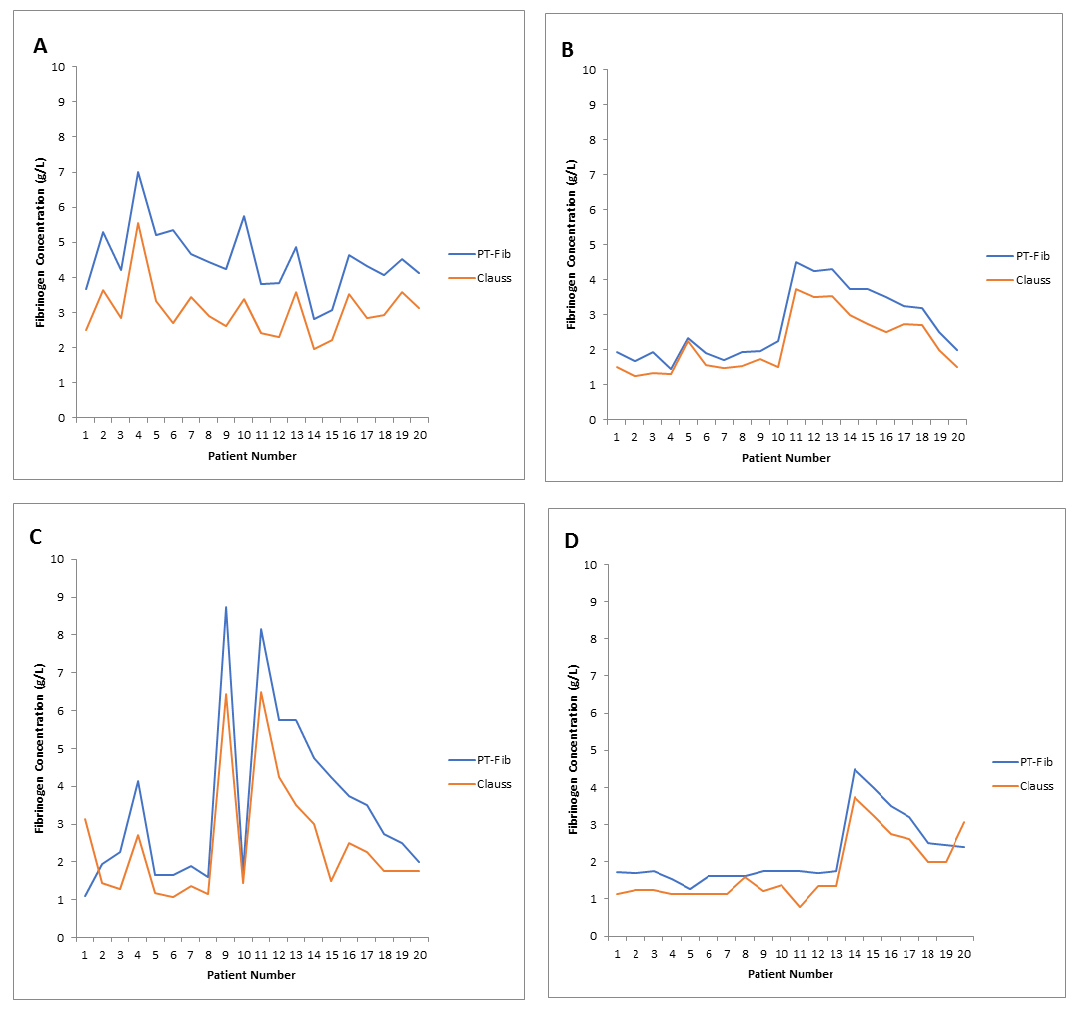
The X-axis plots the number of patient samples and the Y-axis plots the fibrinogen concentrations (assay result values) (g/L). Fibrinogen concentrations are shown in blue: IH PT-Fib (Ipswich Hospital PT-derived fibrinogen); and orange: IH Clauss (Q.F.A) (Ipswich Hospital Clauss Assay). A = normal patients, B = Critically-ill, C = Oral anticoagulant treatment (OAT) and D = Renal or liver dysfunction. Samples were analysed from normal subjects (n=20); patients receiving oral anticoagulants treatment (n=20); critically-ill patients (n=20); and patients with renal or liver dysfunction (n=20). PT-derived and Clauss assayed following manufacturer instruction (HemoslL Instrumentation Laboratory, 2017). The Fibrinogen concentrations are compared to the reference interval 2.0 – 4.5 g/L. Overall, Clauss assay and PT-derived fibrinogen results followed the same pattern, although, PT-Fib values were higher than Clauss assay values. There is some variation in the fibrinogen concentration range depending on the clinical group.
There is some variation in the fibrinogen concentration range depending on the clinical group. According to PT-Fib and Clauss method in table 4 (mean values), figure 8 & 9; fibrinogen concentration was significantly lower in patients with clinical disease than in normal patients.
3.4. Cost analysis of replacing PT-derived with Clauss as the default fibrinogen assay
Table 5 shows the total Coagulation screen (CS) test requests received per year at the IH (61,541) and their location (2017/2018). General practice (GP) requests accounted for 14% of all requests. The Accident and Emergency department had the highest number of request within the hospital (41%). A fibrinogen assay is an important component of the CS test offered by the Coagulation Department at the IH. PT-Fib is the default fibrinogen method but if the fibrinogen result is <2g>
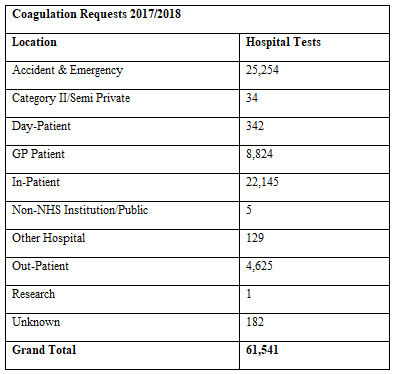
At the Ipswich Hospital, fibrinogen assay is an important component of the clotting screen test offered by the Coagulation Department. A total of 61,541 clotting screens (CS) were processed by the Coagulation Department at Ipswich Hospital last year (1st October 2017 – 29th September 2018). General practice (GP) requests accounted for 14% (hospital requests 86%) of all CS requests. Also showing the amount of CS requests received from sub-department within the hospital. Accident and Emergency department had the highest number of requests compared to other areas within the hospital.
3.5. Fibrinogen Reagent Cost Breakdown
3.5.1. Current Cost
The PT-derived fibrinogen is effectively a free test as the result is derived from another component of the coagulation screen, the PT value. Clauss fibrinogen by contrast requires a QFA Thrombin reagent. It is estimated that only around 5.1% of patients (3,158 of 61,541 CS tests last year) had QFA fibrinogen assay added (Table 6). Performing a Clauss assay on all CS requests would therefore cause a large increase in workload (94.9%) in Clauss assay testing and therefore an increase in reagent costs for the Haematology Department.
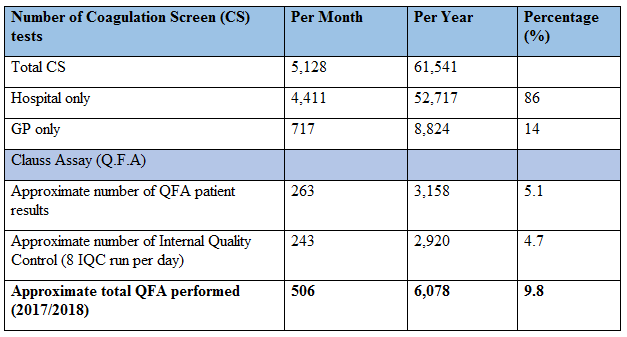
The PT-derived fibrinogen concentrations are derived from PT results. This is an effective free test. In contrast, Clauss fibrinogen requires a QFA Thrombin reagent. Most fibrinogen results are likely to be greater than 2 g/L (the value below which a Clauss fibrinogen is reflexed). It was estimated that a total of 506 Clauss assays (QFA) were performed each month (6,078 per year) of which 3,158 (5.1%) are Clauss assay (QFA) patient results. 2,920 are Internal Quality Control (IQC) results. This was deduced from the total CS tests performed at the IH in the year 2017/2018. Also showing percentage of the tests performed. Note: Clauss IQC are performed eight times per day.
In the year 2017/2018, approximately 9.8% of the total number of CS tests carried out was Clauss assay fibrinogen (QFA). Therefore, the cost of performing Clauss fibrinogen (QFA) for that year was £122 per month (£1,468 per year) using the current 2 mL vial of QFA reagent (Table 7).
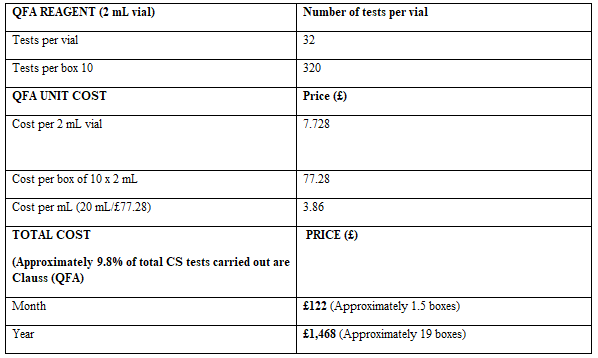
The total cost of performing Clauss fibrinogen assays in 2017/18 was £122 per month (£1,468 per year) using the current 2ml vial of QFA reagent. The total cost per month was calculated by dividing total QFA performed (506 per month or/and 6,078 per year) by tests per 10 boxes (320) multiplied by £77.28 (cost per box of 10 x 2 mL).
3.6. Predicted cost for default Clauss (QFA) fibrinogen
If the study determines that the PT-derived method should be discarded it is predicted the total cost of performing Clauss assay fibrinogen on all CS tests is £902 per month or £12,293 per year. This represents an increase of £10,825 per year in reagent costs as PT-Fib is essentially a free test derived from the PT result. In order to maintain NHS resources, it was suggested by one of the Haematology Consultants to analyse the cost of performing Clauss (QFA) fibrinogen on both hospital-based and GP-based patients and compare this to the costs of only hospital-based patients (which is £884 per month, £10,609 per year) (Table 8). This would mean a reduction in costs of £1,684 per year.
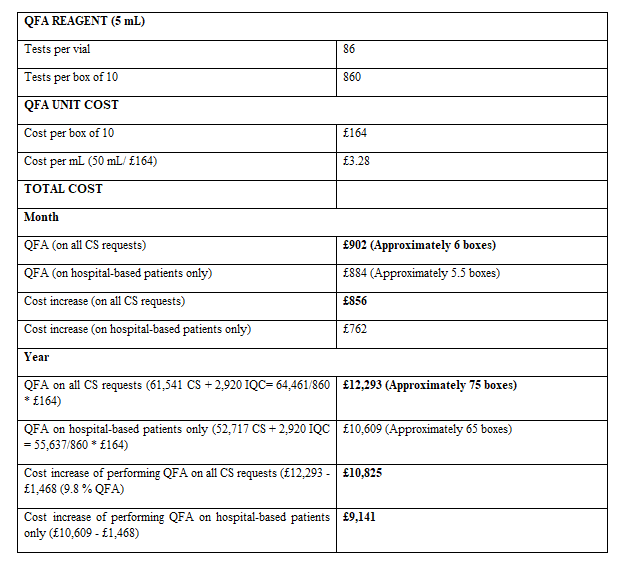
The predicted cost of replacing the current default fibrinogen test (PT-derived) with QFA fibrinogen (and therefore performing QFA fibrinogen on all CS requests) is £902 per month (£12,293 per year); This was calculated by adding the total number of all CS performed (61,541) from Tables 5 & 6 with the estimated number of IQC (2,920), divided by the tests per vial of 5 mL QFA reagent (860), and multiplied by the cost per 10 boxes (£164). The reduction in this cost for moving to only performing QFA fibrinogen on hospital-based patients is also shown (£884 per month, £10,609 per year); This was calculated by adding the total number of CS performed in hospital only (52,717) from table 5&6 with estimated number of IQC (2,920) divided by test per vial of 5ml QFA reagent (860) multiplied by £164.
To calculate cost increase of performing QFA on all CS, £12,293 (QFA on all CS) - £1,468 (9.8 % QFA performed per year 2017/18) and; Cost increase of performing QFA on hospital only, £10,609 (QFA on hospital only) - £1,468(9.8 % QFA performed per year2027/18). Note: 5 mL vials of QFA reagent are less expensive per mL than the current 2 mL vials (£3.28 vs £3.86 respectively) and have less wastage.
4.1. Comparison of the fibrinogen Clauss assay and the fibrinogen PT-derived method
While several studies have compared the PT-derived method with the Clauss assay, as well as the variability of fibrinogen assay results between various laboratories, only a few of these studies included patients with coagulation disorders or patients receiving anticoagulant therapy, as most studies were conducted on normal healthy populations. This study is one of the few to compare the performance of Clauss and PT-derived fibrinogen assays on a larger group of patients with dysfibrinogenaemia. As supported by this study was able to consistently demonstrate that fibrinogen levels were significantly overestimated by the PT-derived method regardless of their clinical group [31]. However, in the study, the effect of different instrumentation and reagents on Clauss assay and PT-derived fibrinogen values were also analysed in 27 patients with dysfibrinogenemia and found that, irrespective of what reagents or instruments they utilized, Clauss method produce lower fibrinogen concentrations than PT-Fib. Also reinforced by Chitolie et al., (1994); there were statistically significant differences between the PT-Fib and Clauss methods regardless of the same standard material used or clinical group; this may be a result of methodology.
Similar results were reported by study, on a cohort that included normal subjects (n=20), patients with renal/liver dysfunction (n=25), critically-ill patients (n=25) [23], patients receiving OAC (n=50), and patients with a haemoglobinopathy (n=127). All patients were tested with both the PT-derived and the Clauss method. The results demonstrated that PT-derived measurements were significantly higher than the Clauss values: The measurement of fibrinogen by the functional Clauss method correlated with results of PT-derived fibrinogen, but the relationship between methods wass dependent on the clinical group. In this study, the variation was greater in patients receiving oral anticoagulants with a significant difference between methods (p = 0.0004), and in patients with renal/liver dysfunction with a significant difference between methods (p = 0.0003), compared to the variation seen in healthy patients (p <0>
Overall, fibrinogen concentration was significantly lower in patients with dysfibrinogenemia than in normal control. Even though fibrinogen determination in a healthy population was reliable and accurate with each method, there were few patients with low fibrinogen concentrations (< 2> 4.5 g/L) in some of the healthy patients. This may be as a result of high vitamin-K levels from their diet improving haemostasis. Fibrinogen is an acute phase reactant protein produced in response to both chronic and acute inflammatory processes. This feature is particularly significant in the groups of patients studied, in whom the heterogeneity of plasma fibrinogen levels is inherently dynamic; contributing to the discrepancies that are observed between the different fibrinogen assays, providing contrast or even conflicting information on clot ability in different individuals [33]. This was seen in case control study individuals with previous myocardial infarction [27].
In this study, the PT-derived method determined that the fibrinogen levels were within the reference interval for most patients with hypo-, a- and dys-fibrinogenaemia; whereas the Clauss assay determined that the fibrinogen levels were lower. This was also the case in a study on a cohort that included 20 healthy patients and 38 patients with various diagnoses [9]; all tested with both the PT-derived and Clauss method. Low fibrinogen concentrations are diagnosed more urgently because insufficient fibrinogen can dysregulate the clotting cascade, thereby causing excessive bleeding or thrombosis due to an increase in coagulation activity. The PT-derived fibrinogen in patients on OAT could have suffered from a systematic error due to an increased fibrin gel turbidity caused by slower rate of fibrinogen cleavage. In case of heparin contamination; heparinase protamine can be added to plasma to neutralize heparin’s effect [9, Cunningham et al., 2002). In critically-ill patients, there is the possibility of altered coagulation parameters; such as thrombocytopenia (platelet counts below 100 x109 /L), which indicates ongoing coagulation activation. This can contribute to microvascular failure and organ dysfunction, hence prolonged PT and/or aPTT and elevated fibrin split products and reduced levels of coagulation inhibitors, such as antithrombin and protein c (Levi and Opal, 2006).
4.1.1. Faults in or factors affecting PT-derived method of fibrinogen concentration measurement
The PT-derived fibrinogen technique uses the change in light scatter or optical density before and after clot formation during prothrombin time reaction to determine PT-derived fibrinogen, compared with standard readings of known fibrinogen concentrations and extrapolation of the fibrinogen levels [41]. This method is rapid, economical and simple, but also has some limitations: Haemolysis, jaundice, lipaemia and other factors can interfere with transparency, affecting results produced; to varying degrees, different thromboplastin reagents affects basal light scatter on analysers, resulting in different results (Llamas et al., 2004). The British Society for Haematology (BSH) guidelines do not recommend the PT-derived method due to overestimation of fibrinogen concentrations because of the indirect measurement of fibrinogen levels from PT. These causes wide variability of fibrinogen estimation among laboratories [31, 29].
According to various studies, it is unsafe to use the PT-derived fibrinogen for patient monitoring due to non-uniform variability due to clinical equipment, the reagents used and clinical status [23]. However, when the main focus is to predict an increased risk of vascular complications associated with high plasma fibrinogen concentrations in a research environment, such as risk of thrombotic events in large-scale studies, the PT-derived method may be safely used to determine fibrinogen levels (Heinrich et al., 1994).
4.1.2. Faults in or factors affecting Clauss method of fibrinogen concentration measurement
In contrast, the Clauss method is recommended by the National Committee for Clinical Laboratory Standards as it is best for the estimation of fibrinogen levels among defined patient groups (patients with high or low fibrinogen) [23, 31]. This method was found simpler and more reliable because fibrinogen concentrations are calculated directly from standard curves of diluted standard plasma fibrinogen; hence, one can measure low concentration of fibrinogen. However, it has certain faults: Abnormal coagulation of defective fibrinogen molecules in patients with dysfibrinogenemia can lead to; the presence of fibrinogen degradation products, release of disordered fibrinopeptide A/B or abnormal polymerisation of fibrin and high concentrations of anticoagulants (e.g. heparin) in plasma. Thus, when the Clauss assay is used to determine fibrinogen levels; plasma coagulation time is prolonged, causing reduced fibrinogen concentrations.
4.1.3 Cost of combining the use of Clauss and PT-derived methods for determining fibrinogen concentration
If only Clauss technique is used to diagnose a patient with dysfibrinogenemia, the condition can easily be misdiagnosed as hypofibrinogenemia, whereas if only PT-Fib method is used, fibrinogen concentrations will appear normal or slightly high, which can also result in missed diagnoses. Therefore, both the PT-Fib and Clauss methods should be utilized to determine fibrinogen concentrations when attempting to diagnose dysfibrinogenemia. This will increase the cost of adding Clauss fibrinogen on all coagulation screens at the Ipswich hospital, as PT-derived fibrinogen is a free test derived from PT. The Ipswich Hospital Haematology Department performed 61,541 CS tests in the year 2017/2018. All the CS requests included PT-Fib, but only 5.1% of the CS requests had Clauss fibrinogen assayed (including IQC). To remove PT-Fib and replace it with the Clauss assay for all CS requests would cost £12,293 per year. This represents an increase of £10,825 per year in reagent costs as PT-Fib is a free test derived from the PT result. If the Clauss assay was performed on hospital patients only, the cost per year would be £10,609, which would be an increase of £9,141 in reagent costs per year. This provide a saving of £1,684 compared to adding Clauss for all CS requests; but the cons of this means two different fibrinogen reference ranges will be required. Therefore, in future or further studies, a fibrinogen reference range that suits the IH local populations should be established and validated for the PT-derived fibrinogen method.
4.2. Limitations of the study
4.2.1 Limitations of establishing and verifying reference interval
Reference intervals are important for clinical laboratory test interpretation and for making judgment in patient care, but there are difficulties and controversies surrounding the establishment of reference intervals and the verification process. This includes protein heterogeneity and their sensitivity to environmental factors which differs from person to person; such as, in the case of fibrinogen; dynamic heterogeneity of the three different pairs of polypeptide chains, several external factors and variability in methods, reagents and instrumentation used affects fibrinogen concentration measurement; thus, the lack of an international fibrinogen standards. Every clinical laboratory needs to establish and verify fibrinogen reference interval specific to that area healthy population. Due to difficulties and controversies surrounding the establishment of reference intervals and the verification process, most laboratories verify reference intervals published in other study instead of performing a new reference interval study. It was recommended that a minimum of 120 of healthy reference subjects is required to establish a reference interval. This is considered a statistically significant group (Clinical and Laboratory Standards Institute, 2018; 22]. However, healthy is a relative condition lacking a universal definition. Thus defining what is considered healthy became the initial problem of this study especially in hospital patients; In reality there will always be some level of uncertainty with the selection process of a healthy individual, not only because of the definition of health that was selected but also because of the fact that some of the selected subjects may, in fact, have an underlying subclinical disease. Statistically, for better reliability of a reference interval, it is more robust to analyse thousands of measurements that may consist of some unhealthy subjects than 120 measurements that are assumed to be from healthy subjects as it will give a good statistically accuracy and precision of the reference interval.
Obtaining informed consent and recruiting a valid group of reference subjects in today’s environment is costly, time-consuming, and virtually an impossible task for most laboratories; making it even more challenging in establishing a reference interval for different age groups (e.g. paediatric patients and geriatric patients). In light of these difficulties, this study elects not to establish its own fibrinogen reference interval, but rather determined a non-parametric reference interval (using 120 healthy patients) to verify the reference interval that has already been reported by the manufacturer, established by another laboratory or research study. The principle here is the assumption that the laboratory analytics system is calibrated and produced equivalent results as the method that was originally used in the published reference interval. However, this may not be true as the details of the reference study for instance; its design, the inclusion and exclusion criteria used for selecting the healthy subjects, pre-analytic sources of variation, etc, may be deficient [22].
4.2.2. Limitations of fibrinogen analysis
The aim of the study was to determine if the PT-derived/Clauss method produces reliable results within the reference interval 2.0 – 4.5 g/L and if this method correlates.
The fibrinogen assays tested have not required a variety of methods, reagents and coagulation analysers, thus, their effect on fibrinogen concentrations not known. Moreover, patient samples were not requested/retested in lower dilutions to get more exact results; this could have revealed the effect of different dilution on results obtained or on the correlation coefficient between the two assays.
For the same aim stated above, no further measurements with assays known to have high reproducibility, such as the immunological assays method for the fibrinogen antigen or determination of the clottable protein was added. Enzyme immunoassays are the current method that gives better prediction of fibrinogen than the Clauss assay [29]. In order to not miss functional defects of the fibrinogen molecule, fibrinogen should be determined by both PT-derived/Clauss in addition with an immunological assay. This is because the PT-derived/Clauss fibrinogen levels and the results of the immunoassay may reflect the true accuracy and precision of fibrinogen antigen level. Also, this was proven by [31, 29 and 40] study to correlate well both in normal controls and in patients with dysfibrinogenemia.
In conclusion, laboratory examination and the use of reference interval are key to diagnosing heterogeneous and asymptomatic dysfibrinogenemia. Ninety-five percent of the Clauss fibrinogen results were within the established reference interval 1.5 – 4.5 g/L, thus verifying it clinically significant for use in diagnosing dysfibrinogenemia at the IH. Several studies also supported the fact that the Clauss assay is more favourable in comparison to the PT-derived fibrinogen results; however, it has certain shortcomings. To prevent missed diagnoses, performing both PT-derived and Clauss methods on all CS request is the best practice, although it will provide extra cost of £10,825. Therefore, it is necessary to determine fibrinogen reference intervals for both the Clauss and PT-derived methods. Until further study establishes and verify a reference interval for PT-Fib at the IH: The Clauss assay is safe to use in diagnosing patients with dysfibrinogenemia, as it gives more adequate precision in patients with high and low fibrinogen when compared to the new published reference interval. This study also answered the potential UKAS non-conformance of performing fibrinogen assay by two methods and only reporting one reference interval (i.e. PT-Fib and Clauss require separate reference intervals).
A – Clauss assay test principle.
This is the criterion used in the Ipswich Hospital Clinical Laboratory for the quantitative determination of fibrinogen, based on the Clauss method, in human citrated plasma on the ACL-TOP 750 Coagulation analyser.
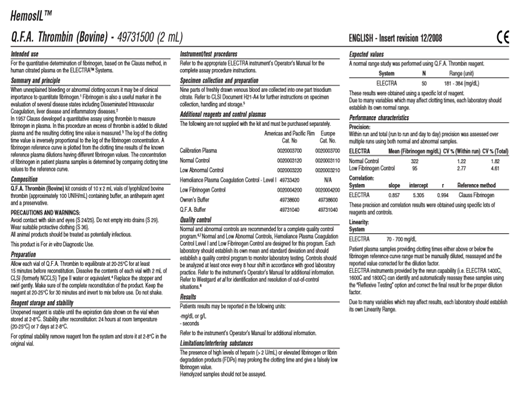
The figure shows the criterion used in the Ipswich Hospital Clinical Laboratory for the quantitative determination of fibrinogen, based on the Clauss fibrinogen method, in human citrated plasma on the ACL-TOP 750 analyser (Instrumentation Laboratory Coagulation System). This procedure involves the use of an excess of thrombin (Bovine) added to diluted plasma; the resulting clotting time value is then measured. The Hemosil manufacturer instruction document gives information about the purpose and principle, composition, precautions and warnings, preparation, and internal quality control regarding Clauss method in human citrated plasma on ACL-TOP analyser, using Q.F.A Thrombin (Bovin) reagent.
B – PT-derived assay test principle.
This is the criterion used in the Ipswich Hospital Clinical Laboratory for the quantitative determination of fibrinogen, based on the PT-derived fibrinogen method, in human citrated plasma on the ACL-TOP 750 analyser (Instrumentation Laboratory Coagulation System).
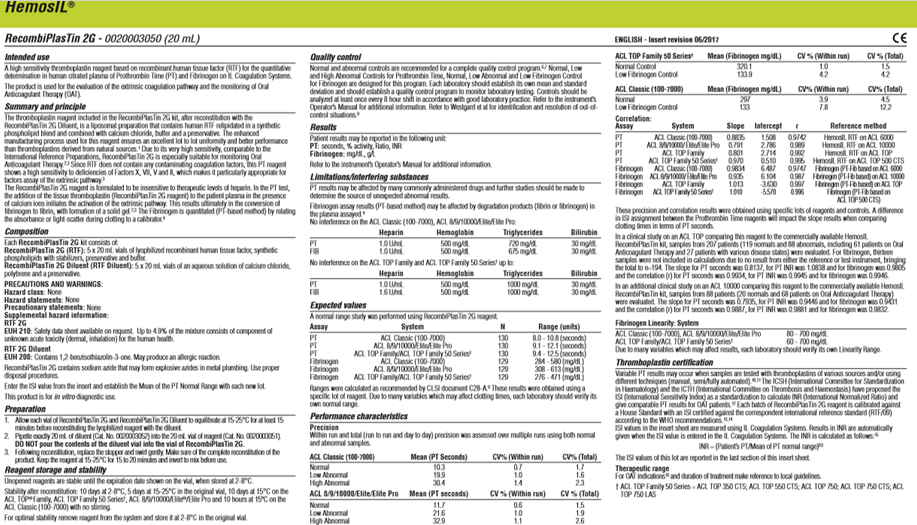
The figure shows the criterion used in the Ipswich Hospital Clinical Laboratory for the quantitative determination of fibrinogen, based on the PT-derived fibrinogen method, in human citrated plasma on the ACL-TOP 750 analyser (Instrumentation Laboratory Coagulation System). The PT-derived fibrinogen is derived from PT. this procedure uses a high sensitivity thromboplastin reagent based on recombinant human tissue factor (RTF) for the quantitative determination of fibrinogen concentrations in human citrated plasma. The product is also used for the evaluation of the extrinsic coagulation pathway and the monitoring of Oral Anticoagulant Therapy (OAT). The Hemosil manufacturer instructions also gives information about precautions and warnings, preparation, and internal quality control regarding the PT-derived method.
All through the writing of this research project I have encountered many difficulties and overcome many delays in order to achieve my goals. This would have been impossible, if not for the help, advice and support from mentors, family and colleagues who have assisted and facilitated in one fashion or another. I would like to acknowledge these people and show my appreciation for their help and great impact.
First and foremost, I would like to thank the almighty God for making this possible and for seeing me through it all.
Secondly, I would like to thank the staff of the Haematology department at the Ipswich NHS Trust Hospital as a whole for their great help and support throughout the phase of data collection, processing and analysing of the blood samples used. In particular, big thank you to Richard Nevin and Joanne King for allowing me to conduct this research, and for finding the time to supervise and give advice throughout both the data collection phase and the write-up of this project despite being intensively busy in the laboratory; Lucia Pacquette and Abraham for her help in retrieving the relevant information from the laboratory database. I extend my sincere thanks for the invaluable suggestion and contributions by Hepburn Sophie. She showed me how to use the Analyse.it software on Excel for my statistical analysis, and for her gracious advice and time during the write-up of this project. Also, massive thank you to a great mentor Darren Andrews graciously gave up his own time to provide me with comments, corrections and suggestions to improve this work.
I wish to warmly and gratefully acknowledge my lovely university supervisor, Dr Louise Beard, for her patience and perseverance, as well as the guidance and support she gave me during the writing-up of my research project.
Finally but definitely not the least, I would like to say an immense thank you to my friends Mo Liasu, Sam Bambam, Emmanuel Ibiyo , Anna Sadia, Sumaiyah Farooqi-perager, and my dearly loving family for their continued relentless support not just for the duration of my research project at the Hospital or write-up but throughout the whole of my degree. My deepest appreciation to my parent, Mr & Mrs Bajo, for their love and support both mentally and financially when they are going through thick and thin. May God bless them all.
Dear Editorial Team, Clinical Medical Reviews and Reports. My experience with the journal was highly positive. The peer-review process was rigorous, constructive, and completed in a timely manner. The reviewers provided valuable comments that helped improve the quality and clarity of our manuscript. The editorial office was professional, responsive, and supportive throughout all stages of the publication process. Communication was clear and efficient, and any questions were addressed promptly. Overall, I found the journal to maintain high scientific standards and an excellent publication workflow. I would be pleased to consider submitting future work to this journal. Best wishes from, Elena Popa.

It was my pleasure to submit my testimonial concerning the Reviewer Board of our Scientific Journal “Brain and Neurological Disorders”. The Reviewers focused on some modifications and their contribution was helpful. The ladies of our Editorial Office were also supported my efforts. It was my honor to have such a co-operation and I am looking forward for more collaboration.

Dear Grace Pierce, Editorial Coordinator of Journal of Clinical Research and Reports, Thank you for the speedy and efficient peer review process. I appreciate the fact that your peer reviewers do not take months to respond like with some other journals. I would also like to thank the editorial office for responding quickly to my questions. It is an excellent journal. I plan to submit more manuscripts in the future. Best wishes from, Robert W. McGee

Dear Grace Pierce, Editorial Coordinator of Journal of Clinical Research and Reports, Working with you and your team on our recent publication in JCRR has been a truly wonderful and enjoyable experience. The responses were prompt, and the reviewers were patient, constructive, and highly professional. One reviewer in particular gave me the feeling that a professor was carefully reading and commenting on my coursework, which was deeply touching. The entire process was straightforward and hassle‑free, with no tedious online forms to complete. I highly recommend this journal. Best wishes from, DR Aibing Rao, Head of R&D

I Appreciate the Opportunity to Share my Experience with the Journal of Clinical Research and Reports. The peer review process was timely and constructive, and the feedback provided helped improve the quality of our manuscript. The editorial office was professional, responsive, and supportive throughout the process, ensuring smooth communication and efficient handling of the submission. Overall, it was a positive experience collaborating with your team.

Dear Mercy Grace, Editorial Coordinator of Obstetrics Gynecology and Reproductive Sciences, We would like to express our gratitude for your help at all stages of publishing and editing the article. The editors of the magazine answer all the necessary questions and help at every stage. We will definitely continue to cooperate and publish other works in the Obstetrics Gynecology and Reproductive Sciences! Best wishes from, Alla Konstantinovna Politova,
