
Research Article | DOI: https://doi.org/10.31579/2578-8868/345
1 Neurology Service, Hospital Central "Dr. Ignacio Morones Prieto".
2 School of Medicine, Autonomous University of San Luis Potosí
*Corresponding Author: Ildefonso Rodriguez-Leyva, Neurology Service, Hospital Central
Citation: Katia Mabiael MC, Rodolfo Manuel RG, Ortiz-A. Arturo, Hector Gerardo HR, Rodriguez-L. Ildefonso, (2024), Clinical and Radiological Characteristics of Tuberculous Meningitis in the Central Hospital "Dr. Ignacio Morones Prieto," a Public Institution in Mexico, J. Neuroscience and Neurological Surgery, 16(4); DOI:10.31579/2578-8868/345
Copyright: ©, 2024, Ildefonso Rodriguez-Leyva. This is an open-access article distributed under the terms of The Creative Commons Attribution License, which permits unrestricted use, distribution, and reproduction in any medium, provided the original author and source are credited
Received: 30 October 2024 | Accepted: 08 November 2024 | Published: 18 November 2024
Keywords: tuberculous meningitis; meningitis; mycobacterium tuberculosis
Background: Tuberculosis (TB) manifests as tuberculous meningitis (TBM) in up to 5% of extrapulmonary cases, causing significant morbidity and mortality. In Mexico, the prevalence is 0.35 cases per 100,000. Diagnosis is challenging due to the gradual onset and low TB levels in CSF. Mortality is around 20%, higher in HIV patients.
Material and Methods: A cross-sectional, retrospective, descriptive study was performed with patients treated at the Central Hospital "Dr. Ignacio Morones Prieto" who were diagnosed with TBM from 2018 to 2023. Patient records that met the following criteria were included: a) age over 18 years, b) any gender, c) confirmed diagnosis of TBM through staining, bacteriological culture, molecular studies, or biopsy, and d) brain imaging study using CT or MRI.
Results: Thirty-three patient files were evaluated. GeneXpert PCR, which was positive (only) in 17 of the cases (51.5%), culture (Lowenstein-Jensen) positive (only) in 6 patients (18.2%), cranial meninges biopsy (only) in 2 of the cases (6.1%) and bacilloscopic study in 1 patient (3.0%). Two positive results (GeneXpert and culture) were obtained in 7 patients (21.2%). There was a statistically significant correlation for mortality in those patients who presented stupor (100%) vs. those who did not present drowsiness only (33.0%) or remained awake (0%) (p<0.001). On the other hand, the statistically significant correlation between the presentation of cerebral edema and mortality was very striking since 93.8% of the patients who did not present edema survived, and 100% of those who presented edema died (p=0.001). Lumbar puncture findings included pleocytosis, hypoglycorrhachia (<30 mg/dL), and elevated protein (0.2 to 5 g/dL). Severe hypoglycorrhachia (<25 mg/dL) was associated with hydrocephalus and altered consciousness.
Conclusions: This study provides a clinical and demographic overview of TBM in San Luis Potosí, Mexico, highlighting the need for more comprehensive data collection and larger sample sizes to better characterize the disease.
Tuberculosis, caused by Mycobacterium tuberculosis, manifests as tuberculous meningitis (TBM) in up to 5% of extrapulmonary cases[1]. The prevalence of TBM varies between 1% and 10%, depending on the country of study[2]. It is a significant cause of morbidity and mortality, with neurological sequelae and complications occurring in up to 50% of patients[1]. In Mexico, the prevalence is 0.35 cases per 100,000 inhabitants, according to a 2017 study conducted in Tijuana—one of the few demographic studies on meningeal tuberculosis in the country. The study concluded that TBM's clinical, imaging, and laboratory characteristics in Mexico are similar to those observed globally[3].
The risk of developing central nervous system (CNS) tuberculosis is higher in children and adults with human immunodeficiency virus (HIV) infection and other causes of immunosuppression, such as chronic steroid use or treatment with tumor necrosis factor-alpha (TNF-α) inhibitors[4].
Following inhalation of M. tuberculosis, an inflammatory reaction occurs, leading to the formation of a granuloma. This structure encapsulates the infected cells, slowing the bacilli replication and resulting in a latent infection. This immune response can progress to active primary tuberculosis in immunosuppressed patients, causing the bacilli to disseminate to other systems through lymphatic and blood routes. Once Mycobacterium tuberculosis enters the central nervous system, the limited innate immunity in this environment permits the bacillus to survive and replicate, resulting in latent tuberculous lesions. Known as Rich foci, these lesions are primarily located beneath the subcortical pia and adjacent to the ventricular system. When these lesions rupture, M. tuberculosis bacilli are released into the subarachnoid space, leading to granulomatous infection of the meninges and subsequent inflammation[5]. In the brain, microglial cells become infected and, along with infiltrating cells, produce inflammatory chemoattractants that damage the blood-brain barrier (BBB). This damage facilitates the penetration of innate immune system cells and specific B and T lymphocytes.[6]
The clinical presentation includes a prodromal period with nonspecific symptoms such as fatigue, malaise, myalgia, and fever. TBM consists of a subacute to a chronic process characterized by headache, fever, vomiting, photophobia, and nuchal rigidity, typically progressing slowly[6,7]. Among the main complications are cranial neuropathies, which occur in 25-50% of patients, primarily affecting cranial nerves VI and III[8]. Inflammatory infiltration in the subarachnoid space or ventricular system disrupts cerebrospinal fluid (CSF) flow, producing hydrocephalus, particularly of the communicating type[9]. Other causes of intracranial hypertension include encephalitis and obliterative vasculitis, which lead to cytotoxic and vasogenic edema[7]. Hyponatremia, due to cerebral salt-wasting or the syndrome of inappropriate antidiuretic hormone secretion (SIADH), is present in 40-50% of cases[10]. Another complication of TB infection in the CNS is the formation of tuberculomas. Tuberculomas may occur with or without TBM, presenting symptoms such as epileptic seizures, focal neurological deficits, or intracranial hypertension[11]. Cerebral infarction occurs in 15-57% of patients with TBM, predominantly affecting deep gray matter structures such as the caudate nucleus, anterior thalamus, genu, and anterior limb of the internal capsule. The mechanism of infarction involves vasculitis with direct inflammatory involvement from the meningitis[12]. Epileptic seizures occur in up to 34% of patients[13]. Other central nervous system manifestations include tuberculous abscesses, tuberculous spondylitis, and intradural spinal tuberculosis[4].
Diagnosing TBM is more challenging compared to other forms of bacterial meningitis. This difficulty arises partly because the symptoms usually develop more gradually than those of classic bacterial meningitis. TB leads to a paucibacillary infection that is hard to detect in the CSF. When detecting M. tuberculosis in CSF is not feasible, a presumptive diagnosis of TBM is often made based on a combination of clinical presentation and CSF findings.[14] Cerebrospinal fluid findings include pleocytosis (50 to 500 cells per microliter, with 50% or more being lymphocytes), increased protein levels (up to 1000 mg/L), and low glucose levels (<40>
Microbiological diagnostic methods include Ziehl-Neelsen staining of cerebrospinal fluid, a rapid and readily available technique, but its sensitivity varies between 10% and 20%. Mycobacterial cultures are currently the gold standard for diagnosis, with a sensitivity of up to 70%, although mycobacterial growth is slow and takes more than two weeks[16]. Detection of M. tuberculosis DNA is possible with molecular biology techniques such as GeneXpert MTB/RIF and GeneXpert MTB/RIF Ultra, which offer similar sensitivity to bacteriological culture but produce results more quickly. However, up to 50% of cases may lack bacteriological confirmation[14,17]. Adenosine deaminase determination has also been used as a marker of the disease, as its levels in cerebrospinal fluid are elevated in patients with the infection. However, false positives are common in patients with HIV infection[17]. Next-generation metagenomic sequencing is a recently developed technique with a sensitivity of 70% for detecting meningeal tuberculosis[18].
The most common radiological findings in tuberculosis meningitis are meningeal enhancement, tuberculomas, and hydrocephalus[19]. More extensive findings correlate with more significant clinical complications and cerebrospinal fluid abnormalities. Approximately 75% of patients present with hydrocephalus, 38% with basal meningeal enhancement, and 15-26% with cerebral infarcts4. The most sensitive feature is basal enhancement on CT or MRI with contrast. Advanced techniques like magnetization transfer imaging are also used. Basal enhancement is more common in HIV patients and advanced disease stages[20]. Hydrocephalus, usually communicating, is linked to basal exudates, tuberculomas, infarcts, and cranial nerve palsies and is the primary cause of intracranial hypertension in these patients[9].
In TBM, strokes are frequent and primarily affect the perforating and cortical branches[21]. It has been reported that up to 75% of cerebral infarctions occur in areas supplied by the lenticulostriate and thalamic-perforating arteries, with a smaller proportion in regions supplied by the lateral lenticulostriate, anterior choroidal, and thalamogeniculate arteries. However, findings vary across different studies, with some reporting different percentages and including other vascular territories, such as the cortical branches[22]. The pathogenesis is related to vasospasm in the early stages and an inflammatory reaction in the lumen of blood vessels, known as tuberculous vasculitis, in the later stages [23,24].
Treatment of tuberculosis involves a two-month intensive phase with isoniazid, rifampicin, ethambutol or streptomycin, and pyrazinamide, followed by a maintenance phase with rifampicin and isoniazid. Regimens last 6 to 9 months, but individualized management is recommended due to similar mortality rates. Intravenous or high-dose rifampicin with fluoroquinolones has not improved outcomes over standard therapy. Management is more complex with drug-resistant TB. For isoniazid resistance, levofloxacin and higher doses of rifampicin are suggested[25]. Second-line drugs include ethionamide, cycloserine, and linezolid[26]. Corticosteroids, like dexamethasone, are recommended to reduce brain and vessel inflammation, intracranial pressure, and mortality risk[27]. A Cochrane meta-analysis found reduced mortality but no impact on turning off neurological deficits[28].
Ventriculoperitoneal shunts and endoscopic ventriculostomies manage complications such as hydrocephalus. Intracranial hypertension may require mannitol or hypertonic solutions. Antiepileptic drugs treat symptomatic epileptic seizures. The treatment of hyponatremia depends on its cause: either a salt-losing brain or SIADH. Despite no therapeutic consensus, antiplatelet drugs are used for cerebral vasculitis and infarcts[29].
Approximately 20% of meningeal tuberculosis patients die, with higher risks in those over 18 and those co-infected with HIV[30].
A cross-sectional, retrospective, descriptive study was performed with patients treated at the Central Hospital "Dr. Ignacio Morones Prieto" who were diagnosed with TBM from 2018 to 2023. The study was approved by the Research Committee (COFEPRIS Registration Number 17 CI 24 028 093) and the Research Ethics Committee of the Central Hospital "Dr. Ignacio Morones Prieto" (Registration Number CONBIOETICA-24-CEI-001-20160427) with Registration Number 45-23.
Patient records that met the following criteria were included: a) age over 18 years, b) any gender, c) confirmed diagnosis of TBM through staining, bacteriological culture, molecular studies, or biopsy, and d) brain imaging study using computed tomography (CT) or magnetic resonance imaging (MRI). Exclusion criteria were: a) records that met the inclusion criteria, b) lack of a confirmatory study of the infection, and c) lack of a brain imaging study.
Statistical analyses were performed using IBM SPSS Statistics V.25 for Mac. The arithmetic mean, median (measures of central tendency), standard deviation, minimum, and maximum (measures of dispersion) were used for quantitative variables. For qualitative variables, relative frequency (percentages) and absolute frequency were used. Chi-square (X2) was used for qualitative variables. The student’s T-test (in cases of normal distribution) or Wilcoxon signed-rank test (in cases of abnormal distribution) was used for quantitative variables. A 95% confidence b) interval was determined, with a p-value less than or equal to 0.05 in two directions for statistically significant values.
The records of CSF samples sent for M. tuberculosis detection were obtained from the Epidemiology area of the hospital, with 147 suspected patients. Subsequently, the results were corroborated, obtaining 38 patients with a positive test for tuberculosis; 5 were discarded because they did not have a clinical record. Of the rest of the patients, 107 had a negative result, and 2 had a diagnosis of tuberculous meningitis due to cerebrospinal fluid findings and clinical correlation; however, they did not have a confirmatory test. Thirty-three patient files were evaluated (see Figure 1). Population characteristics are shown in table 1.
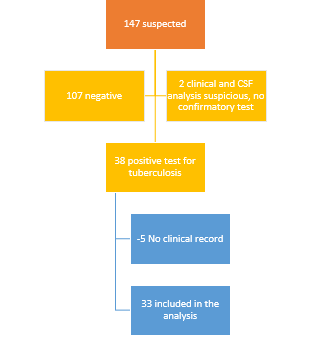
Figure 1: Patient selection
| Table 1. Population characteristics | Total (n = 33) |
Sex Male Female Age group, n (%) 21-30 31-40 41-50 51-60 61-70 71-80 81-90 |
23 (69.7%) 10 (30.3%)
10 (30.3%) 11 (33.3%) 8 (24.2%) 0 3 (9.1%) 0 1 (3.1%) |
The associated comorbidities in order of frequency were as follows: alcoholism 17 (51.5%), smoking 16 (48.5%), drug addiction 8 (24.2%), pulmonary tuberculosis 7 (21.2%), type 2 diabetes mellitus 6 (18.2%) and HIV 11 (33.3%). As for drug use, the most frequently used drugs were, in order of frequency: crystal meth, marijuana, and cocaine (see Table 2).
| Table 2. Associated comorbidities | Total (n = 33) |
Alcoholism Smoking Drug abuse
Pulmonary tuberculosis Diabetes mellitus type 2 HIV | 17 (51.5%) 16 (48.5%) 8 (24.2%)
7 (21.2%) 6 (18.2%) 11 (33.3%) |
Among the clinical manifestations, the frequency corresponded to the following: 21 patients presented headache (63.6%), 17 presented altered state of consciousness (51.5%), of which 15 corresponded to drowsiness (45.5%) and 2 to stupor (6.1%); fever was present in 17 patients (51.5%), nausea or vomiting (or both) in 10 patients (30.3%), epileptic seizures in 10 patients (30.3%).1%); fever was present in 17 patients (51.5%), nausea and vomiting in 10 patients (30.3%), epileptic seizures in 10 patients (30.3%), of which three patients presented focal status epilepticus, focal deficit in 3 patients (9.1%), nuchal rigidity in 2 patients (6.1%). Cranial nerve palsy was present in only one patient (3%), III cranial nerve palsy. General symptoms, such as asthenia, fatigue, and weight loss, were found in 12 patients (36.4%), and delirium was documented in 6 patients (18.1%), of which four were hyperactive (12.1%), and two were hypoactive (6.1%) ( see Table 3).
| Table 3. Clinical manifestations | Total (n = 33) |
Headache Fever Altered state of consciousness Drowsiness Stupor Coma Nausea or vomiting Epileptic seizures Focal deficit Nuchal rigidity Cranial nerve palsies General symptoms Delirium Hyperactive Hypoactive | 21 (63.6%) 17 (51.5%) 17 (51.5%) 15 (45.5%) 2 (6.1%) 0 10 (30.3%) 10 (30.3%) 3 (9.1%) 2 (6.1%) 1 (3%) 12 (36.4%) 6 (18.1%) 4 (12.1%) 2 (6.1%) |
The imaging studies reviewed were computed tomography of the brain, performed in 28 patients. CT was performed in 28 patients (84.8%), and MRI was performed only in 12 patients (36.4%). Of the diagnostic methods required for inclusion in the study, the following were included: GeneXpert PCR, which was positive (only) in 17 of the cases (51.5%), culture (Lowenstein-Jensen) positive (only) in 6 patients (18.2%), cranial meninges biopsy (only) in 2 of the cases (6.1%) and bacilloscopic study in 1 patient (3.0%). Two positive results (GeneXpert and culture) were obtained in 7 patients (21.2%) (Table 4).
| Table 4: Paraclinical studies | Total (n = 33) |
Imaging studies Computed tomography of the brain Magnetic resonance imaging of the brain Microbiological studies GeneXpert Culture Biopsy Bacilloscopy GeneXpert/Culture |
28 (84.8%) 12 (36.4%)
17 (51.5%) 6 (18.2%) 2 (6.1%) 1 (3.3%) 7 (21.2%) |
The findings on imaging studies, in order of frequency, were as follows: tuberculoma or microabscesses in 9 patients (27.3%), hydrocephalus in 8 patients (24.2%), meningeal enhancement in 8 patients (24.2%), vasculitis in 6 patients (18.2%), ischemia in 5 patients (15.2%), and cerebral edema in 1 case (3.0%) (Table 5).
| Table 5. Radiological findings | Total (n = 33) |
Tuberculoma/micro abscess Hydrocephalus Meningeal enhancement Vasculitis Ischemia Cerebral edema | 9 (27.3%) 8 (24.2%) 8 (24.2%) 6 (18.2%) 5 (15.2%) 1 (3.3% |
In the secondary analysis, the Fisher exact Test was applied to establish the correlation between the patient's pre-existing conditions and the presentation of death (see Table 6). Similarly, using the Fisher exact Test (for variables with more than two items, Chi-squared was used), the clinical complications presented by the patients and their association with fatal outcomes were analyzed (See Table 7).
Table 6: Correlation of Pre-existing Conditions and Mortality A 2X2 table with percentages per row is presented. | ||||
FEATURES
|
n | NOT DEATH n (%) | DEATH n (%) |
p |
GENRE Male Woman |
23 10 |
20 (87.0%) 10 (100%) |
3 (13.0%) 0 (0%) |
0.536 |
DM2 NO YES |
27 6 |
24 (88.9%) 6 (100%) |
3 (11.1%) 0 (0%) |
1.000 |
HIV NO YES |
22 11 |
21 (95.5%) 9 (81.%8) |
1 (4.5%) 2 (18.2%) |
0.252 |
Pulmonary Tuberculosis NO YES |
26 7 |
23 (88.5%) 7 (100%) |
3 (11.5%) 0 (0.0%) |
1.00 |
Alcoholism NO YES |
16 17 |
15 (93.8%) 15 (88.2%) |
1 (6.2%) 2 (11.8%) |
1.00 |
Smoking NO YES |
17 16 |
16 (94.1%) 14 (87.5%) |
1 (5.9%) 2 (12.5%) |
0.601 |
Polydrug addictions NO YES |
25 8 |
22 (88.0%) 8 (100%) |
3 (12%) 0 (0%) |
0.560 |
Table 7: Correlation of clinical complications and mortality. A 2X2 table with percentages per row is presented. | |||||
FEATURE
|
n | NOT DEATH n (%) | DEATH n (%) |
p | |
Alterations in awake state NO YES |
16 17 |
16 (100%) 14 (82.4%) |
0 (0%) 3 (17.6%) |
0.227 | |
Nuchal Rigidity NO YES |
31 2 |
29 (93.5%) 1 (50%) |
2 (6.5%) 1 (50%) |
0.176 | |
Focal deficit NO YES |
30 3 |
28 (93.3%) 2 (66.7%) |
2 (6.7%) 1 (33.3%) |
0.256 | |
State of consciousness* Awake Drowsiness Stupor |
16 15 2 |
16 (100%) 14 (93.3%) 0 (0%) |
0 (0%) 1 (33.3%) 2 (100%) |
<0> | |
Delirium* No Delirium Hypoactive Hyperactive |
27 2 4 |
24 (88.9%) 2 (100%) 4 (100%) |
3 (11.1%) 0 (0%) 0 (0%) |
0.693 | |
Epileptic seizures NO YES |
23 10 |
22 (95.7%) 8 (80.0%) |
1 (4.3%) 2 (20%) |
0.212 | |
Hydrocephalus NO YES |
25 8 |
24 (96.0%) 6 (75.0%) |
1 (4.0%) 2 (25.0%) |
0.139 | |
Cerebral Edema NO YES |
32 1 |
30 (93.8%) 0 (0%) |
2 (6.3%) 1 (100%) |
0.091 | |
Tuberculomas NO YES |
24 9 |
23 (95.8%) 7 (77.8%) |
1 (4.2%) 2 (22.2%) |
0.174 | |
Vasculitis NO YES |
27 6 |
25 (92.6%) 5 (83.3%) |
2 (7.4%) 1 (16.7%) |
0.464 | |
Ischemia NO YES |
28 5 |
26 (92.9%) 4 (80.0%) |
2 (7.1%) 1 (20.0%) |
0.400 | |
*Chi-squared was applied due to more than two items.
There was a statistically significant correlation for mortality in those patients who presented stupor (100%) vs. those who did not present drowsiness only (33.0%) or remained awake (0%) (p<0 p=0.001).>
During data collection, it was decided to capture the values of the first lumbar puncture performed on the first day of admission to the emergency room. However, only 27 patients were found to be analyzed in this item. The data collected are shown in Table 8. Because of a lack of information, only 24 cases were counted with protein information and only 25 with glucose levels.
| Table 8. CSF findings | Total (n = 27) (%) |
Leukocytes (range) (mm3 /ml) 10-100 100-300 300-500 >500 Mononuclear (range) (%) 10-50 50-100 Protein (range) (g/dL) 0-100 101-200 201-300 301-400 401-500 >500 Pandy + Glucose (range) (mg/dL) 0-10 11-20 21-30 31-40 41-50 >50 |
15 (55.5%) 9 (33.3%) 2 (5.4%) 1 (2.7%)
4 (14.8%) 23 (85.1%)
2 (7.4%) 7 (25.9%) 8 (29.6%) 2 (7.4%) 1 (2.7%) 4 (5.4%) 3 (11.1%)
3 (11.1%) 5 (18.5%) 11 (40.7%) 3 (11.1%) 1 (2.7%) 4 (5.4%) |
The Kolmogorov-Smirnov test assessed whether the CSF parameter results followed a normal distribution. The test indicated that the absolute leukocyte count (p=0.00), percentage of mononuclear cells (p=0.000), protein levels (p=0.000), and glucose levels (p=0.001) all exhibited a non-normal distribution. Based on this finding, the Mann-Whitney U test for independent samples was then utilized to analyze the association between these CSF parameters and specific clinical complications, including altered wakefulness, nuchal rigidity, focal deficits, epileptic seizures, hydrocephalus, cerebral edema, tuberculomas, vasculitis, and ischemia. Altered wakefulness and the development of hydrocephalus showed a significant correlation with low glucose levels (see Figures 2a and 2b). No significant correlation was found between CSF features and nuchal rigidity, focal deficits, epileptic seizures, cerebral edema, tuberculomas, vasculitis, or ischemia.
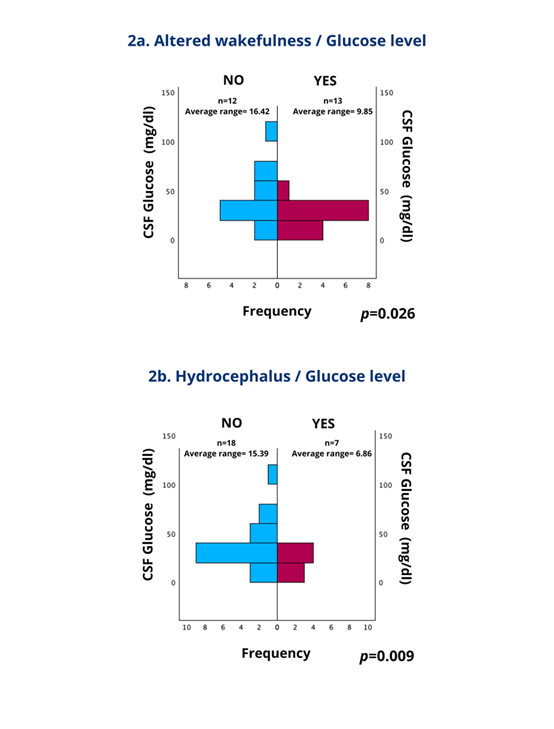
Therefore, taking these results into account, the decision was made to add a univariate analysis with a CSF glucose cutoff point ≤25 mg/dl (such cutoff comes out of the mean glucose associated with hydrocephalus <17> + 1 standard deviation <8>) to analyze its correlation with the different clinical complications, Fisher exact Test was applied, and the results of this are shown in Table 9.
Table 9: Correlation of clinical complications and CSF glucose level ≤25 mg/dl. A 2X2 table with percentages per row is presented. | ||||
FEATURE
|
n | Glucose >25 mg/dl n (%) | Glucose ≤25 mg/dl n (%) |
p |
Altered wakefulness NO YES |
12 13 |
9 (75%) 3 (23.1%) |
3 (25.0%) 10 (76.9%) |
0.017 |
Headache NO YES |
6 19 |
5 (83.3%) 7 (36.8%) |
1 (16.7%) 12 (63.2%) |
0.073 |
Fever NO YES |
11 14 |
8 (72.7%) 4 (28.6%) |
3 (27.3%) 10 (71.4%) |
0.047 |
Nuchal Rigidity NO YES |
23 2 |
12 (52.1%) 0 (0%) |
11 (47.8%) 2 (100%) |
0.480 |
Focal deficit NO YES |
23 2 |
11 (47.8%) 1 (50.0%) |
12 (52.2%) 1 (50.0%) |
1.00 |
State of consciousness* Awake Drowsiness Stupor |
12 11 2 |
9 (75.0%) 2 (18.2%) 1 (50.0%) |
3 (25.0%) 9 (81.8%) 1 (50.5%) |
0.024 |
Delirium* No Delirium Hypoactive Hyperactive |
21 1 3 |
11 (52.4%) 0 (0%) 1 (33.3%) |
10 (47.6%) 1 (100%) 2 (66.7%) |
0.511 |
Epileptic seizures NO YES |
17 8 |
8 (47.1%) 4 (50.0%) |
9 (52.9%) 4 (50%) |
1.000 |
Hydrocephaly NO YES |
18 7 |
12 (66.7%) 0 (0%) |
6 (33.3%) 7 (100%) |
0.005 |
Cerebral Edema NO YES |
24 1 |
12 (50.0%) 0 (0%) |
12(50.0%) 1 (100%) |
1.000 |
Tuberculomas NO SI |
18 7 |
9 (50.0%) 3 (42.9%) |
9 (50.0%) 4 (57.1%) |
1.000 |
Vasculitis NO YES |
19 6 |
11 (57.9%) 5 (16.7%) |
8 (42.1%) 5 (83.3%) |
0.160 |
Ischemia NO YES |
21 4 |
11 (52.4%) 1 (25.0%) |
10 (47.6%) 3 (75.0%) |
0.593 |
*Chi-squared was applied due to more than two items.
TBM represents 5-10% of extrapulmonary tuberculosis cases globally [31], aligning with its rarity but severe prognosis. The study by Garcia-Grimshaw et al. (2019) in Tijuana reported a young demographic, with 63.4% of male cases primarily between 18 and 40 years old [3]. In contrast, our study finds an older mean age, 31 to 47 years, which may reflect regional differences or a variation in risk factors, such as comorbidities.
Our study and other reports found that headache, fever, and altered consciousness were typical symptoms of TBM, reaffirming their central role in TBM presentations [32]. What sets our study apart is the unique finding of a higher prevalence of seizures, which could be an indicator of more advanced or cerebral-complicated cases. This observation aligns with findings suggesting that neurologic sequelae, like seizures, may be prevalent in advanced disease stages. The common comorbidities in our sample, such as alcoholism, type 2 diabetes, and HIV, are also recognized as risk factors that compromise immune response, potentially exacerbating TBM susceptibility [33]. These unique findings provide a deeper understanding of TBM and its clinical implications.
The association of stupor with higher mortality rates found in our research may underscore the role of early mental status changes as a predictive indicator for outcomes in TBM.
Meningeal enhancement and hydrocephalus were radiologically prevalent, consistent with TBM’s classic presentation in imaging [31]. Our finding of cerebral edema as a predictor of mortality aligns with the literature, noting that brain swelling complicates outcomes in TBM due to increased intracranial pressure. Additionally, the high frequency of tuberculomas or microabscesses in our sample suggests a progressive form of TBM that may require aggressive treatment approaches.
Like many others, our study acknowledges the challenges of TBM diagnosis and treatment. GeneXpert, despite its sensitivity challenges, has significantly improved TBM detection rates, particularly in resource-limited settings [31]. Our study's observed mortality rate of 9.1%, notably lower than that of other studies, could reflect differences in early diagnosis, access to care, or treatment protocols [32]. Acknowledging the challenges and the potential for improvement in TBM diagnosis and treatment is crucial for advancing patient care.
Consistent with other studies, cerebrospinal fluid findings in our sample showed pleocytosis, hypoglycorrhachia, and elevated protein levels. Severe hypoglycorrhachia (under 25 mg/dL), associated with hydrocephalus and altered consciousness in our data, highlights the importance of monitoring glucose levels as a marker of disease severity in TBM. Hypoglycorrhachia correlates with poor outcomes, as lower CSF glucose often indicates a more aggressive inflammatory response, which may be linked to increased mortality risks.
Limitations:
Perspectives:
This study collected the most frequent clinical and radiological findings in the Central Hospital "Dr. Ignacio Morones Prieto population," providing a demographic and clinical overview of the epidemiological state in San Luis Potosí, Mexico. The data aim to improve prompt disease identification in our unit and the region. More analytical studies, comprehensive data collection, and larger sample sizes are necessary for better disease characterization.
Dear Editorial Team, Clinical Medical Reviews and Reports. My experience with the journal was highly positive. The peer-review process was rigorous, constructive, and completed in a timely manner. The reviewers provided valuable comments that helped improve the quality and clarity of our manuscript. The editorial office was professional, responsive, and supportive throughout all stages of the publication process. Communication was clear and efficient, and any questions were addressed promptly. Overall, I found the journal to maintain high scientific standards and an excellent publication workflow. I would be pleased to consider submitting future work to this journal. Best wishes from, Elena Popa.

It was my pleasure to submit my testimonial concerning the Reviewer Board of our Scientific Journal “Brain and Neurological Disorders”. The Reviewers focused on some modifications and their contribution was helpful. The ladies of our Editorial Office were also supported my efforts. It was my honor to have such a co-operation and I am looking forward for more collaboration.

Dear Grace Pierce, Editorial Coordinator of Journal of Clinical Research and Reports, Thank you for the speedy and efficient peer review process. I appreciate the fact that your peer reviewers do not take months to respond like with some other journals. I would also like to thank the editorial office for responding quickly to my questions. It is an excellent journal. I plan to submit more manuscripts in the future. Best wishes from, Robert W. McGee

Dear Grace Pierce, Editorial Coordinator of Journal of Clinical Research and Reports, Working with you and your team on our recent publication in JCRR has been a truly wonderful and enjoyable experience. The responses were prompt, and the reviewers were patient, constructive, and highly professional. One reviewer in particular gave me the feeling that a professor was carefully reading and commenting on my coursework, which was deeply touching. The entire process was straightforward and hassle‑free, with no tedious online forms to complete. I highly recommend this journal. Best wishes from, DR Aibing Rao, Head of R&D

I Appreciate the Opportunity to Share my Experience with the Journal of Clinical Research and Reports. The peer review process was timely and constructive, and the feedback provided helped improve the quality of our manuscript. The editorial office was professional, responsive, and supportive throughout the process, ensuring smooth communication and efficient handling of the submission. Overall, it was a positive experience collaborating with your team.

Dear Mercy Grace, Editorial Coordinator of Obstetrics Gynecology and Reproductive Sciences, We would like to express our gratitude for your help at all stages of publishing and editing the article. The editors of the magazine answer all the necessary questions and help at every stage. We will definitely continue to cooperate and publish other works in the Obstetrics Gynecology and Reproductive Sciences! Best wishes from, Alla Konstantinovna Politova,
