
Research Article | DOI: https://doi.org/10.31579/2690-8794/119
1 Clinic of endocrinology and metabolic diseases, UMHAT “D-r Georgi Stranski”, Medical University Pleven, Bulgaria.
2 Medico-diagnostic laboratory of immunology, UMHAT “D-r Georgi Stranski”, Medical University Pleven, Bulgaria.
*Corresponding Author: Silviya Ganeva, Clinic of endocrinology, UMHAT “D-r Georgi Stranski”, Pleven, Bulgaria 81 „Vladimir Vazov” str, 5800 Pleven, Bulgaria.
Citation: Ganeva S., Rayanova G., Todorova К., Lukanov T., Blajeva S, Tsvetkova V. (2022) Comparison of Conventional Methods (Nitrazine Test, Ferning Test) and Placental Alpha- Microglobulin1 (Pamg1) in Cervicovaginal Discharge for the Diagnosis of Rupture of Membranes: A case -Control Research Study, Clinical Medical Reviews and Reports. 4(4); DOI: 10.31579/2690-8794/119
Copyright: © 2022 Silviya Ganeva, This is an open access article distributed under the Creative Commons Attribution License, which permits unrestricted use, distribution, and reproduction in any medium, provided the original work is properly cited.
Received: 26 November 2021 | Accepted: 28 December 2021 | Published: 01 February 2022
Keywords: metabolic syndrome; adipokines; adipocytokines
Adipocytes expresses under the cell surface numerous receptors and secrete many active molecules, named adipokines and adipocytokines.
The aim of the present study was to investigate the levels of adipokines- adiponectin and leptin, adipocytokines- interleukin -1(IL-1), interleukin -6 (IL-6), tumor necrosis factor – α (TNF-α) and C-Reactive protein (CRP) in sera of patients with metabolic syndrome (MS).
Patients and methods: 35 patients with MS (n1=35) and 35 healthy persons (n2=35) were included.
The adipokines- adiponectin and leptin, adipocytokines (IL-1), (IL-6), (TNF-α) and CRP were investigated by enzyme-linked immunosorbent assay (ELISA) in plasma. Two homeostatic models were: Homeostatic Model Assessment for Insulin Resistance (HOMA-IR) and Homeostatic Model Assessment β% (HOMA-β%).
Results: Patients with MS had statistically higher BMI (n1= 35.52±7.2 vs. n2= 22.84±2.98kg/m2; р<0.05), waist circumference (n1=110.0±14.89 vs. n2= 82.87±8.2 sm; р<0.05), systolic (n1=126.71±17.19 vs. n2=119.0 ±7.93mmHg) and diastolic blood pressure (n1=84.14±9.81vs. n2=77.14±6.45mmHg), levels of basal fasting insulin (n1=12.22±6.4vs n2= 8.39±3.04mIU/l; p<0.05) and НОМА-IR (n1=2.69±1.48 vs n2=1.65±0.48; p<0.05) than nonobese controls.
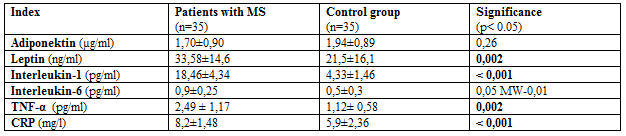
Significantly higher levels of leptin (n1=33.58±14.6ng/ml vs. n2=21.55±.16.1 ng/ml; p<0.05), IL-1 (n1=18,46±4,34 pg/ml vs. n2=4,33±1,46pg/ml; p<0.05), IL-6 (n1=0.9±0.25 vs.n2=0.5±0.3 pg/ml; p=0.05), TNF-α (n1=2.49±1.17 pg/ml vs. n2=1,12±0,58pg/ml; p<0.05) and CRP (n1=8,24±1,48 g/l vs. n2=5,9±2,36g/l; p<0.05) were demonstrated among the patients with MS. BMI had positive correlation with leptin levels and negative correlation with adiponectin levels in group with MS. A positive correlation was found between the Il-1 levels and HOMA%B, as well as between Il-6 and CRP levels in patients with MS.
Conclusion: Patients with MS had elevated levels of adipokines, adipocytokines and CRP.
Adipokines and adipocytokines are biologically active molecules with a local effect on fat tissue and systemic effects on many different organs and systems [1]. The participation of adipokines and adipocytokines in the regulation of carbohydrate metabolism and insulin sensitivity is suspected [2].
The visceral obesity with hypertrophy and hyperplasia of adipocytes leads to disturbance in secretion and metabolic effects of adipokines [3]. Adiponectin, leptin, TNF-α, Il-1 and Il-6 are the representatives of adipokines and adipocytokines mainly with metabolic effects [4]. Adiponectin is secreted from fat tissue and has antiatherogenic and anti-inflammatory actions [5].
The leptin is the first hormone that was isolated from adipose tissue. Its role in weight and energetic body homeostasis, food intake, angiogenesis, immune response and regulating of blood pressure was demonstrated [6].
An increase of insulin sensitivity and decrease of insulin resistance, stimulation of fat acid oxidation and suppression of lipid infiltration of muscular, myocardial tissue and liver were described as a part of physiological effects of adiponectin and leptin [7-9].
The most investigated adipocytokines which secrete in visceral obesity are Inetreleukin-1(Il-1), interleukin- 6 (Il-6) and tumor necrosis factor- alpha (TNF-α) [10].
Experimental [11], clinical [12] and epidemiological investigations [13] established data for elevated levels of these pro-inflammatory cytokines in insulin resistant animal models and patients compared with healthy controls.
Many cells produce Interleukin-1 (macrophages, monocytes, fibroblasts, dendric cells, B-lymphocytes, NK cells, epithelial cells). Besides having a part in inflammatory response, Il-1 also stimulate the release of corticotropin hormone secretion from hypothalamus and take a part in appetite regulation and energetic metabolism with leptin [14].
Interleukin 6 is a multifactorial cytokine that has a hormonal characteristic with typical endocrine action. It is secreted from macrophage, adipocytes and endothelial cells. Adipose tissue is a source of circulating levels of Il- 6 between 25-30% [15].
The role of Il-6 in the context of carbohydrate metabolism is not very clear. The question about the protective or damage function of Il-6 is disputable still now [16, 17,18].
Il-6 is a powerful energetic homeostasis modulator by decreasing of food intake and increasing energetic expenditure in central nervous system [19].
TNFα is a signal cell protein participating in the systemic inflammatory process and in the acute phase of inflammatory reaction. The hypothetical source of TNF-α in patients with obesity and MS are adipocytes and macrophages situated in fat depositions between the myocytes. Many functions of TNF-α which are accomplished by Il-1 and Il-6 participation are described [20].
CRP is an acute phase protein with liver secretion after stimulation of increased serum levels of proinflammatory cytokines, such as IL-1, Il-6 and TNF- α. There is a linear increase of CRP concentration with the increase of MS components count in patients with visceral obesity and MS [21].
Some epidemiological investigations document the role of CRT as a good predictor not only for coronary artery disease, but for DMT2 too [22, 23, 24].
The aim of the present study was to investigate the levels of adipokines- adiponectin and leptin, adipocytokines- interleukin -1(IL-1), interleukin -6 (IL-6), tumor necrosis factor – α (TNF-α) and C-Reactive protein (CRP) in sera of patients with visceral obesity and metabolic syndrome (MS).
A comparative, “case- control” study was conducted among 35 patients with MS, 33,03±8,68 years old, with normal carbohydrate metabolism . The participants in the study were selected from hospitalized patients at the endocrinology clinic, University Hospital “Dr. G. Stranski”, Pleven, after informed consent was singed. The results were compared to those of 35 healthy non obese persons at a similar age (35,29±11,13 years) who were used as a control group. The diagnosis MS was accepted according to the one of the primary medical documentation according criteria of IDF (International Diabetes Federation) from 2010 year.
Height in centimeters and weight in kilograms was measured, BMI was calculated for every patient. Their waist measurements were taken by standard methods. Arterial blood pressure was measured according to the recommendations of Thomas [25]. The patients with systolic blood pressure ≥ 130mmHg or/and diastolic blood pressure ≥ 85mmHg or/and those taking antihypertensive drugs were accepted as hypertensive subjects.
Blood samples were taken at fasting in the morning via venipuncture. The lab tests were provided in the clinical laboratory of university hospital, the activity of which is regulated by the National system for laboratory control.
Carbohydrate metabolism was evaluated by oral- glucose tolerating test (OGTT) with 75 grams of glucose. Blood glucose was measured in venous plasma at the 0, 60 and 120 minutes of the OGTT by applying the glucose oxidizing method (KABE Labortechnik, Denmark; Glucose Analyzer Beckman, USA). The insulin levels were also monitored at 0, 60 and 120 minutes by the ELISA (Stat Fax 2100; Awareness Technology, USA). Two homeostatic mathematical models were used for quantity assessment of insulin resistance and β cells secretory function: 1. Homeostatic Model Assessment for Insulin Resistance (HOMA-IR); HOMA IR = fasting insulin (mIU/l) × fasting plasma glucose (mmol/l)/ 22.5. with reference range for HOMA-IR- from 0.7 to 2.4. 2. Homeostatic Model Assessment β% (HOMA-β%); HOMA-%В= 20 х fasting serum insulin (mIU/l) /fasting plasma glucose (mmol/l)-3,5 with reference value for normal function HOMA-%B≤40% [26].
Adipocytokines (Il-1, IL-6 and TNF-α) and adipokines (adiponectin and leptin) (Gen-Probe Diaclone SAS, France) were determined by enzyme- linked immunosorbent assay (ELISA) with automatic analyzer Stat Fax 2100; Awareness Technology, USA. All results were compared with those of the control group.
All statistical analyses were performed using software STATGRAPHICS Centurion XV.I. Data were presented as their mean value and their standard deviations (means ± SD) or as individual data and median values. Comparisons between groups were done using: Indepеndent sample t-test for parametric comparison of the two means, Kolmogorov Smirnov for a non-parametric comparison and Mann-Withey tests for the test median of two groups. Two-sided P values < 0>
The clinical characteristics of the patients with MS and the control group are shown on table 1.
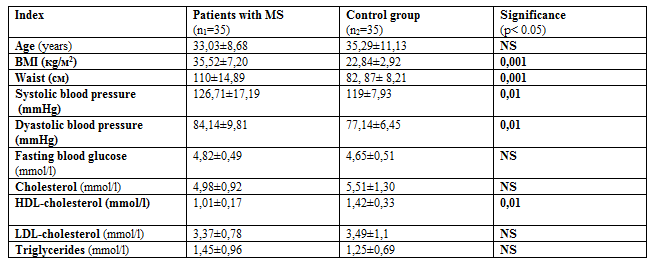
Statistically higher BMI, waist circumference, systolic and diastolic blood pressure was indicated among the patients with MS compared with control subjects.
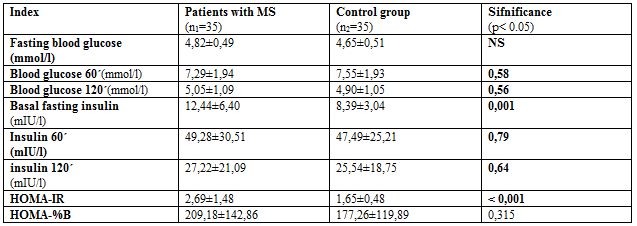
There were no significant differences in glucose levels at fasting, 60 and 120 min during the OGTT between the two compared groups. Higher basal insulin levels (n1=12,44±6,40 mIU/l vs. n2=8,39±3,04 mIU/l; p= 0.001), manifested insulin resistance, calculated via HOMA-IR (n1= 2,69±1,48 vs. n2=1,65±0,48; p=0.0001) was fined for MS patients. There were no differences in β-cells function, presented by НОМА-%В between two groups (table.2).
There no significant differences of adiponectin levels in sera from both groups (n1=1,70 µg/ml ± vs. n2= 1,94± µg/ml; р=0,26) (tabl.3). Patients with MS reported significantly higher concentrations of leptin (n1=33.58±14.6 ng/ml vs. n2=21.55±.16.1 ng/ml; p<0>IL-1 (n1=18,46±4,34 pg/ml vs. n2=4,33±1,46pg/ml; p<0>IL-6 (0.9±0.25 vs.0.5±0.3; p=0.05), TNF-α (n1=2.49±1.17 pg/ml vs. n2=1,12±.0,58pg/ml; p<0>CRP (n1=8,24±1,48mg/l vs. n2=5,9±2,36g/l; p<0>3).
The BMI among the patients with MS showed positive correlation with leptin levels (r= 0.4; p=0.05) and negative correlation with adiponectin levels (r= - 0.4; p= 0.02). Positive correlation between CRP and: BMI (r=0,33; p=0,03), waist circumference (r=0,32; p=0,04), НОМА%В (r=0,4; p=0,008) and IL-6 levels (r=0,32; p=0,05) was funded for the same patients with MS.
The positive correlation was detected between the Il-1 levels and HOMA%B (r=0,42; p=0,004)as well as between Il-6 and CRP (r=0.47; p=0.005) levels from the active group with visceral obesity and MS. The age was negatively correlated towards НОМА%В (r=-0,43; p=0,003).
Results from the study showed no significant difference in serum concentration of adiponectin between the studied patients with MS and the control group. Data from numerous clinical and experimental studies show decreased adiponectin levels in visceral obesity, DMT2, MS and cardiovascular disease [27]. Data on gender differences in adiponectin and leptin levels among African Americans have also been published [28].
In a previous study of the team, our data showed significantly lower serum adiponectin levels in individuals with MS and newly diagnosed DMT2 compared to the control group [29]. These results are consistent with those published in the literature for a closer association of hypoadiponectinemia in DMT2 [30, 31].
The subjects with MS which we studied had visceral obesity and their waist circumference was significantly larger than that of the control group. The relationship between the concentration of leptin in plasma and the amount of adipose tissue has been known for a long time [32]. Our results are in line with those published and show elevated serum leptin levels in people with MS, as well as a positive relationship between BMI and leptin levels in them.
Similar to our results, multiple data showing elevated levels of adipocytokines (IL-1, IL-6 and TNF-α) in patients with MS have been published in literature [33, 34]. It is not possible to directly compare absolute levels due to the fact that there are differences in the type of research kits used and the units in which the results are presented. No direct correlation was found between elevated serum IL-6 levels and MS elements among subjects. These data are consistent with the results of some studies [35, 36] and contradict the results reported in others [37, 38].
Elevated hsCRP levels above 3 mg / l were observed in the MS patients we studied, which also determines a high risk of cardiovascular accidents [39]. The results also show an expected positive correlation between hsCRP and BMI, waist circumference, ESR and IL-6 levels. Similar relationships with visceral obesity have been described in Zuliania [40] and Svensson studies [41].
In patients with MS, changes in the levels of adipokines - adiponectin and leptin, adipocytokines - IL-1, IL-6, TNF-α and CRP are followed by disturbances in their physiological effects, which slows down the oxidation of fatty acids. The accumulation of lipids in muscle cells impairs insulin sensitivity and increases insulin resistance. This resistance is the main pathogenetic factor for an increased risk of developing DMT2 and cardiovascular disease.
Authors declare no economic interest and no conflict of interest exists.
Dear Editorial Team, Clinical Medical Reviews and Reports. My experience with the journal was highly positive. The peer-review process was rigorous, constructive, and completed in a timely manner. The reviewers provided valuable comments that helped improve the quality and clarity of our manuscript. The editorial office was professional, responsive, and supportive throughout all stages of the publication process. Communication was clear and efficient, and any questions were addressed promptly. Overall, I found the journal to maintain high scientific standards and an excellent publication workflow. I would be pleased to consider submitting future work to this journal. Best wishes from, Elena Popa.

It was my pleasure to submit my testimonial concerning the Reviewer Board of our Scientific Journal “Brain and Neurological Disorders”. The Reviewers focused on some modifications and their contribution was helpful. The ladies of our Editorial Office were also supported my efforts. It was my honor to have such a co-operation and I am looking forward for more collaboration.

Dear Grace Pierce, Editorial Coordinator of Journal of Clinical Research and Reports, Thank you for the speedy and efficient peer review process. I appreciate the fact that your peer reviewers do not take months to respond like with some other journals. I would also like to thank the editorial office for responding quickly to my questions. It is an excellent journal. I plan to submit more manuscripts in the future. Best wishes from, Robert W. McGee

Dear Grace Pierce, Editorial Coordinator of Journal of Clinical Research and Reports, Working with you and your team on our recent publication in JCRR has been a truly wonderful and enjoyable experience. The responses were prompt, and the reviewers were patient, constructive, and highly professional. One reviewer in particular gave me the feeling that a professor was carefully reading and commenting on my coursework, which was deeply touching. The entire process was straightforward and hassle‑free, with no tedious online forms to complete. I highly recommend this journal. Best wishes from, DR Aibing Rao, Head of R&D

I Appreciate the Opportunity to Share my Experience with the Journal of Clinical Research and Reports. The peer review process was timely and constructive, and the feedback provided helped improve the quality of our manuscript. The editorial office was professional, responsive, and supportive throughout the process, ensuring smooth communication and efficient handling of the submission. Overall, it was a positive experience collaborating with your team.

Dear Mercy Grace, Editorial Coordinator of Obstetrics Gynecology and Reproductive Sciences, We would like to express our gratitude for your help at all stages of publishing and editing the article. The editors of the magazine answer all the necessary questions and help at every stage. We will definitely continue to cooperate and publish other works in the Obstetrics Gynecology and Reproductive Sciences! Best wishes from, Alla Konstantinovna Politova,
