Research Article | DOI: https://doi.org/10.31579/2641-0419/587
Departments of Medicine, Endocrinology, Diabetes and Metabolism Division, The University of Tennessee Health Science Center, Memphis, Tennessee, USA.
*Corresponding Author: Frankie B. Stentz, M.S., Ph.D. Department of Medicine/ Division of Endocrinology, Diabetes and Metabolism, The University of Tennessee Health Science Center 920 Madison Ave., Suite 300 A, Memphis, TN, 38163, Tennessee, USA.
Citation: Frankie B. Stentz, John V. Christman, Ann Ammons B.S, Chris Sands, (2026), Cardiovascular Risk Factors and Inflammation Improvements, Increased Incretins and Remission of Type 2 Diabetes with a High Protein Muscle Retention Weight Loss Program: Randomized Controlled Trial, J Clinical Cardiology and Cardiovascular Interventions, 9(10); DOI:10.31579/2641-0419/587
Copyright: © 2026, Frankie B. Stentz. This is an open-access article distributed under the terms of the Creative Commons Attribution License, which permits unrestricted use, distribution, and reproduction in any medium, provided the original author and source are credited.
Received: 17 July 2026 | Accepted: 04 August 2026 | Published: 17 August 2026
Keywords: Type 2 Diabetes remission; weight loss; cardiovascular risk factors; incretins; inflammation; exercise; insulin sensitivity; high protein diet
Objective: Determining the effects on cardiovascular risk factors (CVRs), incretins, inflammation (IC), metabolic parameters, muscle and fat body mass along with remission of Type 2 Diabetes(T2DM) in obese subjects using a high protein vs. high carbohydrate weight loss diet program was the objective of this study.
Research Design and Methods: Twenty-four women and men, newly diagnosed with T2D and on no medications, were recruited and randomized to either a high protein- low carbohydrate weight loss program (HP) (12 subjects) or a high carbohydrate-low protein weight loss program (HC) (12 subjects) for 6 months in this randomized controlled trial. Foods purchased at local grocery stores were provided for 6 months to subjects along with daily meal menus with weekly food dispensing and weight determinations. Oral glucose tolerance and meal tolerance tests with measurements of glucose, insulin, CVRs, incretin, and inflammatory markers (IC) and DXA scans were done at baseline and after 6 months on the respective diets.
Results: Both subject groups had similar significant weight loss. 100% of the subjects had remission of their T2DM to Normal Glucose Tolerance (NGT) after 6 months on the HP diet program, whereas, only 8 % of subjects on the HC diet had T2DM remission. Significant improvements in a) cardiovascular risk factors (p=0.003, b) inflammatory cytokines(p=0.001), c) incretins (p=.005), d) insulin sensitivity(p=0.001), and d) increased % muscle body mass(p=0.001) were exhibited with the HP compared to the HC diet group at 6 months.
Conclusions: 100% remission of T2DM to NGT was achieved with the HP weight loss diet at 6 months along with significant improvements in cardiovascular risk factors, incretins, inflammation, metabolic parameters, and muscle retention. All these parameter improvements can be achieved with food costs of only $15/day and available at local grocery stores.
The incidence of people with diabetes mellitus continues to increase. Currently 38.4 million people in the USA have diabetes of which 29.7 million are diagnosed and 8.7 million are undiagnosed according to the Center for Disease Control (CDC) 2025 National Diabetes Statistics Report [1]. Approximately 90-95 percent of diagnosed individuals have type 2 diabetes (T2DM). Obesity is the most significant modifiable risk factors for T2DM with 89.8 % of adults diagnosed with T2DM being overweight or obese [2, 3]. Other complication factors include heart disease, hypertension, and other metabolic diseases [2, 4, 5]. There is a 93-fold increase in T2DM [6] as BMI increases from 23 to > 35 kg/m2. Conversion rate for Impaired Glucose Tolerance (IGT)(prediabetes) to T2DM is between 7-10%/year with no significant difference in ethnicity as shown by Diabetes Prevention Program (DPP) [7, 8] and ACT NOW [9]. T2DM subjects are at increased risk of numerous medical and complications such as seen in COVID-19, as well as, a higher incidence of hospitalization and mortality [10-12]. The yearly economic impact of treating subjects with type 2 diabetes is $412.9 billion [1]. Two individual diabetes prevention studies [13, 14] along with DPP [7, 15] have shown the importance of diet in reducing the conversion of IGT to T2DM. Diagnosis of T2DM needs to begin early in order to reduce the risks, complications and medical costs [16-18]. Although numerous diets have been recommended for T2DM and non-diabetics [19-23], and have hypothesized advantages of low-carbohydrate [24, 25] or high-protein diets [26-28], no consensus has been reached on a specific weight loss diet to manage blood glucose in T2DM [29]. Also, a diet for weight loss and glucose control that could cause reversion of T2DM to Normal Glucose Tolerance (NGT) has not been established. Therefore, because of destructive metabolic changes that occur with T2DM it is important to determine if one exists. Our studies of the effects of macronutrients of a High Protein (HP) diet or High Carbohydrate (HC) diet on IGT obese subjects [30] and NGT obese subjects [31] showed similar weight loss of 9-10%. However, greater advantages of the HP diet for improvements in insulin sensitivity (100% remission of IGT to NGT), CVR factors, muscle preservation, oxidative stress (ROS) and inflammatory cytokines (IC) were shown [30, 31]. HP intake also suppresses hunger and induces satiety [19, 26, 32] and there is a negative relationship between protein content and glycemic index [33, 34]. Proteins also increase energy expenditure by the thermic effect of feeding [35] mostly by increasing protein synthesis. A primary risk factor for CV disease is blood lipids levels. It has been shown that lipids and their metabolism can be affected by diet composition [36-39]. A greater decrease in TG in the HP diet in our studies [30, 31] demonstrated that increasing dietary proteins may beneficially change the lipid profile. Studies have shown that protein intake by itself induces insulin release which is different in subjects with and without T2DM [40]. Additionally, protein is a much less potent insulin secretagogue than glucose in normal subjects [41]. A lower insulin response in subjects to the HP than the HC diet [30, 31] was demonstrated in our studies. Preservation of the Beta cells by increasing sensitivity and decreasing insulin load per meal is suggested with the HP diet results.
Treatment with GLP-1 receptor agonists and DPP-4 inhibitors in subjects with T2DM has been found to improve insulin sensitivity and cardiovascular risks [29, 42-49]. The incretin response of subjects showed an increase in GLP-1 and GIP with the HP diet compared to the HC diet [50, 51] in our studies. This suggests that our HP diet may be beneficial in treating subjects with T2DM and have cardiovascular benefits.
Hyperglycemia [52] and elevation of Free Fatty Acids (FFA) have been shown to lead to leukocytes activation and increases in inflammatory cytokines (IC) and reactive oxygen species (ROS) [53-56]. Hyperglycemia in T2DM and obese subjects is associated with increased IC [57, 58]. Therefore, reduction of IC in T2DM subjects is important in lieu of the fact that patients that develop acute respiratory distress [59-62] as well as COVID-19 have increased IC and diabetes would add to this inflammatory effect [63]. Thus, an important aspect of the HP diet is the decreased blood glucose area under the curve (AUC) response and anti-inflammatory effect compared to the HC diet [30, 31].
Protein content in the diet also helps maintain muscle body mass [30, 64, 65]. Few studies have compared high protein to high carbohydrate weight loss diets with adequate percentages of macronutrients along with sufficient follow-up time to determine effects on CVR factors, ROS, IC, incretins, and muscle mass retention [30, 31, 56, 57, 66-70] especially with respect to subjects with T2DM.
The purpose was to then to more highly define the metabolic effects of HP weight loss program diet and HC weight loss program diet on the remission of T2DM in newly diagnosed subjects with T2DM, and the longitudinal changes in various metabolic markers of insulin sensitivity, CVR factors, IC, ROS, incretin, and change in muscle and fat mass, with our store bought tightly controlled HP and HC diets from baseline to 6 months. This study showed a significant impact of the HP weight loss program diet on these metabolic parameters and causing remission of early T2DM.
Patients
Obese women and men subjects with a BMI Greater-than sign 30 kg/m2 to Less-than sign 55 kg/m2, age 20-60 years old who had been diagnosed with type 2 diabetes in the past two years or diagnosed at study screening visit were recruited. Subjects who met the inclusion criteria of BMI, age, fasting glucose of Greater-than sign 126 mg/dl, 2 hour Oral Glucose Tolerance Test (OGTT) glucose of Greater-than sign 200 mg/dl, and HbA1c of 6.5-10% were selected. Subjects were excluded, as in our previous studies, if weight Greater-than sign 350 lbs, on antidiabetic agents or insulin, triglycerides Greater-than sign 400 mg/dl, LDL cholesterol Greater-than sign 160 mg/dl, SBP Greater-than sign 145 or DBP Greater-than sign 100 mm, taking medications known to effect glucose or lipid metabolism, proteinuria or elevated serum creatinine, thyroid disease with abnormal TSH, history of liver disease, abnormal liver function tests, weight loss greater than 5% the last 6 months, smoking, pregnant or undergoing cancer treatment [30, 31]. If subjects were on metformin and wanted to participate in the study, they were to discontinue the drug with approval of their PCP and 4 weeks after discontinuing the drug baseline tests were performed on these subjects. All subjects were asked to keep a daily food diary for a week and those who were non-adherent to do so or deemed unable to follow the protocol were excluded from the study.
One hundred and twenty-eight subjects were screened by phone and 57 were asked to sign the consent form and have testing performed for meeting the inclusion criteria. Twenty-seven of these subjects met all inclusion criteria and were randomized to a High Protein (HP) weight loss diet (13 subjects) or. High Carbohydrate (HC) weight loss diet (14 subjects) for a period of 6 months. One HP subject and 2 HC subjects dropped out within a couple weeks after screening visit due to their work schedule, long driving distance or moved out of area. Therefore, no data other than baseline screening was available on those subjects and were not included in the data analysis of HP vs HC changes from baseline to 6 months on the diet interventions. Thus, a total of twelve subjects in the HP group and 12 subjects in the HC group completed the 6-month study (Figure 1) and data analyzed.
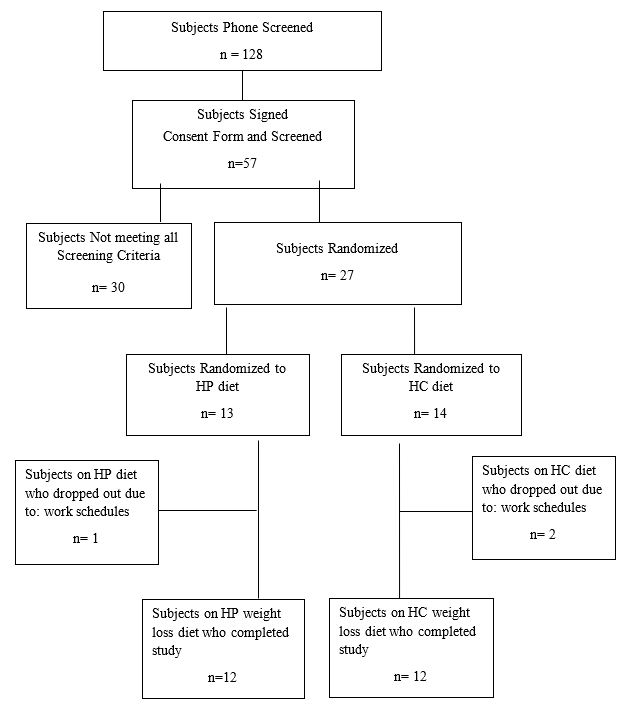
Figure 1: Numbers of recruiting and screening of subjects for the study participants
Study Design
The study was a prospective randomized trial of a High Protein-Low Carbohydrate (30% Kcals from protein, 40% Kcals from carbohydrate (CHO), 30% Kcals from fat) weight loss diet program (HP) vs High Carbohydrate-Low Pr4otein (15% Kcals from protein, 55% Kcals from CHO, 30% Kcals from fat) weight loss diet program (HC) for a period of 6 months. The University of Tennessee Health Science Center (UTHSC) Institutional Review Board approved the study.
All subjects were seen in the General Clinical Research Center (GCRC) at the University of Tennessee Health Science Center (UTHSC) for their visits. After signing the consent form examinations were done including: history and physical(H&P), height, weight, BMI, blood pressure (BP) and waist measurements. At baseline and at 6 months of the study subjects were given a standard OGTT and mixed meal tolerance test (MMT). MTT meal for the HP group subjects was high protein and MTT meal for the HC group subjects was HC. HP and HC meals were 300 calories which was the same number of calories as the 75 gm OGTT. All provocative tests were done after an overnight 10 hour fast two or more days apart. Glucose, insulin, other metabolic hormones and incretins were measured at baseline at 30 minute intervals for 2 hours. OGTT and MTT were repeated again after being on the diets for 6 months. Resting metabolic rate (RMR), DXA (Dual energy x-ray absorptiometry) scan, lipid and chemistry profiles, CBC (Complete Blood Count), vitamin D, PTH, as well as 24 hour urine collections for creatinine clearance (CrCl), urinary urea nitrogen (UUN), microalbumin, and calcium(Ca) were all done at baseline and 6 months as in our previous studies[30, 31]. Measurements were done to determine insulin sensitivity and glucose response, lipids, body composition changes (muscle and fat mass), protein breakdown (by urinalysis) and calcium changes. BMI and waist were measured by standard methods at baseline and 6 months.
Activity of subjects was assessed and all were at minimum activity at baseline. American Diabetes Association [29] recommends 150 minutes of exercise per week, therefore, starting at the beginning of study patients were asked to walk 30 minutes a day for the 6 months and level of physical activity was monitored weekly throughout the study using FitBits. Upon meeting the screening criteria a permuted block randomization method generated by the biostatistician was used to randomize subjects either the HP or HC weight loss diet programs.
Criteria for remission of Type 2 Diabetes to normal glucose tolerance (NGT) was if at 6 months subjects had a fasting glucose Less-than sign 100 mg/dl, and 2 hour OGTT glucose Less-than sign 140 mg/dl and HbA1c Less-than sign 5.7 %. Subjects were considered to have remission to prediabetes if at 6 months they had a fasting glucose of 100 to Less-than sign 126 mg/dl, and 2 hour OGTT glucose level of 140 to 199 mg/dl and HbA1c Greater-than sign 5.7- 6.4%. At 6 month if fasting glucose was Greater-than sign 126 mg/dl and a 2 hour OGTT glucose level of Greater-than sign 200 mg/dl and HbA1c Greater-than sign 6.5%, subject did not have remission of their Type 2 Diabetes and were referred to a Primary Care Physician (PCP) or Endocrinologist for pharmaceutical treatment. Subjects with remission of Type 2 Diabetes were assisted and transitioned to purchase and prepare food for themselves using the diet plans provided during the study. For an additional 6 months these subjects were assisted by dietary consultation with communication by phone and emails to help them maintain weight loss and remission of diabetes.
Diet Composition and Compliance
Resting Metabolic Rate (RMR) using Indirect calorimetry by Cardio Coach(Korr Medical Technologies) was determined for each subject at the beginning of the study to assess the caloric diet intake needs for weight loss and again at 6 months to determine changes in their metabolic rate. After an overnight (10 hr) fast and arriving at the CRC, subjects were rested in a reclining position for 15 minutes after which respiratory exchanges were measured continuously for 15 min to determine the RMR [30, 71].
After each subject’s caloric maintenance needs were established, 500 Kcals/day were subtracted from the determined caloric needs for a meal plan to promote a 1-2 lbs weekly weight loss. On average, a 1700 Kcal/day diet for a 100 kg individual was used to achieve adequate weight loss. If a subject reached a weight loss plateau and did not lose weight for two consecutive weeks, a one-time calorie reduction of 200 Kcal was made. No subject was put on less than 1200 Kcal/day.
All food and daily menus were provided in order to ensure accurate macronutrient consumption and compliance. Meals were dispensed weekly as pre-packaged frozen and fresh foods maintaining the caloric and macronutrients requirements established at randomization by the dietician affiliated with the UT CRC. Subjects were supplied with 3 meals a day plus snacks between meals. The foods were all purchased at local grocery stores and meals met the recommended daily intake of vitamins and minerals for women and men age 20-60 years as determined by the University of Minnesota Nutrition Data system. An average of 1500 mg Ca which is more than the recommended daily intake (RDI) of calcium for women and men ages 20-60 years [72] was provided in both HP and HC diets. Participants were obese with T2DM and at risk for cardiovascular disease so it was important that participants follow a healthy diet to minimize their health risks. Sources of dietary fat focused on monounsaturated and polyunsaturated fats, i.e., plant oils, and nuts [67, 73, 74]. Dietary carbohydrate sources included whole grains, fruits, vegetables and legumes. Dietary proteins included lean meats (i.e., fish, chicken, beef and pork), eggs and non-fat dairy foods. HP diet included extra protein supplements of Muscle Milk or Premier Protein shakes, Zone or Pure Protein Bars, and ProT Gold (OP2 Labs). The diets are consistent with the guidelines of the Institute of Medicine [73] and American Diabetes Association [29].
During the pre-study orientation screening visits participants were given detailed instructions. Food varieties with the same macronutrients were available as choices to increase adherence. After choosing their preferences for meals and snacks participants were instructed to adhere to the diet and food plan to which they were assigned. All food and daily menus was provided on a weekly basis to the participants at their weekly visit and weight measurements for 6 months. Food records were required to be returned when the participants arrived for their next food pick up to assure compliance and diet adherence.
This study used Individualized meal plans with food variety along with frequent interactions and food menu records and have been shown to increase dietary compliance [30, 31]. Recording of daily dietary intake emphasized to the subjects the importance of the diet, as a key component, and food records served as “motivational enforcement” of the study [75].
Assessment of Body Composition by DXA:
DXA (Hologic Discovery QDR Bone Densitometer (DXA)(version 8.3)) was used to measure body composition of the entire body at baseline and 6 months. Body composition components including Muscle Mass (LM), fat mass (FM), and bone mineral content (BMD) were determined [30].
Determination of Plasma Metabolic Hormones, Markers of Cardiovascular Risks, Cytokines, Incretins, and Lipids.
All laboratory analyses were as we previously have described [30, 31] which included: Glucose, insulin, metabolic hormones, GLP-1 and GIP levels for the OGTT and MTT at baseline and 6 months. All were determined at 0, 30, 60, 90, and 120 minutes and AUC calculated by Trapezoidal rule. Insulin, glucose, IC (TNFa, IL-1β, IL-6, INFƔ, MCP-1), GLP-1, GIP, CVR factors (cholesterol, triglycerides, LDL, HDL, hcCRP, BNP, FFA, blood pressure), adiponectin, myonectin, oxidative stress (ROS), β-hydroxybutyrate, and HbA1c were measured using our previously established methods [30, 31, 57, 61, 62, 76]. Coefficient of Variation of assays all were less than 5 percent.
Standard clinical lab procedures for Chemistry Metabolic Profile (CMP), CBC, TSH, cortisol, UUN, PTH, and 25 OH-vitamin D and other tests were done to determine normal or abnormal chemical and metabolic parameters and protein balance. Protein and muscle mass catabolism were assessed with a 24-hour UUN as well as Calcium balance assessed by 24-hour urine Ca excretion at baseline and 6 months.
Insulin Sensitivity and Beta Cell Function
Homeostasis model assessment via HOMA IR [77] was used to determine the insulin resistance Insulin sensitivity (ISI) was determined from OGTT plasma insulin and glucose measurements by the Matsuda insulin index [9, 78]. Beta cell function was calculated as previously described from 2 hour OGTT plasma glucose and insulin measurements [9, 30, 31].
Remission of Type 2 Diabetes, markers of insulin sensitivity, cardiovascular risk factors, inflammatory cytokines, and changes in muscle and fat body mass from baseline to 6 months were the primary outcomes examined. Wilcoxon Rank Sum test was used to compare the effects of the two diets. Changes were compared between the two arms using at 6 months. Wilcoxon Signed Rank test was used to compare baseline and 6 months data to assess effects of each diet. A p-value Less-than sign 0.05 was considered statistically significant. Baseline differences were identified if important and were included in analysis using generalized linear models.
Analyses were conducted using SAS 9.3 (SAS Institute Inc., Cary, NC). Results are presented as mean ± SE. Statistical significance was determined if the two-sided p-value was Less-than sign 0.05. Study design was to recruit 12 subjects in each arm. Power analysis was done according to two scenarios at 5% significance level.
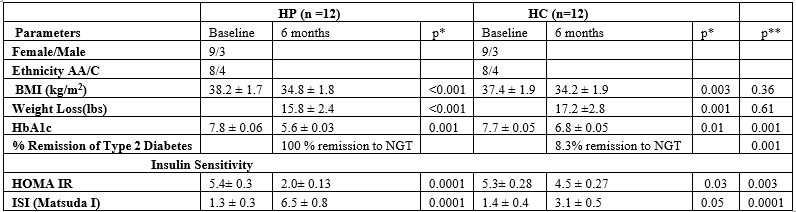
The High Protein weight loss program (HP) subjects and the High Carbohydrate weight loss program (HC) subjects were not statistically different at baseline. Table 1 shows the mean ± SE of various parameters monitored on the twelve HP and twelve HC weight loss diet program subjects from baseline to 6 months and the significant difference in changes of the parameters in subjects on the HP and HC diets. Of significant importance is the 100% (12/12) remission of Type 2 Diabetes to normal glucose tolerance (NGT) in all the HP diet group subjects; whereas, there was only 8% (1/12) remission to NGT in the HC group.
ANALYSIS Mean + SE calculated
**Wilcoxon Rank Sum Test compares variables between the HP and HC diet groups at 6 mo
*Wilcoxon Signed Rank Test compares baseline and 6 mo within diet group (HP or HC).
p Less-than sign 0.05 considered statistically significant
Table 1: Metabolic Parameters and Insulin Sensitivity Changes with the HP and HC Weight Loss Programs
The HP and HC subjects all lost a significant amount of weight at 6 months from their baseline, however, not significantly different between the HP and HC groups. The HP diet group had a significant decrease in waist measurements from baseline (112.5 ± 3 cm) to 6 months (105.2 ± 2 cm) (p=0.001) while the HC group waist measurements decreased from baseline (110.7 ± 3.4 cm) to 6 month (103.8 ± 4cm) (p=0.005). HbA1c significantly improved in the HP group to normal range (Less-than sign 5.7%) at 6 months; however, the HC diet group average HbA1c did not decrease below the criteria of (6.5%) for T2D at 6 months. Insulin sensitivity (HOMA IR and ISI) improved significantly more at 6 months in the HP than the HC group as shown in Table 1. Beta cell function increased from in the HP diet group from baseline (3.2 ± 0.3) to 6 months (11.3± 2.) (p=0.001) and from baseline (3.3 ± 0.4) to 6 months (5.4± 0.7) (p=0.03) in the HC group. A significantly greater improvement in these parameters was observed in the HP group compared to the HC group at 6 months (p=0.001). Compliance of diets was good in both groups HP (94.7%) and HC (94.1%) and not significantly different. Table 2 shows Cardiovascular Risk Factors (CVR) (cholesterol, triglycerides, LDL, HDL, BNP, BP, hsCRP, FFA) were significantly improved in the HP group from baseliner to 6 months, and improved more significantly than the HC group at 6 months. FFA decreased significantly in the HP diet group but increased in the HC diet group at 6 months. Both diet groups has significant decreases in Inflammation markers (TNFα, IL-1β, IL-6, IFNƔ, MCP-1), and oxidative stress (ROS-DCF, MDA); however, a significantly greater reduction in these inflammatory and oxidative stress markers was observed in the HP group compared to the HC diet at 6 months. Reductions in TNFα, IL-1β, IL-6, IFNƔ, and MCP-1 demonstrates a better anti-inflammatory effect of the HP diet than HC diet.
| HP (N=12) | HC (N=12) | ||||||
| Parameters | Baseline | 6 months | P* | Baseline | 6 months | P* | P** |
| Cardiovascular Risk Factors (CVR) | |||||||
| Cholest (mg/dl) | 182 ± 13 | 150 ± 9 | 0.01 | 186 ± 14 | 171 ± 10 | 0.03 | 0.01 |
| TG (mg/dl) | 144 ± 13 | 93.2 ± 8 | 0.01 | 148 ± 12 | 158 ± 8 | 0.02 | 0.01 |
| HDL (mg/dl) | 49 ± 2 | 53 ± 2 | 0.03 | 49 ± 3 | 50 ± 3 | 0.07 | 0.03 |
| LDL (mg/dl) | 96.1 ± 4.3 | 79.3 ± 3.3 | 0.01 | 97 ± 4.5 | 94 ± 3.9 | 0.08 | 0.01 |
| FFA (mmol/L) | 0.76 ± 0.04 | 0.4± 0.03 | 0.001 | 0.72 ± .04 | 0.8 ± .04 | 0.03 | 0.001 |
| hsCRP (mg/L) | 16.4 ± 1.1 | 1.2 ± 0.3 | 0.004 | 16.3 ± 0.9 | 7.3± 0.6 | 0.01 | 0.001 |
| BNP (pg/ml) | 163 ± 8 | 59 ± 5 | 0.003 | 157 ± 7 | 125 ± 6 | 0.06 | 0.001 |
| BP (sys/dias) | 129/86± 4/2 | 116/78±3/2 | 0.01 | 128/85±3 | 117/80± | 0.01 | .7/.7 |
| Inflammatory Markers | |||||||
| TNF α (pg/ml) | 19.4 ± 3.6 | 3.7 ± 0.6 | 0.004 | 18.1± 2.2 | 12.3±1.7 | 0.05 | 0.001 |
| IL-6 (pg/ml) | 10.9± 0.5 | 4.5± 0.4 | 0.004 | 10.7± 0.4 | 9.2± 0.7 | 0.08 | 0.001 |
| IL-1β (pg/ml) | 14.8 ± 0.6 | 2.9 ± 0.5 | 0.001 | 14.6 ± 0.7 | 9.6± 0.5 | 0.03 | 0.001 |
| MCP (pg/ml) | 18.9 ± 2.7 | 1.7 ± 0.7 | 0.003 | 18.3 ± 2.4 | 13.1± 2 | 0.04 | 0.001 |
| IFN Ɣ(pg/ml) | 16.1 ± 0.7 | 8.4 ± 0.3 | 0.004 | 15.7 ± 0.6 | 12.1±0.5 | 0.07 | 0.004 |
| Oxidative Stress | |||||||
| DCF (µM) | 4.1 ± 0.4 | 2.4 ± 0.1 | 0.01 | 4.2 ± 0.3 | 3.7 ± 0.4 | 0.04 | 0.01 |
| MDA (µM) | 2.2 ± 0.08 | 0.7 ± 0.07 | 0.01 | 2.1 ± 0.07 | 1.6±0.08 | 0.04 | 0.02 |
ANALYSIS Mean + SE calculated
**Wilcoxon Rank Sum Test compares variables between the HP and HC diet groups at 6 mo
*Wilcoxon Signed Rank Test compares baseline and 6 mo within diet group (HP or HC).
p Less-than sign 0.05 considered statistically significant
Table 2: CVR, Inflammatory and Oxidative Stress Changes with the HP and HC Weight Loss Programs
Since adipokines (secreted from adipose tissue) and myokines (secreted form muscle) are thought to play an important role in insulin resistance and inflammation, the adipokine (adiponectin)[79] and myokine (myonectin)[80] were measured at baseline and at 6 months. Myonectin at baseline in the HP group (97.4 ± 10.7 ug/L) and HC group (96.5 ± 9.9 ug/L) were not significantly different but decreased significantly more (p=0.001) in the HP group (56.2 ± 8.4 ug/L)) than the HC group (85.4 ±8.3 ug/L) at 6 months. Adiponectin at baseline in the HP group (4496 ± 84 ng/ml) and HC group (4519 ± 94 ng/ml) were not significantly different but increased significantly more (p=0.002) in the HP group (5781 ± 86 ng/ml) than the HC group (5083 ± 88 ng/ml) at 6 months. Fatty Acid Binding Protein (FABP4) [81] expressed in adipocytes and macrophages and plays a role in insulin resistance and atherosclerosis was measured in the HP and HC groups [82]. FABP4 levels were significantly decreased (p=0.001) in the HP group from baseline (40,496 ± 93 pg/ml) to 6 months (27,664 ± 76 pg/ml); however, FABP4 levels in the HC group were not significantly changed from baseline (38,962 ± 97 pg/ml) to 6 months (38,780 ± 91 pg/ml).
The glucose values (mean ± SE) for the 2 hour OGTTs for the HP and HC groups at baseline and 6 months is shown in Figure 2A. The baseline (Bl) glucose values of the OGTTs of HP and HC groups were not significantly different. However, at 6 months(mo) the glucose OGTT values were significantly less than at Bl for the HP group [(Bl vs 6 mo (p=0.0005)], as were the glucose values for the HC OGTTs at 6 months compared to Bl(p=0.01). Additionally, at 6 months the HP diet group OGTT glucose response and AUCs was significantly less (p=0.0001) than the HC diet group. This demonstrates that the HP diet had a greater improvement in glucose disposal than HC diet group. The glucose values (mean ± SE) for the 2 hour MTT for the HP and HC groups at Bl and 6 months is shown in Figure 2B. The glucose response for the HP diet MTT Bl was significantly less (p=0.001) than the HC glucose response to the HC diet Bl MTT. This demonstrates the difference in glycemic response, although same caloric intake (300kcal), of the HP compared to HC meal. At 6 months the glucose values for the HP MTT were significantly less (p=0.005) than BL and glucose values for HC MTT were less than (p=0.01) at Bl. Importantly, at 6 months the glucose values for the HP MTT were significantly less (p=0.0001) than the glucose of the HC MTT diet group. These results showed that the HP weight loss diet plan produced a decreased blood glucose response and improved glucose disposal and insulin sensitivity.
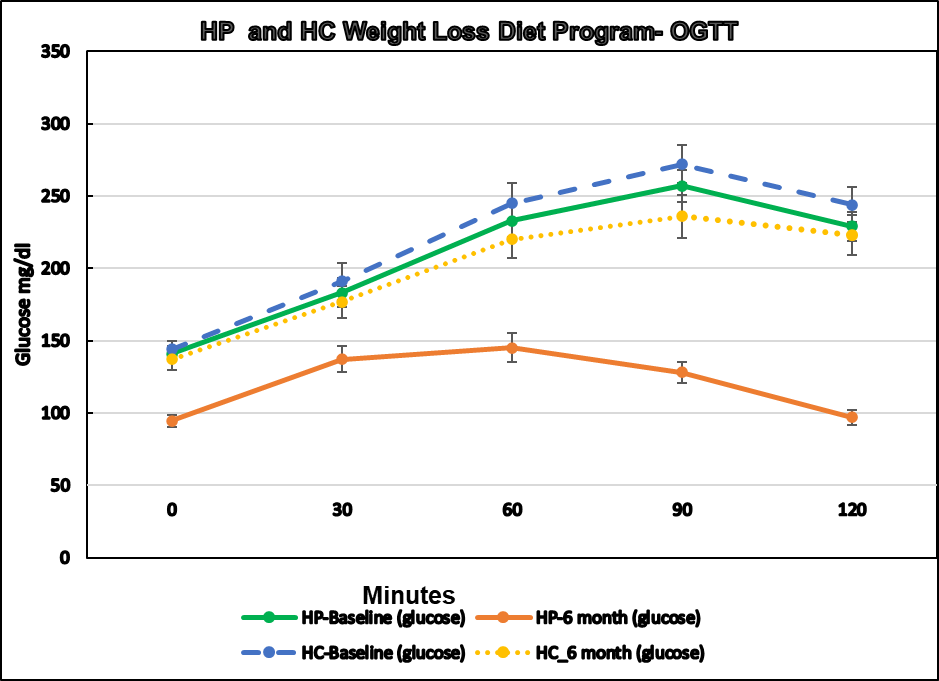
Figure 2A:
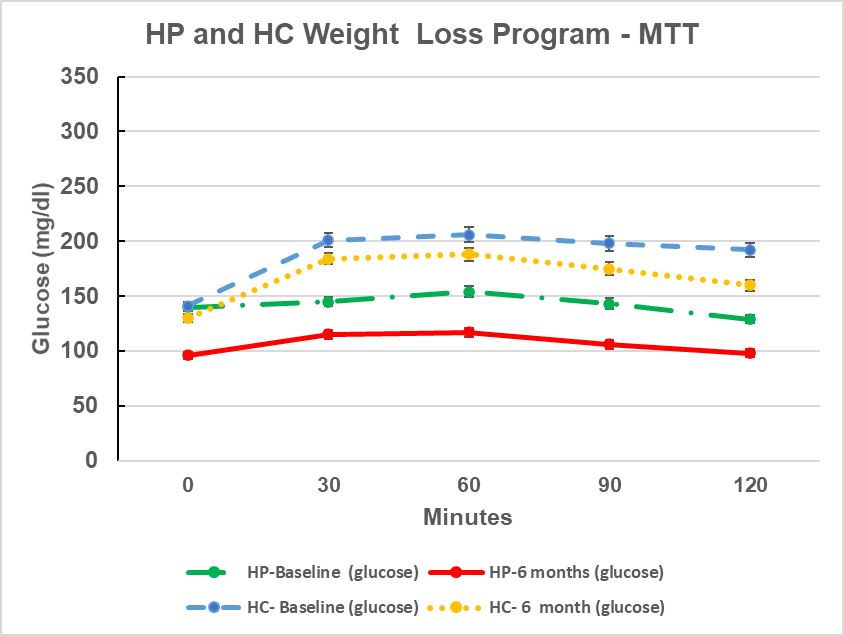
Figure 2B:
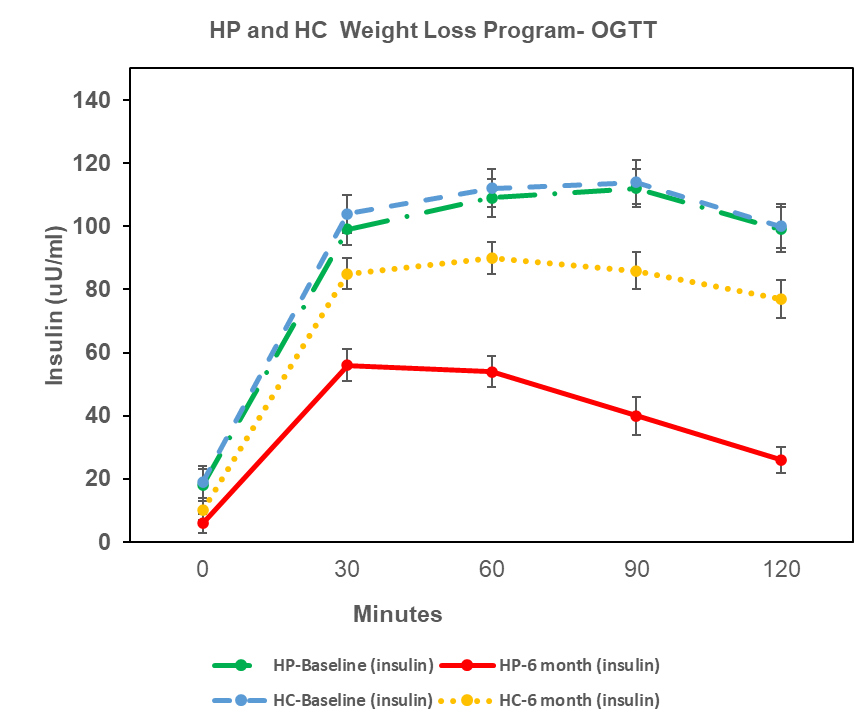
Figure 2C
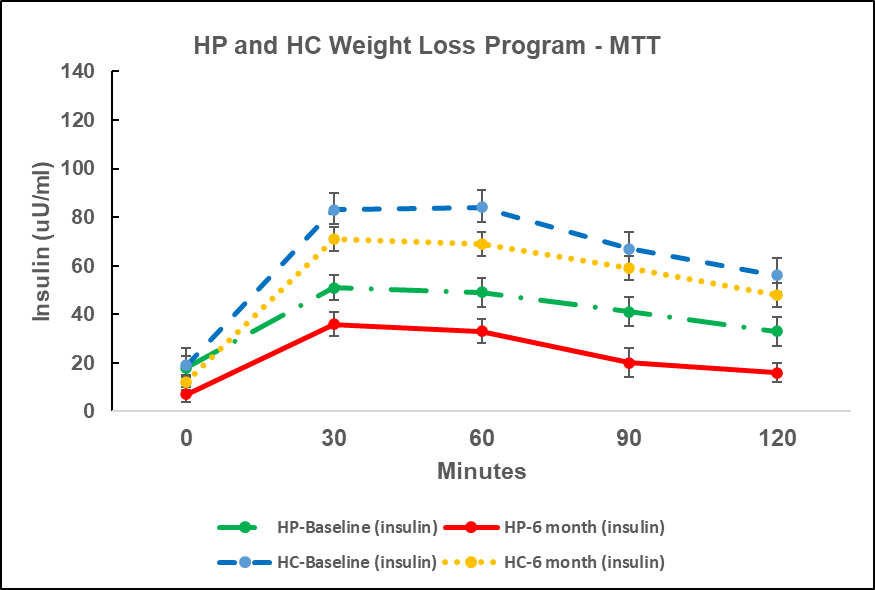
Figure 2D
Figure 2. A, B, C, D: Graphs of the mean ± SE of glucose and insulin for the 2 hour OGTTs and MTTs for the 12 HP diet subjects and the 12 HC diet subjects. The colored lines represent the following: green line is HP diet baseline (HP_bl); red line is HP diet at 6 months (HP_6m); blue line is HC diet baseline (HC_bl); and yellow line is HC diet at 6 months (HC_6m).
The insulin values (mean ± SE) for the 2 hour OGTTs for the HP and HC groups at baseline and 6 months is shown in Figure 2C. The baseline (Bl) insulin values of the OGTTs of HP and HC groups were not significantly different. However, at 6 mo the insulin OGTT values were significantly less than at Bl for the HP group [(Bl vs 6 mo (p=0.0004)], as were the insulin values for the HC OGTTs at 6 months compared to Bl(p=0.02).. Additionally, at 6 months the HP diet group OGTT insulin response and was significantly less (p=0.0001) than the HC diet group. This demonstrates that the HP diet had a greater improvement in insulin sensitivity than HC diet group. The insulin values (mean ± SE) for the 2 hour MTT for the HP and HC groups at Bl and 6 months is shown in Figure 2 D. The insulin response for the HP diet MTT Bl was significantly less (p=0.001) than the HC insulin response to the HC diet Bl MTT. This demonstrates the difference in insulin response, although same caloric intake (300kcal), of the HP compared to HC meal. At 6 months the insulin values for the HP MTT were significantly less (p=0.001) than BL, as were, insulin values for HC MTT which were less than (p=0.01) at Bl. Importantly, at 6 months the insulin values for the HP MTT were significantly less (p=0.0001) than the insulin of the HC MTT diet group. These results demonstrate greater insulin sensitivity with the HP diet and less stress on the B cells for for the same caloric intake.
Figure 3A shows the incretin, GLP-1 plasma AUC levels over the 2 hr MTT on the HP and HC diets at Bl and 6 months. The HP diet group MTT had greater GLP-1 AUC at baseline than the HC diet group MTT (p= 0.005). After 6 months on the HP diet the GLP-1 levels were significantly greater than the HC diet group ( p=0.001). This demonstrates an improvement in the release of the incretin, GLP-1, by the HP diet compared to the HC diet. The GIP response to the 2 hr MTT of the HP diet group compared to the HC diet group is shown in Figure 3B. The HP diet group had a significant increase in GIP AUC compared to the HC diet group with the MTT at baseline (p=0.01) and after 6 months(p=0.001) on the diets. Thus, a greater increase in both GLP-1 and GIP plasma levels were observed with the HP diet compared to the HC diet.
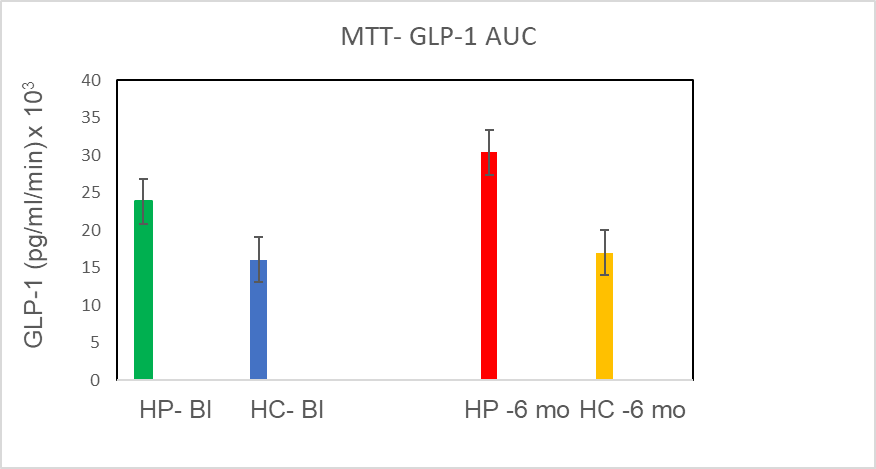
Figure 3A: Graphs of the GLP-1 mean ± SE AUC of GLP-1 over the 2 hour MTTs at baseline for the 12 HP diet subjects and the 12 HC diet subjects and after 6 months on the HP or HC weight loss diet programs.
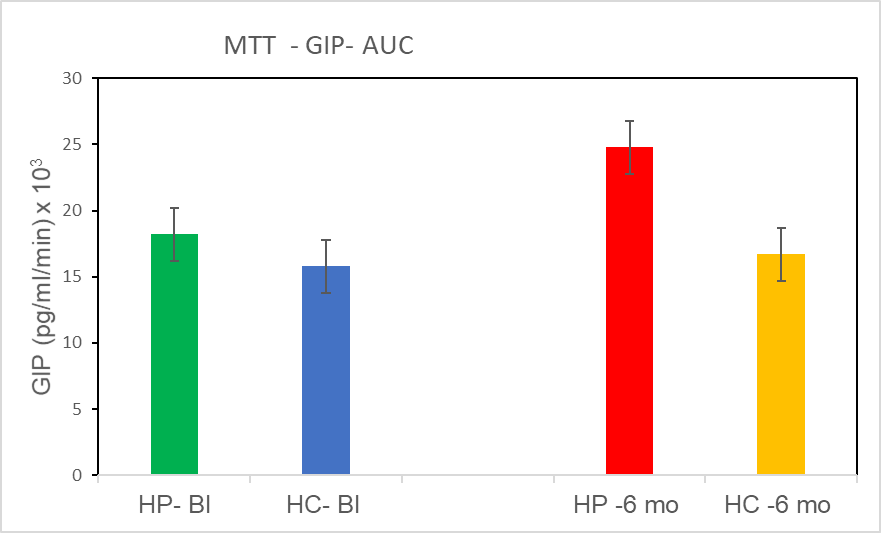
Figure 3B: GIP mean ± SE AUC of GIP over the 2 hour MTTs at baseline for the 12 HP diet subjects and the 12 HC diet subjects and after 6 months on the HP or HC weight loss diet programs.
Since the HP diet subjects expressed greater satiety than the HC diet subjects Ghrelin, a satiety hormone, levels were measured for the HP MTT and HC MTT diet groups (Figure 3 C). Significantly lower Ghrelin AUC levels were observed for the HP MTT than the HC MTT diet at baseline (p=0.01) and 6 mo (p=0.005). This study demonstrates that a greater decrease in hunger is obtained with the HP diet than the HC.
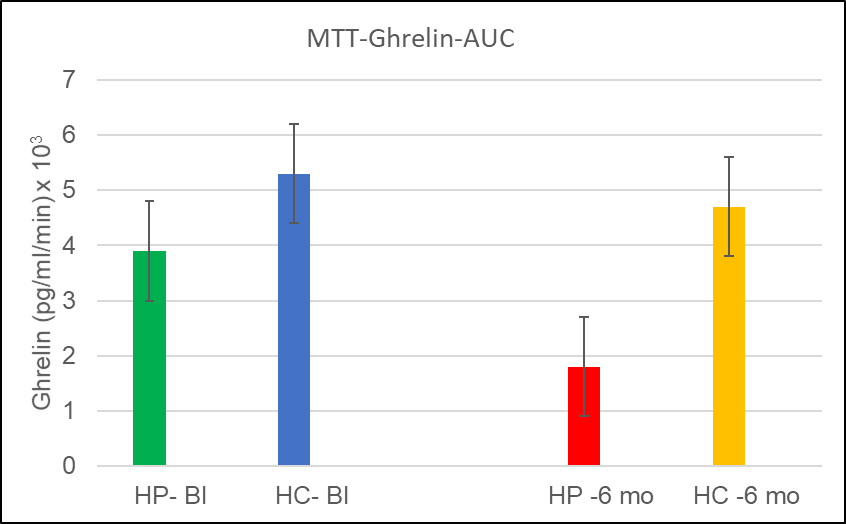
Figure 3C: Ghrelin mean ± SE AUC of Ghrelin over the 2 hour MTTs at baseline for the 12 HP diet subjects and the 12 HC diet subjects and after 6 months on the HP or HC weight loss diet programs.
The effect of the HP and HC weight loss programs on ketones, was determined by measuring β-hydroxybutyrate in fasting blood. Neither group was signifi8cantly different in β-hydroxybutyrate from baseline to 6 months. Thus, no significant ketosis was induced by either diet. All CBC and chemistry profile values were normal values at baseline and 6 months. UUN from Bl to 6 months (8.7± 2.2 to 17.8 ± 2.4 gm/24 hr) increased significantly (p=0.001), whereas no significant increase (8.8 ± 2.1 to 9.0 ± 1.7 gm/24 hr) (p=0.7) occurred in the HC group. Thus, verifying the HP group was following their HP meal plan. Other parameters including: serum or urinary Ca, 25-OH Vitamin D, PTH. Microalbumin CrCl did not change significantly (data not shown) in either the HP or HC group.
Muscle mass (LM) and fat mass (FM) percent changes in the HP and HC groups is shown in Figure 4. There was a significant % increase in LM in the HP group while a significant decrease in % FM in HP group from baseline to 6 months. Whereas, there was a significant decrease in both the % LM and FM in the HC diet group from baseline to 6 months. Thus, the HP diet group was able to increase LM while achieving weight loss while the HC group lost LM.
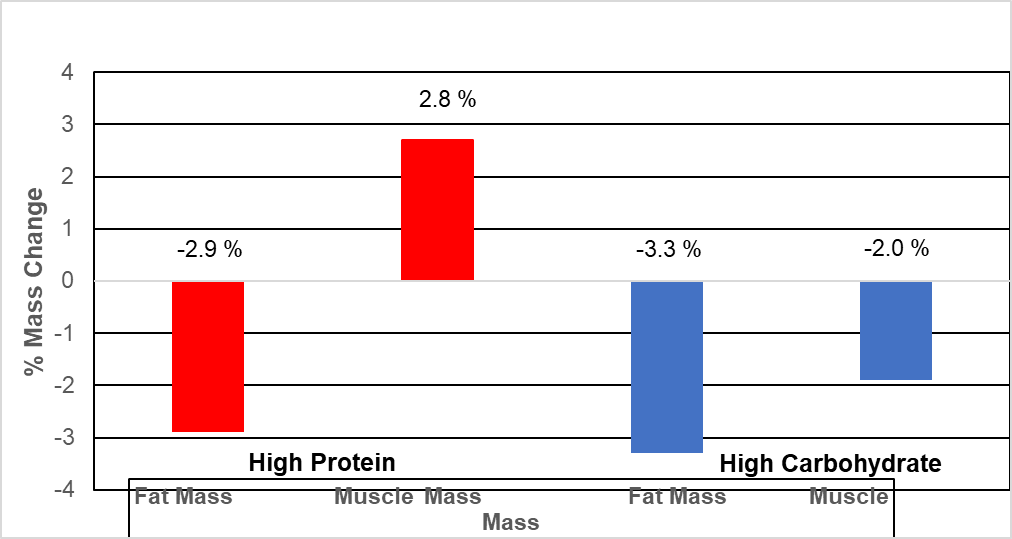
Figure 4: Effects of the HP and HC diets on percent changes in muscle body mass (LM) and fat body mass (FM) at 6 months on the diets.
There are several important findings in this study which co-roborate the findings of our previous study with fewer subjects [83] . 1) The HP weight loss diet program (a restricted calorie High Protein and Low Carbohydrate diet) resulted in 100% remission of T2DM to NGT in the HP subjects but the HC weight loss diet program (a restricted calorie High Carbohydrate and Low Protein diet) resulted in only 8 % remission to NGT in those subjects. This is the first lifestyle intervention study resulting in 100% remission of T2DM, to our knowledge, using feeding of foods obtained from local grocery stores. 2) The HP diet group had greater improvement in insulin sensitivity, greater reduction in cardiovascular risk factors, decreased inflammation and oxidative stress (ROS) and increased incretins (GLP-1 and GIP) compared to the HC group. 3) Muscle body mass (LM) percent increased while body fat mass (FM) percent was decreased in the HP group; however, both percent muscle mass (LM) and percent FM decreased in the HC group. LM preservation with the HP diet group may be an important factor in improving insulin sensitivity due to the fact muscle is a major insulin sensitive tissue for glucose uptake. 4) Both the HP and HC diet groups had a high level of compliance (>90%) obtained by giving the subjects the diet meals and menus and survey of food consumption at weekly CRC visits.
The American Diabetes Association recommends that subjects with T2DM exercise 30 minutes per day, therefore, all subjects were asked to walk for 30 minutes per day which was monitored by Fitbits given to the subjects. No significant difference in exercise amounts between the HP and HC groups were determined; thus, not affecting between group results. Glucose OGTT levels were similar at baseline, however, the HC group sustained significantly higher glucose levels which remained in the T2DM range at 6 months in contrast to the HP group in which glucose levels decreased to normal after 6 months on the diet. Glucose levels for the HP MTT were significantly lower at baseline and at 6 months compared to the HC MTT. Increased improvement of insulin sensitivity and Beta cell function in the HP group at 6 months vs the HC group probably results in decreased β cells stress in the HP group. Metabolic environment of obesity causes B-cell dysfunction [84, 85] is supported by our study which shows improvement in insulin sensitivity and B-cell function and metabolic parameter changes with weight loss with the macronutrients of the HP diet in subjects with T2DM as we have shown with obese subjects with prediabetes [30].
There is a positive correlation with increase in GLP-1 and increase in B-cell function with the HP diet in this study. Improvement in B cell function with treatment with GLP-1 agonists has also been shown in other studies[46, 86] using pharmaceutical drugs. DPP4 inhibitors are beneficial for increasing GLP-1 level [87]. Long acting GLP-1 agonists show a significant improvement in glucose regulation compared to GIP [88]. Importantly, this shows that the GLP-1 and GIP can be increased with the HP diet without medications. Other studies have shown improvement in insulin sensitivity and B cell function with pharmaceutical intervention for weight loss in obese subjects [7] [9, 89, 90].; however, this is the first study using non pharmaceutical methods to investigate the effects of certain macronutrients on weight loss, CVR, insulin sensitivity, B cell function, inflammation and incretin effects in obeseT2DM subjects.
Higher sustained glucose levels with ingestion of glucose or higher glycemic index foods as in the HC diet correlates with increased inflammation and oxidative stress compared to the HP group is demonstrated in this study. It has been shown that antioxidant enzymes induced by repeated intake of excess energy such as high carbohydrate or high fat diets are insufficient to block oxidative stress and inflammation [91]. The decrease in the myokine myonectin [80, 92] over 6 months demonstrates improvement in inflammation in the muscle in the HP group. The increase in the adipokine adiponectin [93] in the HP group demonstrates decreased inflammation in the adipose tissue over 6 months, In addition the FFA and the FABP4 [81] decreased in the HP group while not changing or slightly increasing in the HC group over 6 months.
Our HP and HC diets have more than the FDA recommended Ca /day [72] and subjects showed no bone loss or Ca loss in the urine [30], in contrast to a study reporting a greater than 30 % protein diet caused a negative calcium (Ca) balance, thus, adversely affecting the bones [26]. Our HP diet (30% protein) is at the upper suggested protein consumption range (10-30%) which is not at a sufficient protein amount to cause a negative calcium (Ca) balance.
HOMA-IR or ISI (Matsuda Index) were not significantly different at baseline between the HP and HC groups of which the majority were mostly African American (AA). Limitations of insulin sensitivity assessment by HOMA-IR with AA has been suggested by some [94]. However, both assessment methods showed greater improvement of insulin sensitivity at 6 months with HP diet than HC diet.
An important factor in weight loss is compliance to a healthy diet. Our macronutrients study with the HP weight loss diet program provided all healthy foods for each subject’s individualized liking for both the HP and HC diets and a weekly menu for compliance. Food was dispersed at their weekly weight checks for 6 months resulting in over a 90% compliance. Most studies have used food recall questionnaires of food a subject ate days to weeks before and generally is much less accurate such as (DPP, Look Ahead) [7, 95] and liquid diet reported by Lean [96].
Strict adherence of dietary intervention can produce meaningful and reliable results and remission of Type 2 Diabetes as our study demonstrates. Subjects who decided to stay on the HP weight loss program for an additional 6 months and purchase their food were given consultations and assistance by the investigators when needed to maintain weight loss and normal glucose levels at 12 month follow up visit.
With this method the HP diet plan could allow for a diet weight loss plan to be provided by primary care physicians and offer an economical means of achieving nutritional, fat only, weight loss for both women and men and remission of Type 2 Diabetes.
The protein amount was 30% of daily calories which is not above the upper limit of recommended daily protein and preserves muscle mass and does not cause any kidney or liver problems. Conversely, the 15% protein in the high carbohydrate diet resulted in loss of % lean body mass.
T2DM is considered to be an inflammatory disease [97] and these subjects have been shown in our studies and others to have increased levels of inflammatory cytokines. Subjects with ARDS, COVID-19 [98] have also been shown to have increased cytokines, therefore, T2DM can exacerbate the inflammation response caused by other illnesses. Remission of T2DM can decrease the inflammatory cytokines and help prevent other inflammatory diseases from becoming a cytokine storm of inflammation and also decrease cardiovascular risk factors.
This study shows that remission of T2DM can be achieved with dietary alterations if food intake parameters are tightly controlled and at least a low intensity exercise program is followed. The fact that our HP weight loss program had a significantly greater reduction in inflammation, ROS, and cardiovascular risk factors than the HC diet in subjects with T2DM while maintaining percent muscle mass but reducing fat mass is of great health significance. In addition to the benefits of these effects, the weight loss has been shown to be important in longevity as demonstrated with studies of sirtuins and weight loss with food restriction [99, 100]. This study with an increased number of participants sustains the results we observed in our earlier study [83] and supports the findings of muscle mass maintenance shown in other studies of a high protein calorie restricted diet [101, 102] and doesn’t cause muscle loss as seen with some pharmaceutical weight loss drugs [103].
Even though HP diet was isocaloric with the HC diet, it demonstrated greater metabolic improvements compared to the HC diet. Our study demonstrates that changing the macronutrients can improve insulin action, reduce cardiovascular risk factors, inflammation and ROS, increase per cent muscle mass while reducing fat mass and weight, and increase incretins. This study is unique due to the fact that we used a non-pharmaceutical means (HP diet) for remission of T2DM with muscle retention but fat and weight loss, similar to our previous studies of remission of prediabetes. Our subjects achieved T2DM remission along with decreased cardiovascular risk factors, inflammation and oxidative stress, and increased levels of incretins (GLP-1 and GIP). This was achieved by using high protein calorie restricted meals with foods which can be obtained at local grocery stores for an economically feasible amount of around $15 per day.
This study was funded by: American Diabetes Association (7-12-CT-41) and A.D. Baskin Research Fund
Competing Interests Statement:
The authors have no competing interests to declare.
Contribution Statement:
Author contributions: F.B.S. wrote the manuscript, researched data and contributed to the conception, design, coordinated recruitment and following subjects on the study, C.S. conducted history and physical examinations of subjects, reviewed data and manuscript. D.L., S.T., and J.C. performed some of the laboratory assays, reviewed and edited manuscript and organized patient data. Nutritionists at the UTHSC CRC provided information on diets and provided daily food and menus to participants, Dr. Jim Wan was the biostatistician in charge of statistical analysis. F.B.S. is the guarantor of this work and, as such, had full access to the data in the study and take responsibility for the integrity of the data and accuracy of the data analysis. The manuscript has been read and approved by all the authors.
The authors thank medical technologist A. Ammons at UTHSC for assays of hormones and cytokines, the nursing and recruiting staff of the Clinical Research Center unit, all of whom are affiliated with the UTHSC, for their efforts and for assisting with the patients care and OGTT and MTTs. The authors also thank all the study volunteers for their participation in the study. The Medical Student Research Fellowship Program from the National Institutes of Health/National Institute of Diabetes and Digestive Diseases (C5T35DK007405-28) (S. Dagogo-Jack, PI) at the University of Tennessee Health Science Center funded participation of second year medical students Damon Lawson (D.L) and Sidney Tucker (S.T.) of this research study.
Data Sharing Statement:
No additional data are available.
Disclosure Statement: The authors have nothing to disclose.
Funding
This study was funded by the American Diabetes Association (7-12-CT-41) and the AD Baskin Research Fund (PI FS) ClinicalTrials.gov. Identifier: NCT01642849.
Dear Editorial Team, Clinical Medical Reviews and Reports. My experience with the journal was highly positive. The peer-review process was rigorous, constructive, and completed in a timely manner. The reviewers provided valuable comments that helped improve the quality and clarity of our manuscript. The editorial office was professional, responsive, and supportive throughout all stages of the publication process. Communication was clear and efficient, and any questions were addressed promptly. Overall, I found the journal to maintain high scientific standards and an excellent publication workflow. I would be pleased to consider submitting future work to this journal. Best wishes from, Elena Popa.

It was my pleasure to submit my testimonial concerning the Reviewer Board of our Scientific Journal “Brain and Neurological Disorders”. The Reviewers focused on some modifications and their contribution was helpful. The ladies of our Editorial Office were also supported my efforts. It was my honor to have such a co-operation and I am looking forward for more collaboration.
Dear Grace Pierce, Editorial Coordinator of Journal of Clinical Research and Reports, Thank you for the speedy and efficient peer review process. I appreciate the fact that your peer reviewers do not take months to respond like with some other journals. I would also like to thank the editorial office for responding quickly to my questions. It is an excellent journal. I plan to submit more manuscripts in the future. Best wishes from, Robert W. McGee

Dear Grace Pierce, Editorial Coordinator of Journal of Clinical Research and Reports, Working with you and your team on our recent publication in JCRR has been a truly wonderful and enjoyable experience. The responses were prompt, and the reviewers were patient, constructive, and highly professional. One reviewer in particular gave me the feeling that a professor was carefully reading and commenting on my coursework, which was deeply touching. The entire process was straightforward and hassle‑free, with no tedious online forms to complete. I highly recommend this journal. Best wishes from, DR Aibing Rao, Head of R&D

I Appreciate the Opportunity to Share my Experience with the Journal of Clinical Research and Reports. The peer review process was timely and constructive, and the feedback provided helped improve the quality of our manuscript. The editorial office was professional, responsive, and supportive throughout the process, ensuring smooth communication and efficient handling of the submission. Overall, it was a positive experience collaborating with your team.

Dear Mercy Grace, Editorial Coordinator of Obstetrics Gynecology and Reproductive Sciences, We would like to express our gratitude for your help at all stages of publishing and editing the article. The editors of the magazine answer all the necessary questions and help at every stage. We will definitely continue to cooperate and publish other works in the Obstetrics Gynecology and Reproductive Sciences! Best wishes from, Alla Konstantinovna Politova,