
Research Article | DOI: https://doi.org/10.31579/2692-9406/025
*Corresponding Author: González- Correa Clara Helena, Department of Basic Health Sciences, Universidad de Caldas, Manizales, Colombia.
Citation: G-C Clara Helena. (2020) Body Composition, Functional Status and Clinical Outcomes in Patients with Chronic Obstructive Pulmonary Disease. Biomedical Research and Clinical Reviews. 2(1); DOI: 10.31579/2692-9406/025
Copyright: © 2020 González- Correa Clara Helena, This is an open-access article distributed under the terms of the Creative Commons Attribution License, which permits unrestricted use, distribution, and reproduction in any medium, provided the original author and source are credited.
Received: 29 September 2020 | Accepted: 18 November 2020 | Published: 18 December 2020
Keywords: chronic obstructive pulmonary disease; muscle function; pulmonary function; symptoms; exacerbations
Objective: To define the correlation between the Fat Free Mass Index (FFMI), the muscle function, degree of airflow obstruction, the respiratory symptoms and the number of exacerbations during the last year in patients with Chronic Obstructive Pulmonary Disease (COPD).
Methods: Prospective and cross-sectional study of subjects older than 40 years with a clinical diagnosis of COPD who underwent measurement of the FFMI and muscular function to determine if these were correlated with the variables of severe COPD.
Results: 55 patients Participated in the study. The FFMI was below 32.7% (n=18) and the strength diminished in 56.4% (n=31). In the sample, we found a direct and significant correlation between the FFMI and the FEV1* (predicted %), (p= 0,045). When analyzed by sex, men had a direct correlation between FFMI and the FEV1*(predicted %), (p=0,019), an inverse correlation between FFMI and the spirometric classification of the Global Initiative Obstructive Lung Disease (GOLD) (p=0,008) and between the muscular function and the symptoms (p=0, 03). In women no significant correlation was found.
Conclusions: The conditions in mass and the muscular function were correlated with clinical variables and pulmonary function in men, but not in women. We did not find a correlation between corporal composition and the number of exacerbations.
COPD is a respiratory pathology with a persistent limitation of the air flow. It is in the fourth place as a cause of mortality and the first of chronic mortality in the world. Due to the increase in life expectancy, the tobacco use and the increase in environmental factors, for 2020 it will become the third world cause of death [2]. Latin America reported a prevalence between 7, 8 and 19,7% [1] and for 2008 Colombia reported 8,9% [3].
Additional to the impact at a pulmonary level, the COPD can cause significant systemic effects like dysfunction and a loss of skeletal muscle mass.
Approximately 25 % of patients with a moderate to acute disease and 35% of patients with an extremely serious disease show a reduced FFMI. There are several factors that contribute to this reduction, such as insufficient energy intake due to the loss of appetite, an increase in energy expenditure secondary to increased respiratory work and a systemic inflammatory state with increased production of inflammatory cytokines such as interleukin (IL) -6, IL-8 and tumor necrosis factor (TNF-α) [4.5]. It is proposed that the etiology of musculoskeletal dysfunction is due to hypoxia and chronic hypercapnia, the use of steroids, oxidative stress and physical deconditioning [6], although there are studies that have shown muscle atrophy as its major determinant [7].This dysfunction is characterized by reduced muscle strength (6) and physical performance [8].
Alterations in FFM and muscle function have been associated with variables that determine the severity of COPD, such as limitation to exercise performance, decrease in quality of life, increase in the frequency of exacerbations and the level of obstruction of the airway [8, 9, 10, 11]. This is why multidimensional COPD rating systems have been developed that include functional and nutritional assessment in addition to the evaluation of respiratory function such as the BODE Index [12].
In Latin America there have been no studies that evaluate the nutritional status, muscle functionality and its correlation with COPD severity variables according to GOLD [1]. The present study used the fat free mass index (FFMI) to analyze the nutritional status. Hand grip strength and walking speed were used to evaluate the muscle functionality of people with stable COPD who had different degrees of severity. This is how the objective of this study was to define the correlation between FFMI, muscle function, respiratory symptoms, exacerbations and degree of obstruction in the airway.
Design of the study and subjects
It is a prospective and cross-sectional study. A sample of 47 patients was calculated that allowed to detect correlation coefficients higher than 0.4 with a 95% safety and a statistical power of 80% according to findings in previous studies with similar characteristics [13, 14, 15]. The study population included subjects with a clinical diagnosis of COPD, managed by ambulatory services of pulmonology or internal medicine of the city of Manizales, during January 1st to November 30th, 2018. Subjects were included according to the following criteria: age over 40 years, clinical diagnosis of COPD and acceptance to participate in the study. Once included, they were called in for evaluation in the nutritional assessment laboratory of the University of Caldas, and FFM was measured using Electrical Bioimpedance Analysis (EBA), pulmonary function assessment by spirometry, evaluation of muscle function by manual dynamometry, anthropometry and survey of symptoms and quality of life, according to the COPD assessment test (CAT).
Subjects with exacerbations in the last month who did not comply with spirometric criteria for COPD according to GOLD (1), as well as those with active pulmonary infections or disability that prevented any of the measurements necessary for the study were also excluded (Annex 1). The study protocol was approved by the Ethics Committee of the University of Caldas and all patients were informed of the proposed procedures, after which they gave their written informed consent.
COPD Severity
The COPD severity was evaluated according to the GOLD (1) guidelines by measuring the degree of airflow obstruction according to FEV1 (predicted %), the CAT and the frequency of exacerbations during the past year. With these variables we generated the following four groups:
Group A: low risk, little symptomatic;
Group B: low risk, very symptomatic;
Group C: high risk, little symptomatic;
Group D: High risk, very symptomatic.
Pulmonary function
Spirometry was performed with the equipment to measure lung function Quark PFT-2 (± 0.01 L COSMED, Italy) calibrated daily before starting the evaluation, according to the standards of the American Thoracic Society/European Respiratory Society [30]. Patients were examined in a sitting position and they had to complete a basal spirometry with three forced vital capacity maneuvers (FVC) acceptable and repeatable for FVC and FEV1 (difference between the two highest values of FVC or FEV1<0.15 L).
The FEV1, FVC and the relation between FEV1/FVC were measured before and 15 minutes after a bronchodilator test with 400 mcg dose of salbutamol. The FEV1 and FVC value are expressed in liters and the predicted percentage for the patients of the same genre and age. The relationship between FEV1/FVC was calculated with the highest values of each of the parameters in at least 3 spirometry maneuvers with an acceptable technical curve. For the COPD diagnosis, a relation between FEV1/FVC < 0.7 post-bronchodilator was considered as a cutting point (1). The obstruction degree in the air way was stratified in four groups: GOLD 1≥80%, GOLD 2 50-79%, GOLD 3 30-49% y GOLD 4 <30% according to the post-bronchodilator FEV1 (of the predicted %).
Symptoms and Exacerbations:
The CAT (an 8 item unidimensional questionnaire format) specific for COPD and validated in Spanish, was used to determine the symptomatology. The score goes from, 0 to 40. It has an adequate correlation with the St George Respiratory Questionnaire (SGRQ) [23, 24] and is easier to interpret, which allows it a higher reproducibility in the test-retest procedure [25]. The results were expressed as discrete variables and the highest values represent the patients with the most symptoms and the worst quality of life and as a dichotomous variable using a lower value than 10 as little symptomatic according to the GOLD guides [1]. An exacerbation was defined as the acute worsening of the respiratory symptoms that took the patient to an additional treatment and needed or not of being hospitalized for its management. As a frequent exacerbator, we defined those who presented one or more exacerbations in the last year that required of hospital admission, or two or more exacerbations that did not require hospitalization [1].
Muscular function
The muscular function was evaluated by means of hand grip with manual dynamometry and walking speed in 4 meters. For the manual dynamometry, we used a digital Baseline® dynamometer, (±1 kg, Fabrication Enterprises Inc, USA) following the recommendations given by the American Therapeutic Society [16]. Three measurements were taken at the 0, 35 and 70 seconds mark taking as a result the highest of the three measurements expressed in Kg/force [16]. The reference values used were according Mathiowetz and Cols. in 1985, for the different age groups and sex [17]. We used the gait speed test in 4 meters, due to the easy application in the clinical and research settings. It has a good inter-observer and reproducibility correlation [18], being considered normal values as those equal to or higher than 0.8 m / sec.
FFM and FFMI
The FFM was calculated using a
Xitron Technologies 4200®bioimpedance meter with a constant alternating current at a frequency of 50 kHz (U.S.A).
The patients were placed in supine position with four surface electrodes on the wrist and near the ankle, according to the criteria of the European Society of Clinical Nutrition and Metabolism [19]. The validated formula by Schols et al in 1991 was used as a calculation formula in patients with COPD [20]. The FFMI (kg/m2) was determined according to the FFM/ height2 equation.
A low FFMI was defined as less than 15 kg / m2 in women and less than 16 kg / m2 in men for patients with COPD (21.22).
For the statistical analysis, the SPSS program, version 15, licensed for the University of Caldas, was used.
C The characteristics of the population were presented as %. The Pearson correlation coefficient was used to evaluate the association between the variables.
The Bioethics Committee of the University of Caldas approved the study and all the participants signed the informed consent.
Results
From the outpatient department of internal medicine and pneumology, 142 patients who met the inclusion criteria were recruited, of whom 19 were excluded because they presented clinical conditions that limited the performance of the tests necessary for the study (5 paraplegia, 7 osteosynthesis material 3 chronic use of oral steroids, 2 hemodialysis, 2 exacerbations in the last week) leaving a total of 123 patients who were examined. After carrying out the tests, 68 patients who did not comply with the diagnosis of COPD with post-bronchodilator spirometry confirmation were excluded, resulting in a total of 55 patients for the statistical analysis, a number that exceeded the calculated sample of n = 47 to find significant correlations (Figure 1).

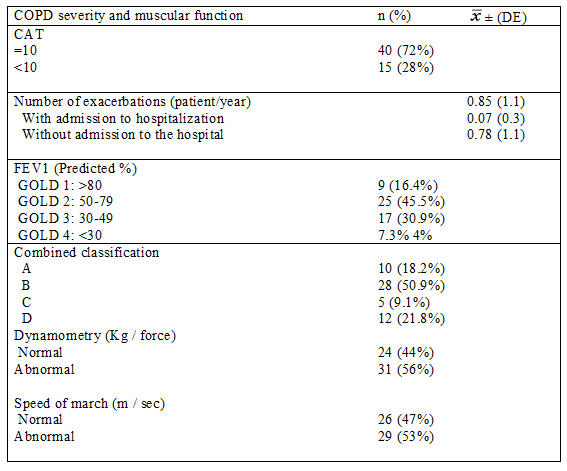
The average age population was 69 years, all had a risk factor for COPD, 88% had a positive history of smoking, 49% had exposure to wood smoke and 40% had a positive history of smoking plus exposure to firewood smoke (Table 1).

The body mass index (BMI) and the FFMI were low in 7.3% (n = 4) and 32.7% (n = 18) respectively (Table 1). Muscle dysfunction was observed in the majority of the population, with decrease in strength in 56.4% (n = 31) and walking speed in 52.7% (n = 29) (Table 2).

In this study, 37% of patients presented a low FFMI. It was a percentage slightly higher than those observed by Vermeren et al in 2006 (26) who described a low FFMI in 27% of the population and of Norden et al, in 2015 who found 36% [27].
It is noteworthy in this study that only 7% of patients were underweight, while 44% were overweight or obese, different from the results of other studies such as those of Hallin et al in 2006, which show percentages of low weight up to 26% and only 29% with overweight and obesity [10].
It is interesting to highlight the functional commitment of more than 50% of the patients, which could be indicating a deterioration of the muscular composition and its function, with risk of loss of autonomy, quality of life and that of the immune function, as different studies related to outcomes of sarcopenia show it. Jones et al in 2015, determined that up to 14.5% of patients with COPD have sarcopenia, and this is associated with reduced exercise capacity, functional performance, physical activity and health status, in comparison with patients without sarcopenia [28].
It is notable that the average of exacerbations was reduced and is below what other studies show, with the possible explanation that, perhaps, the phenotype of the patients, as it seems to be seen in the BMI, may be different from other populations studied or that patients have not accurately reported the retrospective self-report of exacerbations. Zhenchao et al in 2018 conducted a retrospective study with 744 patients with COPD finding an average of 3.8 exacerbations per patient / year [29]. In contrast, Hallin et al in 2006 followed up a total of 42 patients with COPD for 12 months and found an average of 0.58 severe exacerbations per patient / year with a requirement for hospital admission [10].
The positive correlation found between the FFMI and lung function in the subgroup of men, which confirms findings from similar studies such as those of Ischaki et al in 2007 [15], should be emphasized.
Additionally, the direct correlation between manual dynamometry and the clinical condition and quality of life evaluated by CAT confirms previous results of studies such as those of Bernad et al. In support of the importance of muscle function in patients with COPD [7].
Unlike what was reported by Hallin et al in 2006 [10] and Zhenchao et al in 2018 [29], correlation between body composition and number of exacerbations was not observed in this study, which could depend on the low degree of exacerbations reported in these patients.
It is necessary to point out the lack of correlation in women, between FFMI, muscle function and the severity of COPD, while other investigations such as those of Ischaki and cols in 2007 did observe it (15). It would be worthwhile to get a bigger sample in former studies and differentiate different COPD phenotypes to specify if there is any gender inequality or is it a kind of COPD that marks the difference.
In conclusion, it is very important to evaluate fat-free mass and muscle function in patients with COPD, in order to improve the care of these patients.
Acknowledgments
We want to acknowledge the volunteers who responded to the call. We also want to make a special recognition to the working team of the Nutrition, Metabolism and Food Safety group, which actively collaborated in the realization of this research.
Dear Editorial Team, Clinical Medical Reviews and Reports. My experience with the journal was highly positive. The peer-review process was rigorous, constructive, and completed in a timely manner. The reviewers provided valuable comments that helped improve the quality and clarity of our manuscript. The editorial office was professional, responsive, and supportive throughout all stages of the publication process. Communication was clear and efficient, and any questions were addressed promptly. Overall, I found the journal to maintain high scientific standards and an excellent publication workflow. I would be pleased to consider submitting future work to this journal. Best wishes from, Elena Popa.

It was my pleasure to submit my testimonial concerning the Reviewer Board of our Scientific Journal “Brain and Neurological Disorders”. The Reviewers focused on some modifications and their contribution was helpful. The ladies of our Editorial Office were also supported my efforts. It was my honor to have such a co-operation and I am looking forward for more collaboration.

Dear Grace Pierce, Editorial Coordinator of Journal of Clinical Research and Reports, Thank you for the speedy and efficient peer review process. I appreciate the fact that your peer reviewers do not take months to respond like with some other journals. I would also like to thank the editorial office for responding quickly to my questions. It is an excellent journal. I plan to submit more manuscripts in the future. Best wishes from, Robert W. McGee

Dear Grace Pierce, Editorial Coordinator of Journal of Clinical Research and Reports, Working with you and your team on our recent publication in JCRR has been a truly wonderful and enjoyable experience. The responses were prompt, and the reviewers were patient, constructive, and highly professional. One reviewer in particular gave me the feeling that a professor was carefully reading and commenting on my coursework, which was deeply touching. The entire process was straightforward and hassle‑free, with no tedious online forms to complete. I highly recommend this journal. Best wishes from, DR Aibing Rao, Head of R&D

I Appreciate the Opportunity to Share my Experience with the Journal of Clinical Research and Reports. The peer review process was timely and constructive, and the feedback provided helped improve the quality of our manuscript. The editorial office was professional, responsive, and supportive throughout the process, ensuring smooth communication and efficient handling of the submission. Overall, it was a positive experience collaborating with your team.

Dear Mercy Grace, Editorial Coordinator of Obstetrics Gynecology and Reproductive Sciences, We would like to express our gratitude for your help at all stages of publishing and editing the article. The editors of the magazine answer all the necessary questions and help at every stage. We will definitely continue to cooperate and publish other works in the Obstetrics Gynecology and Reproductive Sciences! Best wishes from, Alla Konstantinovna Politova,
