
Research Article | DOI: https://doi.org/10.31579/2640-1045/121
1 professor of inorganic chemistry, chemistry department, faculty of science, south valley university, Egypt
2 professors of physiology and toxicology, zoology department, faculty of science, south valley university, Egypt
3 professor of materials science, Physics department, faculty of science, south valley university, Egypt
*Corresponding Author: Mahmoud Kh. Hassanin. PhD chemistry department, faculty of science, south valley
Citation: Mahmoud Kh. Hassanin. (2022 Biological Effects of Zinc Oxide Nanoparticles on Biochemical Parameters in Diabetic Nephropathy. J. Endocrinology and Disorders. 6(3): DOI:10.31579/2640-1045/121
Copyright: © 2022 Mahmoud Kh. Hassanin, this is an open-access article distributed under the terms of the Creative Commons Attribution License, which permits unrestricted use, distribution, and reproduction in any medium, provided the original author and source are credited.
Received: 13 June 2022 | Accepted: 18 July 2022 | Published: 09 August 2022
Keywords: zinc oxide; nanoparticles; biochemical parameters; diabetic nephropathy
Diabetic nephropathy is the end stage renal disease that occurs as a result of diabetes. Cardiovascular and renal complications share common risk factors such as blood pressure, blood lipids, and glycemic control. Chronic kidney disease may predict cardiovascular disease in the general population. The impact of diabetes on renal impairment changes with increasing age. Serum markers of glomerular filtration rate and microalbuminuria identify renal impairment in different segments of the diabetic population, indicating that serum markers as well as microalbuminuria tests should be used in screening for nephropathy in diabetic people. The American Diabetes Association and the National Institutes of Health recommend Estimated glomerular filtration rate (eGFR) calculated from serum creatinine at least once a year in all people with diabetes for detection of kidney dysfunction. eGFR remains an independent and significant predictor after adjustment for conventional risk factors including age, sex, duration of diabetes, smoking, obesity, blood pressure, and glycemic and lipid control, as well as presence of diabetic retinopathy.
Diabetes mellitus is the major health problem affecting people worldwide. Obesity is all most an important risk factor for diabetes mellitus, hypertension, metabolic disease and chronic renal disease. Diabetic nephropathy (DN) is a serious and progressive complication of diabetes and occurs in 30%-40% of diabetic patients [1].
Diabetes mellitus is one of the major metabolic disorder diseases, afflicting a large proportion of the population all over the world. The changes lead in turn to the development of well-defined clinical entities which most characteristically affect the eye, the kidney and the nervous system. For a long time, the renal diseases have been considered a victim of metabolic syndrome, abnormalities of glucose and lipid metabolism related to insulin resistance [2].
Excess consumption of fat induces hyper secretion of insulin leads to insulin resistance, increases nutrient uptake and subsequently increases the electron flow in the mitochondrial respiratory chain, resulting in an amplified reactive oxygen species (ROS) generation, thereby establishing oxidative stress [3].
This may induce lipotoxicity, morphological changes and tissue injury in the kidney of high fat diet (HFD)- induced mice. Under these conditions, the activation of endogenous enzymatic and non-enzymatic antioxidants may play crucial role in the early defense of the body from the HFD-induced oxidative stress [4]. Insulin resistance, a key pathophysiological feature of metabolic syndrome, is characterized by of higher levels of ROS, oxidative stress and organ injuries [5].
Injuries in the structures of the kidney, leading to changes in renal structure, including glomerular hypertrophy, mesangial expansion, abnormalities of the podocyte foot process, increased glomerular capillary wall tension and vascular abnormalities are observed in obese humans. These changes decrease the glomerular filtration rate and increase proteinuria or albuminuria and worsening of renal function [6].
Once obvious DN occurs, it progresses slowly or rapidly to the most advanced stage of chronic kidney disease (CKD), the progression to end-stage renal disease is irreversible. So, which necessitates dialysis or transplantation for treatment. Although the positive effects on the development and progression of DN through strict control of blood glucose levels [7].
Hyperglycemia initiates, sustains and promotes the progression of DN. Cautious maintenance of controlled glycemia is the most effective means to delay the onset of DN. Along with the control of blood glucose other factors such as inflammation, hypoxia, and hyperlipidemia may all play important roles. However, each of these factors is initially triggered by higher blood glucose levels [8].
Diabetes mellitus (DM) is the most frequent cause of chronic kidney failure in both developed and developing countries [9]. Diabetic nephropathy, also known as Kimmelstiel-glomerulosclerosis or Wilson syndrome or nodular diabetic intercapillary glomerulonephritis, is a clinical syndrome characterized by albuminuria (>300 mg/day or >200 mcg/min) confirmed on at least two occasions 3-6 months apart, permanent and irreversible decrease in glomerular filtration rate (GFR), and arterial hypertension [10].
Chemicals and Reagents
Zinc nitrate Zn (NO3)2. 6 H2O molecular weight (297.48 g.) was obtained from Sigma Chemical Co. (St. Louis, Mo U.S.A.).
Sodium hydroxide NaOH molecular weight (40 g.) was obtained from Sigma Chemical Co. (St. Louis, Mo U.S.A.).
Acetone and methanol were obtained from Al Mottahedoon pharma (Egypt). ZnO nanoparticle and suspended in sterile sodium chloride solution (NaCl 0.9 %) was obtained from Al Mottahedoon pharma (Egypt). Distilled deionized water. Ethylene diamin tetra acetic acid (EDTA) was obtained from Al Mottahedoon pharma (Egypt). Alloxan monohydrate was obtained from Sigma Chemical Co. (St. Louis, Mo U.S.A.). Metformin HCl was obtained as cidofage retard 850 mg tablets from CID Co., (Egypt). Hydrochloric acid (HCl) was obtained from Al Mottahedoon pharma (Egypt).
Synthesis of ZnO nanoparticles
ZnO NPs were prepared according to the method described by Moghaddam and Coworkers. 0.45 M aqueous solution of Zn (NO3)2-4H2O and a 0.9 M aqueous solution of sodium hydroxide (NaOH) were prepared in distilled water. Then, the beaker containing NaOH solution was heated at a temperature of approximately 55 ºC. The Zn (NO3)2 solution was added drop wise (slowly for 40 min) to the above heated solution under high-speed stirring. After 1 h of stirring the mixture was transferred to Teflon lined stainless steel autoclave and treated at 150 ºC for 24 h, then the autoclave was allowed to cool to room temperature naturally. The precipitation was filtered out, washed several times by ethanol and distilled water, and then dried at 60 ºC [11].
Characterization of ZnO oxide nanoparticles:
Microstructure properties of ZnO nanoparticles:
Figure (1) shows the XRD pattern for the prepared sample. It is obvious from the figure that the prepared sample characterized by seven mean peaks (100), (002), (101), (102), (110), (103) and (112) which refer to hexagonal ZnO phase. The spectra confirm the crystalline nature of the prepared sample.
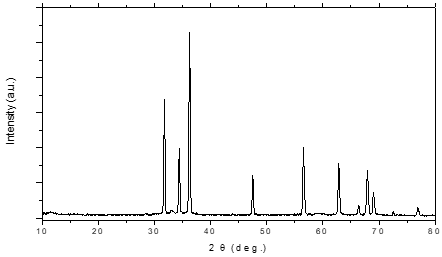
Figure 1: XRD for ZnO nanoparticles
The lattice parameters for the obtained sample were calculated to be a = 3.250 Å, and c = 5.205 Å, according to:

As the lattice parameters for the standard ZnO is a = 3.242 Å and c = 5.2066 Å. These results verify the identity between the grown crystals and the standard one.
The crystallite size (D) of the obtained ZnO nanoparticles was calculated to be 20.910 nm from the Debye–Scherrer’s formula:

Where Γ is the full width at half-maximum, Dsize is the column length i.e., The lengths of columns of cubic cells aligned perpendicular to the set of
diffracting lattice planes and λ and θ are the wavelength of X-ray and the diffraction angle, respectively.
3.2 FTIR analysis for ZnO nanoparticles
The FTIR spectra of the prepared samples are shown in Fig. (2). The band between 450 - 500 cm-1 is correlated to metal oxide bond (ZnO). The peaks in the range of 1400-1500 cm-1 corresponds to the C=O bonds. The adsorbed band at 1626 cm-1 is assigned O-H bending vibrations. The peak at 1319 cm-1and 1530cm-1 corresponds to C=O and O-H bending vibrations respectively.
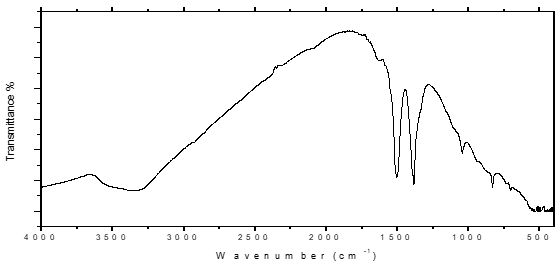
Figure 2: FTIR Image for the obtained ZnO nanoparticles
Morphology of the prepared ZnO nanoparticles
The morphology of the prepared samples for ZnO nanoparticles was observed by scanning electron microscopy (SEM) and transmission electron microscopy (TEM). Since TEM is the best way to investigate nanoparticle size and shape, so that it was employed to obtain direct information about the size of the produced ZnO sample. Figure (3) displays typical TEM image of the grown ZnO sample. The average particle size was found to be 19.83 nm. As shown from the TEM and SEM analysis the prepared nanoparticles have nanoplates morphology.

Figure 3: TEM Image for the obtained ZnO nanoparticles

Figure 4: SEM Image for the obtained ZnO nanoparticles
Experimental animals
One hundred (10 – 12) weeks old healthy Wistar albino rats (obtained from faculty of medicine animal house, Assiut University, Egypt), weighing 180 – 200 gm. Animals were given standard rat diet from El-Nasr, Cairo, Egypt and tap water ad libitum. The rats were housed singly in temperature about 20 – 25 °C (23±2 ºC). Rats were housed in cages under light period 7.00 a.m. to 7.00 p.m. relative humidity 55%.
Experimental design
Animals were randomly divided into ten groups, (n=10 rats/group).
Male and female groups rats in each (n=50 rats):
Group І: (n=10 rats) served as (Normal group): the rats were intraperitoneally injected (i.p.) with 0.9% isotonic saline solution at a dose of 130 mg/kg body weight.
Group 2: (n= 40 rats) the rats were intraperitoneally injected (i.p.) with alloxan monohyderate at a dose of 130 mg/kg body wt. per day in sterile (0.9%) isotonic saline for seven days. After one week of alloxan injection (diabetes induction), blood samples were collected from medial canthus vein and blood glucose was determined. Rats with blood glucose above 220 mg/dL were considered diabetic while rats with blood glucose under 200 mg/dL were excluded from the experiment. Rats in group 2 were divided into four subgroups as follow:
Subgroup 1 (diabetic group): (n= 10 rats) the rats were considered (Control group) diabetic rats were left not treated.
Subgroup 2 (treated group): (n= 10 rats) the rats were considered diabetic rats treated with metformin hydrochloride aqueous solution orally administration wherein stomach tube at a dose of 350 mg/kg body wt. per day.
Subgroup 3 (treated group): (n= 10 rats) the rats were considered diabetic rats treated with ZnO nano particles suspension orally administration wherein stomach tube at a dose of 10 mg/kg body wt. per day.
Subgroup 4 (treated group): (n= 10 rats) the rats were considered diabetic rats treated with metformin hydrochloride aqueous solution orally administration wherein stomach tube at a dose of 350 mg/kg body wt. per day followed by ZnO nanoparticles suspension orally administration wherein stomach tube at a dose of 10 mg/kg body wt. per day.
Collection and preparation of samples
Urine samples of 24 hours were collected in metabolic cages at the end of the 12-week treatment. The urine samples were used to calculate urinary creatinine, and urinary protein (Upro). At the end of the experimental period, the rats were killed, and blood samples were obtained from each rat for the determination of blood biochemistry parameters.
Measurement of physiological, biochemical, and renal functional parameters Blood glucose levels were determined by using available commercially kit. Serum creatinine (Scr), blood urea nitrogen (BUN), and the 24-hour content of Upro were determined using available commercially kit. Urine creatinine was analyzed by the modified Jaffe method using a commercially available assay kit (spectrum chemical, Cairo, Egypt).
At the end of the experimental period, the rat’s male and female were killed, and blood samples were obtained from each rat for the determination of blood biochemistry parameters. Biochemical Assay:
The serum biochemical levels, including blood glucose (fasting, postprandial after 30, 60, 120 min.), blood urea, creatinine (CR), uric acid (UA), albumin creatinine ratio (ACR) and sodium. were assayed by an semi-automatic biochemical analyzer (pritest Robonk , India).
In this study, blood glucose levels were significantly increased in diabetic rats while BGL significantly reduced in all rat’s diabetic treated by metformin HCl, ZnO NPs and both of them as the previous studies (12).
As Fig. 5 (a,b) shows, diabetic significantly increased blood glucose in fasting, postprandial after 30 min., 60 min., 120 min. and HbA1c compared with the controls (P < 0>
in fasting, postprandial after 30 min., 60 min., 120 min. and HbA1c (P = 0.019) compared with the diabetic rats.
blood urea, serum creatinine, serum uric acid and serum sodium levels were significantly increased in diabetic rats while these levels significantly reduced in all rats (male and female) diabetic treated by metformin HCl, ZnO NPs and both of them.
As Fig. 6 and 7 (a,b) shows, diabetic significantly increased blood urea, creatinine, uric acid, U creatinine and U protein compared with the controls (P < 0 xss=removed>
While eGFR appears significantly decrease in all diabetic rats as fig.6 (a) and 7 (b) as in the previos studies demonstrated these results.15-17
HbA1c as fig. (8) shows significantly increase in diabetic rats while appears significantly decrease in diabetic rats after administration of ZnO NPs and Metformin HCl
Sodium as fig (9) as effect of ZnO NPs in diabetic rats shows significantly increase sodium levels while significantly decrease in diabetic treated via ZnO NPs and metformin HCl.
DN is currently the leading cause of end-stage renal disease and one of the major causes of morbidity and mortality in diabetic patients worldwide. Unfortunately, nephrologists still face the challenge of providing diabetic patients with effective protection against the development and progression of DN since current therapies only retard its progression but do not stop it. ZnO NPs has overcome its bad reputation, and has recently been demonstrated in several in vitro studies to possess important therapeutic properties including anti-diabetic characteristics, and thus prevents the development and progression of DN. Therefore, ZnO NPs may represent an alternative or additional approach for the treatment of DN in the future.

Figure 5: (a) Effect of ZnO NPs (10mg/kg/day) and metformin HCl (350mg/kg/day) on Blood glucose levels on diabetic rats

Figure 5: (b) Effect of ZnO NPs (10mg/kg/day) and metformin HCl (350mg/kg/day) on Blood glucose levels on diabetic rats
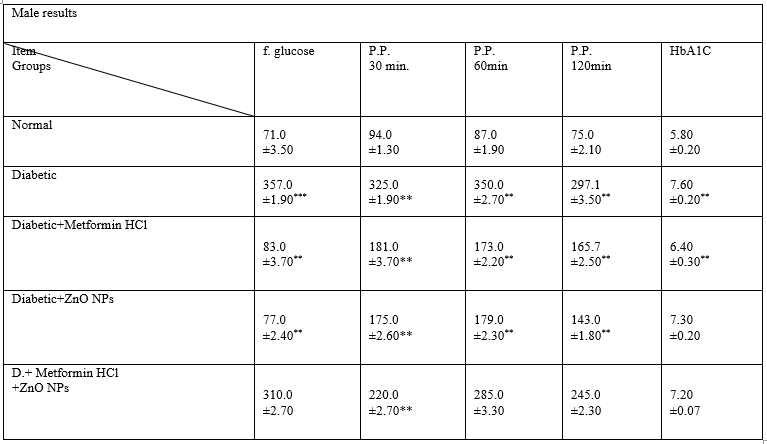
Table 1: Effect of ZnO NPs (10mg/kg/day) and metformin HCl (350mg/kg/day) on Blood glucose levels on male diabetic rats
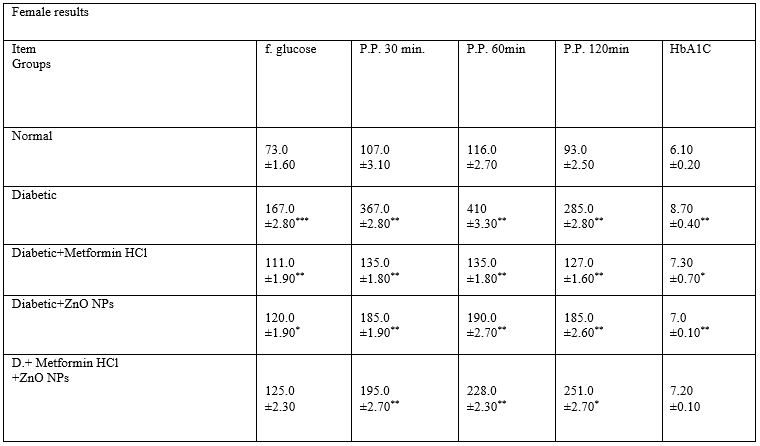
Table 2: Effect of ZnO NPs (10mg/kg/day) and metformin HCl (350mg/kg/day) on Blood glucose levels in female diabetic rats
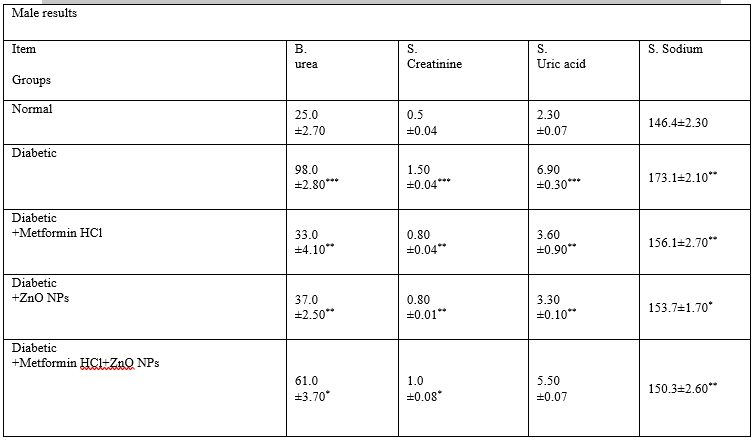
Table 3: Effect of ZnO NPs (10mg/kg/day) and metformin HCl (350mg/kg/day) on B. urea, s. creatinine, s. uric acid and s. sodium levels in male diabetic rats
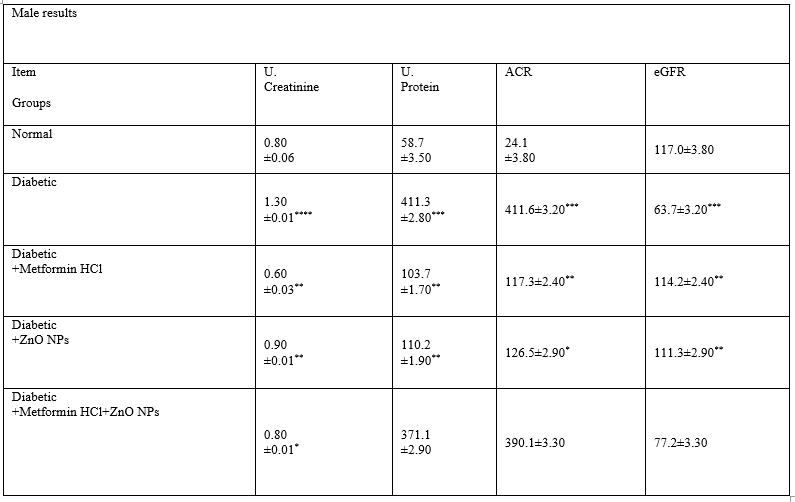
Table 4: Effect of ZnO NPs (10mg/kg/day) and metformin HCl (350mg/kg/day) on U. creatinine, U protein, ACR and eGFR levels on male diabetic rats

Table 5: Effect of ZnO NPs (10mg/kg/day) and metformin HCl (350mg/kg/day) on B. urea, s. creatinine, s. uric acid and s. sodium levels on female diabetic rats
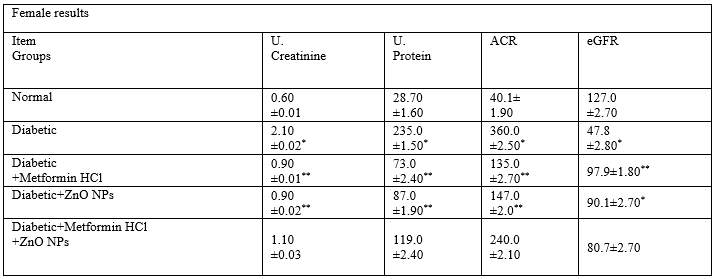
Table 6: Effect of ZnO NPs (10mg/kg/day) and metformin HCl (350mg/kg/day) on U. creatinine, U protein, ACR and eGFR levels in female diabetic rats

Figure 6: (a) Effect ZnO NPs (10mg/kg/day) and metformin HCl (350mg/kg/day) on Blood urea, U. creatinine, U. protein, ACR and eGFR levels on diabetic rats.

Figure 6: (b) Effect ZnO NPs (10mg/kg/day) and metformin HCl (350mg/kg/day) on s. creatinine and serum uric acid levels in male diabetic rats.
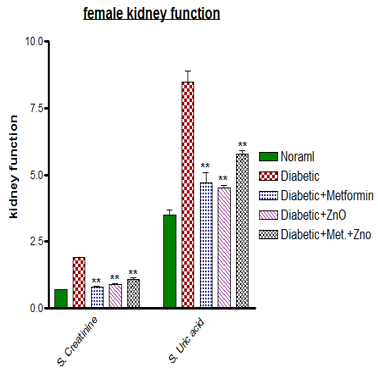
Figure 7: (a) Effect ZnO NPs (10mg/kg/day) and metformin HCl (350mg/kg/day) on s. creatinine and serum uric acid levels in female diabetic rats.

Figure 7: (b) Effect ZnO NPs (10mg/kg/day) and metformin HCl (350mg/kg/day) on Blood urea, U. creatinine and U. protein, ACR and eGFR levels on diabetic rats.

Figure 8: Effect ZnO NPs (10mg/kg/day) and metformin HCl (350mg/kg/day) on Glycosylated haemoglubin levels in male and female diabetic rats.

Figure 9: Effect ZnO NPs (10mg/kg/day) and metformin HCl (350mg/kg/day) on serum sodium concentrations in male and female diabetic rats
Dear Editorial Team, Clinical Medical Reviews and Reports. My experience with the journal was highly positive. The peer-review process was rigorous, constructive, and completed in a timely manner. The reviewers provided valuable comments that helped improve the quality and clarity of our manuscript. The editorial office was professional, responsive, and supportive throughout all stages of the publication process. Communication was clear and efficient, and any questions were addressed promptly. Overall, I found the journal to maintain high scientific standards and an excellent publication workflow. I would be pleased to consider submitting future work to this journal. Best wishes from, Elena Popa.

It was my pleasure to submit my testimonial concerning the Reviewer Board of our Scientific Journal “Brain and Neurological Disorders”. The Reviewers focused on some modifications and their contribution was helpful. The ladies of our Editorial Office were also supported my efforts. It was my honor to have such a co-operation and I am looking forward for more collaboration.

Dear Grace Pierce, Editorial Coordinator of Journal of Clinical Research and Reports, Thank you for the speedy and efficient peer review process. I appreciate the fact that your peer reviewers do not take months to respond like with some other journals. I would also like to thank the editorial office for responding quickly to my questions. It is an excellent journal. I plan to submit more manuscripts in the future. Best wishes from, Robert W. McGee

Dear Grace Pierce, Editorial Coordinator of Journal of Clinical Research and Reports, Working with you and your team on our recent publication in JCRR has been a truly wonderful and enjoyable experience. The responses were prompt, and the reviewers were patient, constructive, and highly professional. One reviewer in particular gave me the feeling that a professor was carefully reading and commenting on my coursework, which was deeply touching. The entire process was straightforward and hassle‑free, with no tedious online forms to complete. I highly recommend this journal. Best wishes from, DR Aibing Rao, Head of R&D

I Appreciate the Opportunity to Share my Experience with the Journal of Clinical Research and Reports. The peer review process was timely and constructive, and the feedback provided helped improve the quality of our manuscript. The editorial office was professional, responsive, and supportive throughout the process, ensuring smooth communication and efficient handling of the submission. Overall, it was a positive experience collaborating with your team.

Dear Mercy Grace, Editorial Coordinator of Obstetrics Gynecology and Reproductive Sciences, We would like to express our gratitude for your help at all stages of publishing and editing the article. The editors of the magazine answer all the necessary questions and help at every stage. We will definitely continue to cooperate and publish other works in the Obstetrics Gynecology and Reproductive Sciences! Best wishes from, Alla Konstantinovna Politova,
