
Research Article | DOI: https://doi.org/10.31579/2692-9759/111
1 Kermanshah University of Medical Sciences, College in Kermanshah, Iran.
2 Sulaimani polytechnic university, Kurdistan Region, Iraq.
*Corresponding Author: Yahya Pasdar, Kermanshah University of Medical Sciences, College in Kermanshah, Iran.
Citation: Kamari N., Hawal L. Fateh, Darbandi M., Najafi F., Pasdar Y., et al., (2023), Association Between the Triglyceride-Glucose Index and The Risk of Cardiovascular Disease in Kurdish Adult: Result from RANCD Cohort Study, Cardiology Research and Reports. 5(5); DOI:10.31579/2692-9759/111
Copyright: © 2023, Yahya Pasdar. This is an open-access article distributed under the terms of the Creative Commons Attribution License, which permits unrestricted use, distribution, and reproduction in any medium, provided the original author and source are credited.
Received: 20 October 2023 | Accepted: 06 November 2023 | Published: 15 November 2023
Keywords: triglyceride glucose index; cardiovascular disease; persian cohort
Background: The triglyceride-glucose (TyG) index, a consistent content for insulin resistance, has been related to cardiovascular disease (CVD). We aimed to perused the relationship between the TyG index and development of CVD in Kurdish adults.
Materials and Methods: In this cross-sectional study, data was used from the Ravansar Noncommunicable Diseases (RaNCD) Cohort Study. Subjects with a history of stroke, myocardial infarction, or coronary artery disease, or who were currently receiving medications for these conditions, were classified as CVD patients.
Results: The research comprised 9723 individuals overall (51.76% of whom were female, mean age 47.3 ±8.26 year). We found that the TyG index in CVD patients (8.82±0.81) was substantially higher than that in non-CVD patients (P=0.001), and the top quartile of the TyG had significantly more BMI (28.73±4.20), TG (239.45±103.30), and FBS (117.85±50.36) values than the lowest quartiles (P=0.001). The TyG and CVD showed a positive association according to the cohort data. The chances of CVD were 2.54 (95% CI: 2.16-2.98) times higher in the fourth tertile of the TYG index than in the first tertile. After controlling for confounding factors, their association was still significant (OR: 1.58, 95%Ci: 1.35-1.95). The predictive value of the TYG score was 63% for females and 57% for males, according to ROC curve research.
Conclusion: According to the findings, risk of cardiovascular disease was linearly correlated with the triglyceride glucose index. Moreover, the TyG may be more accurate predictor of CVD in female.
Many variables, including diabetes and chronic renal disease, have an impact on the prevalence of cardiovascular disease (CVD), adding a significant financial bar on the national health system [1]. In order to minimize the occurrence of cardiovascular disease and comorbidities, it is necessary to identify the population at risk for the condition.
With the recent rise in living standards, the burst of type 2 diabetes mellitus (T2DM) and insulin resistance (IR) has significantly grown [2]. T2DM recognized as a risk factor that influences the development of CVD and treatment options [3]. The development of diabetic mellitus (DM) is mostly attributed to IR, which is also recognized as a risk factor for CVD [4]. Also, it has been shown that fasting glucose and TG levels within the high normal range may indicate a person's risk of developing a cardiovascular disease [5, 6]. Thus, it may be clinically necessary to assess the combined value of TG and fasting glucose in individuals who had stable coronary artery disease (CAD). The triglyceride glucose index (TyG) is a new measure with high sensitivity to detect metabolic syndrome [7]. Previous studies approved correlation between the TyG index and the onset coronary artery stenosis, coronary artery calcification, and carotid artery atherosclerosis, despite the attendance of diabetes [8]. An elevated TyG index is independently associated with a higher risk of myocardial infarction (MI), according to a large study conducted in China, highlighting the need to monitor TyG index to identify individuals at high risk of myocardial infarction [9]. Prospective cohort studies on the relationship between the TyG index and newly diagnosed cardiovascular disease are currently missing. Owing to the rise in CVD prevalence, thus aim of the current study was to explore the association between the TyG index and the risk of developing CVD in subjects of the Ravansar Non-Communicable Diseases (RaNCD) cohort study, in Kermanshah, Iran.
Study design and participants
This cross-sectional study was conducted in 2018 in western Iran using baseline data from the Ravansar Noncommunicable Disease (RaNCD) Cohort Study. A total of 10047 subjects were enrolled in the RaNCD as part of prospective epidemiological studies in various Iranian ethnic groups conducted in collaboration with the Ministry of Health and Medical Education. The sampling process was based on the capitation.
One of the cities in the province of Kermanshah is Ravansar. The largest and most significant Kurdish settlement in western Iran is located in the provincial capital of Kermanshah, which has a population of around a million people. Over 50,000 people live in the rural and urban regions of the Ravansar district, with 30% of them being between the ages of 35 and 65 and mostly being of Iranian Kurdish ethnicity.
Written and verbal informed permission was obtained from each participant who matched the inclusion criteria. The cohort study's eligibility requirements were being between the ages of 35 and 65, permanently residing in Ravansar area and be Iranian. Excluded are those who do not wish to participate in the study, stay in Ravansar less than nine months a year, have recently moved to Ravansar (less than one year), cannot come to the cohort center or cannot speak with the interviewers (physical. or physical disabilities due to stupidity, deafness, blindness, severe psychiatric illness due to mental disability). 324 participants in this research Excluded, including 83 persons with cancer, 44 with renal failure, and 138 women who were pregnant. This study also contains 59 missing data points. In the end, 9,723 participants were choosing to take part in the study. Alcohol use and be smoker or not, were evaluated by a self-completed questionnaire. Based on their smoking history, participants were divided into current and past smokers. For drinking alcohol, a question with two possible answers (yes or no) was used. The study's design and justification in its entirety have already been published [10].
Measurements
A bioimpedance analyzer (Inbody 770, Inbody Co, Seoul, Korea) was used to determine body weight to the nearest 0.5 kg. BSM 370 (Biospace Co, Seoul, Korea) was used to measure height. The formula for determining a person's body mass index (BMI) is to multiply their weight in kilograms by the square of their height (in meters). WC was measured to the nearest 0.5 cm using a flexible measuring tape at a point halfway between the lower edge of the ribs and the iliac crest. The WHR was decided by the BIA.
After each participant had rested for 10 minutes, blood pressure (BP) was measured in a seated position using a sphygmomanometer (Reister), cuff, and stethoscope (Reister), with a 5-minute shatter between each measurement. The average of the three measurements was then used to calculate blood pressure. In the cohort study, blood samples were taken from the antebrachial vein with sterile infusion tubing and syringes after 8–12 hours of fasting. Using commercially available kits and following the manufacturer's instructions, we tested serum's TG, TC, LDL, and HDL concentrations as well as the patient's fasting blood sugar levels. A standardized cohort study questionnaire based on met/hour per day was used to measure physical activity [11].
TyG index calculation and the study outcomes
TyG index was evaluated based on the TG and FBG concentration according to the equation: ln [TG (mg/ dl) ×FBG (mg/dl)/2] [12, 13]. People are considered to have a CVD, under the RaNCD cohort study protocol, if they have ever received treatment for one or more heart conditions such as stroke, heart attack or coronary artery disease, or if they are currently taking medication to treat them [14].
The investigation made use of STATA software version 14.2 (Stata Corp, College Station, TX, USA). The significance level was set at 0.05. Results for the quantitative and qualitative components were presented as mean SD and percentage (frequency), respectively.
Characteristics of subjects with cardiovascular disease were compared using Chi-square and T-tests. We used one-way ANOVA and Chi-square testing to examine variations in the TYG index.
Logistic regression analysis was used to compute odds ratios (OR) and 95% confidence intervals (CI) for the association between TyG index and CVD risk. Model 1 wasn’t adjusted. Model 2 was adjusted for age and gender. Model 3 was modified to account for Variants and behavioral factors from Model 2 (smoking, alcohol consumption, physical activity and SES). Model 4 also has modifications for traits including age, sex, behavioral factors and metabolic factors (systolic and diastolic blood pressure, body mass index), T2DM, Renal Failure and Energy.
When comparing predictive validity, use receiver operating characteristic (ROC) analysis to determine the best cutoffs. sensitivity (true positive rate) and specificity measurements were performed to generate ROC curves based on FBS, TG, and TyG cutoffs (False positive rate). The ROC curves demonstrated the diagnostic test's overall discriminating power over the whole range of test results. A test's diagnostic effectiveness is measured by the zone under the ROC curve (AUC). A test that works flawlessly has an AUC of 1.0, while a test that performs at least as well as chance has an AUC of 0.5. AUC 0.60 was thought to have subpar diagnostic performance [15]. The FBS, TG, and TyG with the highest Youden index [(sensitivity specificity)1] were approved to have the highest sensitivity and specificity for every risk factor [16].
Baseline characteristics
Of the 9723 studied, 5033 (51.76%) were female. The mean age of patients was 47.30 ± 8.26 years. Almost 47% of subject had moderate physical activity and 33.54% had high Socioeconomic status. 1135 (11.73%) of participants were smoker. A total of 1,632 participants were diagnosed with CVD. Compared with non-CVD participants, those with CVD tended to be older and female. The mean TyG index in CVD group was 8.82 ± 0.81 that significantly was higher than non-CVD group (8.60 ± 0.58) (p = < 0.001). Also, observed BMI (28.75 ± 4.64), SBP (119.39 ± 119.39), TG (150.19 ± 87.97), FBS (107.72 ± 40.12) and BUN (14.17 ± 4.41) were higher in CVD group than another group (p = < 0.001) (Table 1)
| Variables | Total (n = 9,723) | non-CVD (n = 8,091) | CVD (n= 1,632) | P value* |
| Mean ± S.D or Frequency (%) | ||||
| Age (year) | 47.30 ± 8.26 | 46.09 ± 7.82 | 53.29 ± 7.74 | < 0.001 |
| Gender, n (%) | ||||
| Male | 4690 (48.24) | 4115 (50.86) | 575 (35.23) | < 0.001 |
| Female | 5033 (51.76) | 3976 (49.14) | 1057 (64.77) | |
| Place ofresidence, n (%) | ||||
| Rural | 3905 (40.16) | 3206 (39.62) | 699 (42.38) | 0.016 |
| Urban | 5818 (59.84) | 4885 (60.38) | 933 (57.17) | |
| Socioeconomic status, n (%) | ||||
| Low | 3206 (32.99) | 2560 (31.66) | 646 (39.58) | < 0.001 |
| Moderate | 3253 (33.47) | 2701 (33.40) | 552 (33.82) | |
| High | 3260(33.54) | 2826 (34.94) | 434 (26.59) | |
| Physical Activity (met/hour per day), n (%) | ||||
| Light | 2935 (30.19) | 2342 (28.95) | 593 (36.34) | < 0.001 |
| Moderate | 4607 (47.38) | 3823 (47.25) | 784 (48.04) | |
| High | 2181 (22.43) | 1926 (23.80) | 255 (15.63) | |
| Smoking status,n (%) | ||||
| Current smoker | 1135 (11.73) | 998 (12.40) | 137 (8.45) | < 0.001 |
| Former smoker | 851 (8.80) | 650 (8.07) | 201 (12.39) | |
| Drinking, n (%) | 477 (4.91) | 417 (5.15) | 60 (3.68) | 0.012 |
| Body MassIndex (kg/m2) | 27.48 ± 0.04 | 27.23 ± 4.59 | 28.75 ± 4.64 | < 0.001 |
| Waist hip ratio | 0.94 ± 0.06 | 0.93 ± 0.06 | 0.95 ± 0.06 | < 0.001 |
| Percent Body Fat | 33.77 ± 9.48 | 33.02 ± 9.45 | 37.55 ± 8.73 | < 0.001 |
| Visceral Fat Area | 122.03 ± 51.56 | 118.06 ± 50.88 | 141.84 ± 50.39 | < 0.001 |
| SBP (mmHg) | 108.26 ± 16.97 | 106.01 ± 15.24 | 119.39 ± 119.39 | < 0.001 |
| DBP (mmHg) | 69.86 ± 9.90 | 68.86 ± 9.29 | 74.83 ± 11.25 | < 0.001 |
| BUN (mg/dl) | 13.57 ± 4.01 | 13.45 ± 3.91 | 14.17 ± 4.41 | < 0.001 |
| Creatinine (mg/dl) | 0.99 ± 0.18 | 0.98 ± 0.18 | 0.99 ± 0.19 | 0.041 |
| LDL (mg/dl) | 111.5 ± 31.27 | 111.63 ± 30.88 | 111.12 ± 33.11 | 0.546 |
| HDL (mg/dl) | 46.33 ± 11.31 | 46.35 ± 11.31 | 46.25 ± 11.32 | 0.739 |
| TG (mg/dl) | 137.49 ± 84.16 | 134.92 ± 83.14 | 150.19 ± 87.97 | < 0.001 |
| TC (mg/dl) | 185.30 ± 37.74 | 184.90 ± 37.28 | 187.27 ± 39.91 | 0.021 |
| FBS (mg/dl) | 97.06 ± 29.79 | 94.91 ± 26.73 | 107.72 ± 40.12 | < 0.001 |
| TYG | 8.63 ± 59.90 | 8.60 ± 0.58 | 8.82 ± 0.81 | < 0.001 |
Table 1: The baseline characteristics of participants classified by CVD.
Data are shown mean ± D for continuous variables and n (%) categorical variables. *P- value was obtained t-test and Chi square test
Abbreviation: TyG-index triglyceride and glucose index, WC waist circumference, BMI body mass index, SBP diastolic blood pressure, DBP diastolic blood pressure FBS fast blood sugar, TC total cholesterol, TG total three glyceride, LDL-C low-density lipoprotein cholesterol, HDL-C high-density lipoprotein cholesterol
About 54% of people that was in the highest quartile of TyG was men and, about F had moderate physical activity. Also, people with the highest TyG index significantly drink more alcohol (p = 0.008) than people in the lowest level. Compared to Q1 group, BMI (28.73 ± 4.20) in quartile 4 significantly was higher than quartile 1 group (p = < 0.001). It is noteworthy that in Q4 group TG (239.45 ± 103.30) and FBS (117.85 ± 50.36) were higher than Q1 group (p = < 0.001). Also observed that SBP (112.33 ± 17.56) and Creatinine (1.02 ± 0.17), were significantly high in Q4 group of TyG index (p = < 0.001) (Table 2).
| Variables | TYG index | P value | |||
| Q1 | Q2 | Q3 | Q4 | ||
| n (%) | 2431(25.00) | 2431(25.00) | 2431(25.00) | 2430(24.99) | |
| Mean ± SD | 7.92 ± 0.249 | 8.41 ± 0.105 | 8.78 ± 0.115 | 9.42 ± 00.389 | |
| Age (year) | 45.86 ± 8.18 | 47.03 ± 8.25 | 47.72 ± 8.25 | 48.60 ± 8.11 | < 0.001 |
| Gender, n (%) | |||||
| Male | 1049 (43.15) | 1108 (45.58) | 1210 (49.77) | 1323 (54.44) | < 0.001 |
| Female | 1382 (56.85) | 1323 (54.42) | 1221 (50.23) | 1107 (45.56) | |
| Place ofresidence, n (%) | |||||
| Rural | 1013 (41.67) | 966 (39.74) | 936(38.50) | 990 (40.74) | 0.132 |
| Urban | 1418 (58.33) | 1465 (60.26) | 1495 (61.50) | 1440 (59.26) | |
| Socioeconomic status, n (%) | |||||
| Low | 842 (34.64) | 833 (34.28) | 752 (30.95) | 779 (32.08) | 0.007 |
| Moderate | 838 (34.47) | 799 (32.88) | 818 (33.66) | 798 (32.87) | |
| High | 751 (30.89) | 798 (32.84) | 860 (35.39) | 851 (35.05) | |
| Physical Activity (met/hour per day),n (%) | |||||
| Light | 552 (22.71) | 739 (30.40) | 804 (33.07) | 840 (34.57) | < 0.001 |
| Moderate | 1213(49.90) | 1148 (47.22) | 1116(45.91) | 1,130 (46.50) | |
| High | 666 (27.40) | 544 (22.38) | 511 (21.02) | 460 (18.93) | |
| Smoking status,n (%) | |||||
| Current smoker | 246 (10.18) | 287 (11.88) | 292 (12.06) | 310 (12.82) | < 0.001 |
| Former smoker | 172 (7.12) | 179 (7.41) | 235 (9.71) | 265 (10.96) | |
| Drinking, n (%) | 107 (4.40) | 99 (4.07) | 124 (5.10) | 147 (6.05) | 0.008 |
| Body Mass Index (kg/m2) | 25.53 ± 4.46 | 27.32 ± 4.74 | 28.36 ± 4.44 | 28.73 ± 4.20 | < 0> |
| Waist hip ratio | 0.91 ± 0.06 | 0.93 ± 0.06 | 0.95 ± 0.06 | 0.95 ± 0.05 | < 0> |
| Percent Body Fat | 31.26 ± 10.19 | 33.99 ± 9.66 | 35.06 ± 9.01 | 34.79 ± 8.50 | < 0> |
| Visceral Fat Area | 104.39 ± 51.28 | 121.57 ± 52.55 | 131.28 ± 50.26 | 130.91 ± 47.38 | < 0> |
| SBP (mmHg) | 103.62 ± 16.20 | 106.90 ± 16.02 | 110.17 ± 16.78 | 112.33 ± 17.56 | < 0> |
| DBP (mmHg) | 67.55 ± 9.25 | 69.15 ± 9.58 | 70.75 ± 9.85 | 71.98 ± 10.32 | < 0> |
| BUN (mg/dl) | 13.92 ± 4.21 | 13.47 ± 4.00 | 13.38 ± 3.89 | 13.51 ± 3.90 | < 0> |
| Creatinine (mg/dl) | 0.96 ± 0.15 | 0.97 ± 0.23 | 0.99 ± 0.17 | 1.02 ± 0.17 | < 0> |
| LDL (mg/dl) | 100.08 ± 27.25 | 112.92 ± 29.10 | 119.08 ± 30.02 | 114.09 ± 30.00 | < 0> |
| HDL (mg/dl) | 51.56 ± 11.64 | 47.87 ± 10.92 | 44.62 ± 10.20 | 41.28 ± 9.72 | < 0> |
| TG (mg/dl) | 66.71 ± 15.06 | 101.91 ± 14.81 | 141.92 ± 23.01 | 239.45 ± 103.30 | < 0> |
| TC (mg/dl) | 164.97 ± 31.28 | 181.16 ± 32.97 | 192.09 ± 34.28 | 202.99 ± 40.86 | < 0> |
| FBS (mg/dl) | 85.94 ± 8.44 | 90.12 ± 10.52 | 94.34 ± 4.91 | 117.85 ± 50.36 | < 0> |
Table 2: Comparison of the demographic characteristics, behavioral factors and biochemical indices between quartiles of TYG subgroups.
*P- value was obtained one-way ANOVA and Chi square test
Abbreviation: TyG-index triglyceride and glucose index, WC waist circumference, BMI body mass index, SBP diastolic blood pressure, DBP diastolic blood pressure FBS fast blood sugar, TC total cholesterol, TG total three glyceride, LDL-C low-density lipoprotein cholesterol, HDL-C high-density lipoprotein cholesterol
Association between TyG index groups and CVD
The results of logistic regression analysis are presented in Table 3. Univariate logistic regression analysis showed a statistically significant correlation between TyG index and CVD. Data from Model 4 showed that the risk of cardiovascular disease increased with increasing TyG index. Compared to Q1 group as reference, those on Q2 group had an odd of 1.16 (95% CI: 0.96–1.41) times more to CVD. In the following Q3 group 1.31 (95% CI :1.09–1.58) and Q4 group 1.58 (1.35–1.95) times had more odds of CVD than Q1 group (p = < 0.001).
| TYG | Model 1 | Model 2 | Model 3 | Model 4 |
| OR (95%CI) | OR (95%CI) | OR (95%CI) | OR (95%CI) | |
| Q1 | Ref | Ref | Ref | Ref |
| Q2 | 1.43 (1.20–1.69) | 1.31 (1.09–1.57) | 1.28 (1.07–1.53) | 1.11 (0.92–1.34) |
| Q3 | 1.89 (1.60–2.22) | 1.69 (1.42–2.02) | 1.63 (1.37–1.94) | 1.27 (1.06–1.53) |
| Q4 | 2.54 (2.16–2.98) | 2.23 (1.88–2.64) | 2.14 (1.80–2.54) | 1.58 (1.35–1.95) |
| P valuetrend | < 0.001 | < 0.001 | < 0.001 | < 0.001 |
Table 3: The association between TyG index groups and CVD.
Model 1: Unadjusted.
Model 2: Adjusted for age and sex.
Model 3: Adjusted for age, sex and behavioral factors (smoking status, alcohol intake, physical activity and SES)
Model 4: Adjusted for age, sex, behavioral factors and metabolic factors (systolic and diastolic blood pressure, body mass index), T2DM, Renal Failure and Energy.
ROC Curve of the Risk CVD According to FBS, TG and TyG Index
To determine the predictive value of FBS, TG and TyG index for CVD, analysis of the area under the ROC curve was performed, the predictive power of TYG index was 57% in male and 63% in female. While the predictive power of FBS in male 61% and 63% in female. Also, predictive power for TG was performed, in male was about 53% and in female was about 59%, respectively. (Figures 1 and 2).
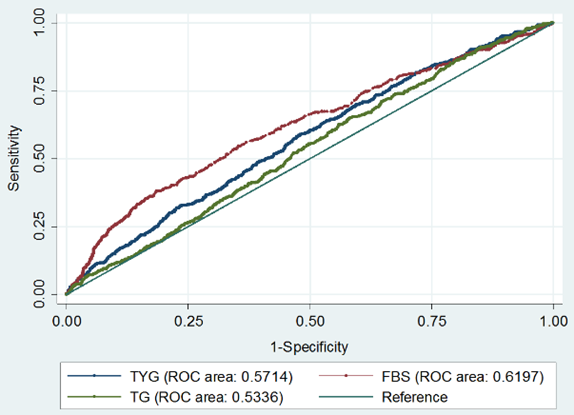
Figure 1: Receiver-operating characteristic (ROC) analysis of TyG as indicators to predict CVD in Male.
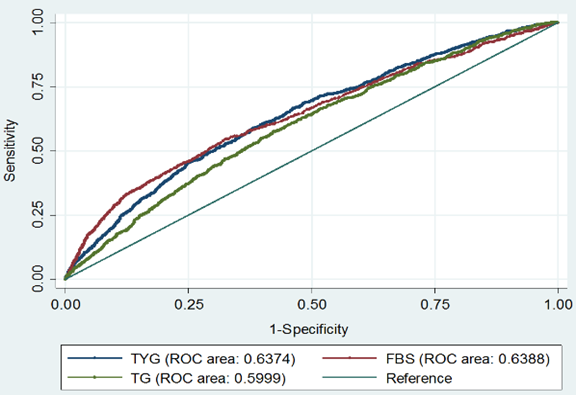
Figure 2: Receiver-operating characteristic (ROC) analysis of TyG as indicators to predict CVD in female.
TyG index has reportedly been linked to CVD risk in those who seem to be in good health [17]. The TyG index's predictive usefulness in individuals with stable CAD is yet unknown, however.
Therefore, the aim of this study was to investigate the relationship between TyG index and cardiovascular disease in Iranians. Our study is the first to examine this link in the sizable Kurdish population, as far as we are aware.
In our investigation, we found a substantial correlation between the prevalence of CVD and the TyG index. Compared with the lowest tertile of the TyG group, the highest tertile (Q4 group) was associated with a 1.58-fold increased CVD risk (Q1 group).
The exact mechanism of the association between TyG index and CVD is not yet fully understood. A trustworthy indicator of IR has been suggested as the TyG index [18]. The major cause of these correlations may thus be IR. First, IR is crucial for endothelial dysfunction, [19] chronic inflammation, [20] as well as platelet activation, adhesion, and aggregation [21]. Second, IR was linked to the onset of atherosclerosis, the growth of plaque, and plaque rupture [22, 23]. Finally, IR may be a process that causes diabetes and hypertension [24], A high level of TyG index can act as a surrogate biomarker of IR and cause lip toxicity in the cardiovascular system in addition to the harmful vascular remodeling caused by oxygenation and systemic inflammation. Together, these elements—along with dyslipidemia and hypertension increase the risk of CVD [25]. This provides strong support for the hypothesis that a high TyG index can be a reliable biomarker for the development of cardiovascular disease. A previous clinical study also showed that the TyG index is a reliable indicator of the development of coronary artery calcification [26] It was a more significant CVD predictive factor in diabetic patients than hemoglobin A1 [27].
Cross-sectional data provide further evidence that the TyG index and CVD are related [28] as well as a case-control study [29]. Retrospective cohort research conducted recently by Li et al [30] studied how the TyG-index affected older citizens' incident CVD. In our study, a multivariate adjusted model showed that the upper quartile was related with a higher risk of cardiovascular disease than the lower quartile. Moreover, Park et al [31] showed that the TyG index is an accurate predictor of coronary artery calcification progression. Inigo Sanchez et al, [17] showed that the TyG index was significantly associated with a higher risk of cardiovascular disease. Between the fourth and fifth quintiles, The European population had a 1.52 and 2.32 higher risk of cardiovascular disease. In our data analysis, multivariate analyzes showed a 1.62 higher CVD risk in the fourth quintile of TyG index. In addition, we found that the TyG index is a better predictor of cardiovascular disease in women. Meanwhile, Salazar et al, [32] conducted a study among Argentines aged 15–80 years and found that the continuous variable TyG index was associated with a 46% increased risk of cardiovascular disease in a multivariate analysis. However, this measurement risk did not materialize when the TyG index was treated as a categorical variable.
According to several studies, the TyG index strongly mediates the relationship between BMI and DM and CVD onset. As a result of obesity, increased production of free fatty acids leads to IR. In addition, it reduces insulin signaling and at the same time increases the transport of glucose in the liver [33, 34]. furthermore, obesity-induced inflammation promotes triglyceride synthesis, lipolysis, and fatty acid esterification in the liver, which increases the development of hyperlipidemia [35]. Acting as a reasonable mediator between BMI and future CVD risk, the TyG index, which is constructed using TG and FBG concentrations, helps explain the J-shaped association between the TyG index and future CVD incidence [36].
A limitation of this study was its cross-sectional design, which prevented the establishment of appropriate causal relationships. One of the main strengths of the study is the use of prospective research data (RaNCD), which ensured excellent quality of anthropometric and laboratory data. Another important advantage is its sample size. The prediction values determined in this study apply to all Kurdish regions.
The TyG index was associated with the possibility of CVD. Cardiovascular disease risk was positively associated with TyG index in the population with high TyG index values. Moreover, the TyG index may be a more accurate predictor of CVD in women than in men.
Ethics approval and consent to participate
The study was approved by the ethics committee of Kermanshah University of Medical Sciences (KUMS.REC.1394.318). All methods were carried out in accordance with relevant guidelines and regulations. All the participants were provided oral and written informed consent. All methods were carried out by relevant guidelines and regulations. This study was conducted by the Declaration of Helsinki.
Consent for publication
Not applicable.
Competing interests
The authors declare no conflicts of interest.
Funding Sources
This research was supported by Kermanshah University of Medical Sciences (grant number: 92472).
Authors’ contribution
YP and FN designed the study. MD analyzed the data. HL and NK prepared the draft of the manuscript. ES, YP and FN and MB reviewed and approved the final manuscript.
Acknowledgements
The authors thank the PERSIAN cohort Study collaborators and of Kermanshah University of Medical Sciences. The Iranian Ministry of Health and Medical Education has also contributed to the funding used in the PERSIAN Cohort through Grant no 700/534.
Dear Editorial Team, Clinical Medical Reviews and Reports. My experience with the journal was highly positive. The peer-review process was rigorous, constructive, and completed in a timely manner. The reviewers provided valuable comments that helped improve the quality and clarity of our manuscript. The editorial office was professional, responsive, and supportive throughout all stages of the publication process. Communication was clear and efficient, and any questions were addressed promptly. Overall, I found the journal to maintain high scientific standards and an excellent publication workflow. I would be pleased to consider submitting future work to this journal. Best wishes from, Elena Popa.

It was my pleasure to submit my testimonial concerning the Reviewer Board of our Scientific Journal “Brain and Neurological Disorders”. The Reviewers focused on some modifications and their contribution was helpful. The ladies of our Editorial Office were also supported my efforts. It was my honor to have such a co-operation and I am looking forward for more collaboration.

Dear Grace Pierce, Editorial Coordinator of Journal of Clinical Research and Reports, Thank you for the speedy and efficient peer review process. I appreciate the fact that your peer reviewers do not take months to respond like with some other journals. I would also like to thank the editorial office for responding quickly to my questions. It is an excellent journal. I plan to submit more manuscripts in the future. Best wishes from, Robert W. McGee

Dear Grace Pierce, Editorial Coordinator of Journal of Clinical Research and Reports, Working with you and your team on our recent publication in JCRR has been a truly wonderful and enjoyable experience. The responses were prompt, and the reviewers were patient, constructive, and highly professional. One reviewer in particular gave me the feeling that a professor was carefully reading and commenting on my coursework, which was deeply touching. The entire process was straightforward and hassle‑free, with no tedious online forms to complete. I highly recommend this journal. Best wishes from, DR Aibing Rao, Head of R&D

I Appreciate the Opportunity to Share my Experience with the Journal of Clinical Research and Reports. The peer review process was timely and constructive, and the feedback provided helped improve the quality of our manuscript. The editorial office was professional, responsive, and supportive throughout the process, ensuring smooth communication and efficient handling of the submission. Overall, it was a positive experience collaborating with your team.

Dear Mercy Grace, Editorial Coordinator of Obstetrics Gynecology and Reproductive Sciences, We would like to express our gratitude for your help at all stages of publishing and editing the article. The editors of the magazine answer all the necessary questions and help at every stage. We will definitely continue to cooperate and publish other works in the Obstetrics Gynecology and Reproductive Sciences! Best wishes from, Alla Konstantinovna Politova,
