
Research | DOI: https://doi.org/10.31579/2690-1919/206
1 Undergraduated in medical school by the University of Southern Santa Catarina (UNISUL), Campus Tubarão, Brazil.
2 Department of Otorhinolaringology, University of Southern Santa Catarina, 787 José Acácio Moreira St, Tubarão/SC, Brazil.
*Corresponding Author: Zappelini CEM, Department of Otorhinolaringology, University of Southern Santa Catarina, 787 José Acácio Moreira St, Tubarão/SC, Brazil.
Citation: Zappelini CEM, Jeremias LA, Borba IN, Machado LZ, Nicoladelli SJ, et al., (2021). Association between Flexible Nasal Endoscopy, Polysonography Findins and Obstructive Sleep Apnea Severety. J Clinical Research and Reports, 9(3); DOI:10.31579/2690-1919/206
Copyright: © 2021, Zappelini CEM. This is an open access article distributed under the Creative Commons Attribution License, which permits unrestricted use, distribution, and reproduction in any medium, provided the original work is properly cited.
Received: 01 October 2021 | Accepted: 02 November 2021 | Published: 13 November 2021
Keywords: obstructive sleep apnea; polysomnography; otorhinolaringology; nasal endoscopy; OSA severity
Introduction: Obstructive Sleep Apnea (OSA) is a condition with recurrent collapses of the pharyngeal region that result in partial or total reduction in airflow. Its diagnosis and severity depends on the Apnea-Hypopnea Index (AHI), data from the polysomnography exam (PSG). Its pathophysiology includes anatomical disorders of the upper airways that can be assessed through Flexible Nasofibroscopy (FN).
Objective: To identify the alterations present in the tests of FN and PSG in patients with OSA and correlate with the AHI.
Methods: Cross-sectional study, with data collected from reports of the FN and PSG exams of 81 patients with OSA, seen at an otorhinolaryngology clinic in Tubarão - SC. It was verified the association between the outcome –AHI- and other exposure variables - sociodemographic and clinical.
Results: Among the 81 patients, 75.31% were male, 41.98% had mild apnea, 30.86% moderate and 27.16% severe apnea. There was no correlation between FN findings and AHI (p> 0.05). There was a difference between the mean age, number of obstructive episodes per hour of sleep and minimum saturation between the groups with severe and mild apnea (p <0.05). Patients with severe apnea had a higher percentage of sleep phase one and a shorter REM sleep time compared to the mild apnea group (p <0.05). A positive correlation was obtained between: obstructive episodes with sleep stage 1 (p <0.01) and age (p <0.05); between minimum saturation and sleep stage 3 (p <0.05). There was an inverse correlation between obstructive episodes with minimal saturation (p <0.001), with sleep stage 3 (p <0.01) and with REM sleep (p <0.01); between age and minimum saturation (p <0.01).
Conclusion: OSA directly interferes with sleep architecture. The present study did not find association between upper airway alterations and OSA severity.
Obstructive Sleep Apnea (OSA) is characterized by recurrent collapses of the pharyngeal region during sleep that result in partial or total reduction of airflow [1]. Which results in hypoxemia, hypercapnia, and activation of the nervous system that directly influences quality of the individual's life [2]. It has a prevalence of 19% in the general population and is associated with several comorbidities that lead to a reduction in life expectancy [3].
The diagnosis of OSA and its severity in adults are determined by polysomnography’s (PSG) parameter Apnea Hypopnea Index (AHI). OSA is classified as mild (AHI 5 to 15), moderate (AHI 15 to 30) and severe (AHI greater than or equal to 30) [4,5]. Other parameters that are monitored during the sleep include pulse oximetry, sleep stages, sleep fragmentation, obstructive episodes and effort during respiratory events [6,7].
OSA is related with anatomical abnormalities and pathologies of the Upper Airways changes (UA) [8]. Flexible Nasal Endoscopy (FNE) is the best instrument to visualize the nasal cavity, rhinopharynx, oropharynx, hypopharynx and larynx [9]. During the exam, the Müller Maneuver is used to allow a better view of the location and degree of obstruction [10]. This maneuver results in negative pressure in the pharynx and induces the collapse of the retropalatal and retro lingual regions, simulating the phenomenon that occurs during sleep [11].
OSA is a chronic and progressive disease with high morbidity and mortality. It leads to metabolic, neurological, and behavioral outcomes that significantly reduce the quality and life expectancy of patients. Thus, the identification of UA disfunction through the FNE may indicate the need for further investigation reducing the timing for diagnosis and directing the appropriate therapeutic approach.
This study seeks to identify the variations present in Flexible Nasal Endoscopy and Polysomnography exams in patients with Obstructive Sleep Apnea and correlate with its severity.
Study patients
A retrospective cross-sectional study was conducted in the setting of an otorhinolaryngology clinic in Tubarão, Brazil. All reports of Flexible Nasal Endoscopy and Polysomnography from 2017-2019 were analyzed. A total of 81 medical records from patients with AHI greater than or equal to 5 were selected for this study. The inclusion criteria were patients with of nocturnal snoring complaints in the anamnesis who underwent endoscopic nasal examination with the performance of the Muller Maneuver.
Study procedures
This study was approved by the UNISUL Research Ethics Committee (opinion number 4,323,611).
The data was collected through a protocol written by the authors based on similar studies. Sociodemographic variables were evaluated as: a) Gender: female/male; b) Age: collected in complete years. Clinical variables were divided into data from flexible Nasal Endoscopy and polysomnography exams as: a) Septal deviation: non-obstructive, obstructive; b) Inferior turbinate hypertrophy: absent, present 1 or 2+/4+, present 3 or 4+/4+; c) Pharyngeal Tonsilla Hypertrophy: absent or present; d) Shape of the pharynx during the performance of the Muller maneuver: presence of circular or elliptical narrowing; e) Degree of obstruction during the Muller maneuver: up to 50%, greater than or equal to 50%; f) Apnea/hypopnea Index: mild (5 ≤ AHI < 15>
Statistical analyses
In the description of the data, absolute (n) and relative (%) frequencies were used for qualitative variables and measures of central tendency and dispersion for quantitative ones. Normality was identified by the Shapiro-Wilk test. The existence of an association between the Apnea-Hypopnea Index outcome and other exposure variables (sociodemographic and clinical) was assessed using Pearson's chi-square test. To compare the means of exposure variables (sociodemographic and clinical) according to the outcome (Apnea-Hypopnea Index), the analysis of variance test (ANOVA) was used. Bonferroni's post hoc test was used to identify the difference between means in the three groups evaluated. To assess the correlation between variables, the Pearson correlation coefficient (r) was used. The strength of the association was classified considering r values as follows: 0=null; 0-0.3=weak; 0.3|-0.6=regular; 0.6|-0.9= strong; 0.9|-1= very strong; 1=complete or perfect [12]. The significance level used in the research was 5% (p<0>
Of the 81 participants 61 (75.31%) were males and 20 females (24.69%), the mean age was 43.34 years (± 14,93y). The patients were divided into three groups according to OSA severity: Mild OSA 34 (41.98%) people, 25 (30.86%) moderate OSA and 22 (27.16%) severe OSA. The mean age of the severe OSA group was significantly higher than the mild group (47.82y vs 38.36y) (p<0>
In the Nasal Endoscopy reports was observed that 8 (9.88%) participants had an obstructive septal deviation; 14 (17.28%) presented grade 3+/4+ or 4+/4+ inferior turbinate hypertrophy; 4 (4.94%) with pharyngeal tonsil hypertrophy; 74 (91.36%) manifested circular narrowing of the pharynx during the MM; 73 (90.12%) had an airway obstruction degree >50% during the Muller Maneuver. There was no statistically significant association between the alterations in the UA structures and OSA severity (p>0.05). (Table 1).
Data | OSA Severety |
p* |
Total | ||||||
| Mild (5 ≤ AHI < 15> | Moderate (15 ≤ AHI< 30) | Severe (AHI ≥30) | |||||||
| N | % | N | % | N | % | N | % | ||
| Sex | |||||||||
| Female | 07 | 28,00 | 06 | 27,27 | 07 | 20,59 | 0,766 | 20 | 24,69 |
| Male | 18 | 72,00 | 16 | 72,73 | 27 | 79,41 | 61 | 75,31 | |
| Deviated septum | |||||||||
| Unobtrusive | 23 | 92,00 | 22 | 100 | 28 | 82,35 | 0,090 | 73 | 90,12 |
| Obstructive | 02 | 8,00 | 0 | 0,00 | 06 | 17,65 | 8 | 9,88 | |
| Turbinate Hypertrophy | |||||||||
| 1+/4+ e 2+/4+ | 18 | 72,00 | 19 | 86,36 | 30 | 88,24 | 0,167 | 67 | 82,72 |
| 3+/4+ e 4+/4+ | 7 | 28,00 | 3 | 13,64 | 04 | 11,78 | 14 | 17,28 | |
| Pharyngeal Tonsilla Hypertrophy | |||||||||
| Abscent | 23 | 92,00 | 20 | 90,92 | 34 | 100,00 | 0,215 | 77 | 95,06 |
| Present | 02 | 8,00 | 02 | 9,09 | 0 | 0,00 | 4 | 4,94 | |
| Shape of the Pharynx in Muller's Maneuver | |||||||||
| Circular narrowing | 24 | 96,00 | 21 | 95,45 | 29 | 85,39 | 0,255 | 74 | 91,36 |
| Elliptical narrowing | 01 | 4,00 | 01 | 4,55 | 5 | 14,71 | 07 | 8,64 | |
| Obstruction’s degree during Muller's Maneuver | |||||||||
| < 50> | 04 | 16,00 | 03 | 13,64 | 01 | 2,94 | 0,198 | 08 | 9,88 |
| ≥ 50% | 21 | 84,00 | 19 | 86,63 | 33 | 97,06 | 73 | 90,12 | |
N: absolute number; %: percentage; *: related to Pearson's chi-square test.
Table 1: Description of the number, percentage and significance value of nasal endoscopy data of OSA patients from 2017-2019, according to the OSA severity. Tubarão, 2020.
Regarding the PSG data there was a significant difference (p<0>
| Data | OSA Severety | N | Mean | SD | |
| Age (years) | |||||
| Mild (5 ≤ AHI < 15> | 25 | 38,36 a | 13,93 | ||
| Moderate (15 ≤ AHI< 30> | 22 | 42,09 | 16,71 | ||
| Severe (AHI ≥30) | 34 | 47,82 | 13,46 | ||
| Total | 81 | 43,34 | 14,93 | ||
| Obstructive episodes per hour of sleep | |||||
| Mild (5 ≤ AHI < 15> | 25 | 11,14 a, b | 4,65 | ||
| Moderate (15 ≤ AHI< 30> | 22 | 25,11 c | 7,75 | ||
| Severe (AHI ≥30) | 34 | 58,30 | 21,31 | ||
| Total | 81 | 34,73 | 25,40 | ||
| Lowest Blood Oxygen Saturation (%) | |||||
| Mild (5 ≤ AHI < 15> | 25 | 89,12 b | 4,76 | ||
| Moderate (15 ≤ AHI< 30> | 22 | 85,22 c | 4,61 | ||
| Severe (AHI ≥30) | 34 | 78,29 | 8,33 | ||
| Total | 81 | 83,52 | 7,95 | ||
| N1 (%) | |||||
| Mild (5 ≤ AHI < 15> | 25 | 7,10 a | 5,67 | ||
| Moderate (15 ≤ AHI< 30> | 22 | 9,80 | 10,84 | ||
| Severe (AHI ≥30) | 34 | 13,87 | 12,36 | ||
| Total | 81 | 10,67 | 10,59 | ||
| N2 (%) | |||||
| Mild (5 ≤ AHI < 15> | 25 | 50,84 | 11,67 | ||
| Moderate (15 ≤ AHI< 30> | 22 | 52,81 | 9,63 | ||
| Severe (AHI ≥30) | 34 | 52,67 | 12,26 | ||
| Total | 81 | 52,14 | 11,32 | ||
| N3 (%) | |||||
| Mild (5 ≤ AHI < 15> | 25 | 20,38 | 10,26 | ||
| Moderate (15 ≤ AHI< 30> | 22 | 21,55 | 10,56 | ||
| Severe (AHI ≥30) | 34 | 15,62 | 10,32 | ||
| Total | 81 | 18,70 | 10,58 | ||
| REM Sleep (%) | |||||
| Mild (5 ≤ AHI < 15> | 25 | 21,67 a | 7,03 | ||
| Moderate (15 ≤ AHI< 30> | 22 | 18,09 | 6059 | ||
| Severe (AHI ≥30) | 34 | 16,95 | 6,88 | ||
| Total | 81 | 18,72 | 7,06 | ||
Note: N: absolute number; *: related to the analysis of variance test (ANOVA); a: statistically significant difference (p<0>b: statistically significant difference (p<0>c: statistically significant difference (p<0>
Table 2: Description of the number, mean, standard deviation and significance level of and sociodemographic and Polysomnography data according to OSA severity (AHI). Tubarão, 2021.
The average time obtained for sleep stage 1 non-REM (N1) was 10.67% of total sleep, with a statistically significant difference (p<0>
There was a positive correlation between obstructive episodes and age (p<0>
Age (N) | Obs. Eps. (N) | Low. Sat. (%) | N1 (%.) | N2 (%) | N3 (%) | REM (%) | |
| Age | 1 | ||||||
| Obs. Eps. | 0,2601* | 1 | |||||
| Low. Sat. | -0,3577** | -0,6382*** | 1 | ||||
| N1 | 0,1634 | 0,4495*** | -0,2069 | 1 | |||
| N2 | -0,2205* | 0,1427 | -0,1772 | -,01248 | 1 | ||
| N3 | -0,0408 | -0,4336** | 0,2575* | -0,3474* | -0,6591*** | 1 | |
| REM | -0,0802 | -0,3041** | 0,1375 | -0,3902** | -0,2251* | -0,0025 | 1 |
Note: N: absolute number; Obs. Eps.: Number of Obstructive Episodes per hour of sleep; Low. Sat: Lowest Blood Oxygen Saturation; N1: stage 1 non-REM sleep; N2: stage 2 non-REM sleep; N3: stage 3 non-REM sleep; REM: REM sleep; Significance level: * p<0>** p<0> *** p<0>
Table 3: Pearson's linear correlation coefficient with sociodemographic variables and PSG data. Tubarão, 2021.
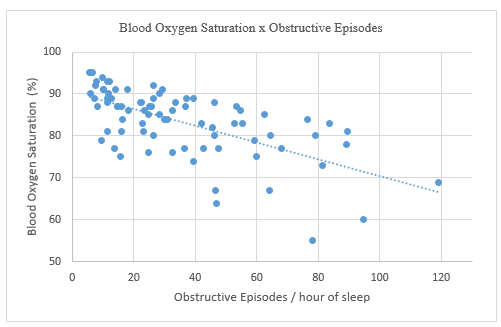
Figure 1, Inverse (-0.6382) and statistically significant (p<0>
Structural alterations in the UA are an important factor in the pathophysiology of OSA. An increase in resistance to the passage of airflow through the nasal cavity leads to a decrease in intraluminal pressure and collapse of pharyngeal tissues, causing respiratory disorders, including sleep apnea [8]. Our hypothesis would be that from an endoscopic evaluation, the appearance of lesions characteristics could identify patients at higher risk for OSA. The present study identified the alterations in the FNE exam in OSA patients, but there was no correlation between the findings and OSA severity.
The literature reports that the presence of nasal alterations is highly prevalent in patients with OSA [14]. Even though, smilar studies also showed no statistical significance between the presence of OSA and structural pathologies of the nasal cavity [15,16]. A systematic review carried out in 202017 showed in most of the analyzed studies that the presence of nasal obstruction was not related to the AHI. The main hypothesis is that nasal obstruction does not lead to a complete obstruction of the upper airways, but increases the negative intrathoracic pressure and causes sleep fragmentation, altering its quality without interfering with the AHI [16].
The use of MM is still controversial in the scientific community regarding the prediction of OSA severity [18]. The present study did not find statistical relevance between the findings during MM (degree of obstruction, elliptical and circular narrowing) and the AHI, as well as Suresh RK et al, 2015 [10]. Other studies have shown a correlation between elliptical pharyngeal narrowing and apnea severity [19,20]. MM, in awake patients, is a good instrument to identify the degree of obstruction during sleep, but it did not present a significant relation with the AHI.
Among the risk factors for the progress of OSA, age is of great importance. In our study, there was a positive correlation between increasing age and apnea severity. Other studies that evaluated the prevalence of OSA in the population also showed a direct relation between age and the AHI [3, 21-23]. It is directly related to the presence of other risk factors, such as obesity, neck circumference and with decreased activity of the pharyngeal dilator muscles, promoting the worsening of OSA [8].
Furthermore, an inverse association was found between age and the SpO2 obtained in the PSG exam. Other studies that evaluated polysomnographic data also found this correlation [3,21,23]. This finding corroborates the previous data that shows a direct relation between age and AHI, showing that the older the age, the greater the number of obstructive events and, consequently, the lower the blood oxygen saturation.
The decline in SpO2 causes numerous micro-awakenings that alter the sleep architecture and lead to consequences such as excessive daytime sleepiness, morning headaches, sexual impotence, personality changes such as irritability and depression. It is also associated with cardiovascular risks, such as increased blood pressure, increased risk of acute myocardial infarction, stroke and cardiac arrhythmias [24]. In our study, it was possible to observe a strong negative correlation between obstructive episodes and blood saturation. The literature presents similar data [21,23].
Regarding sleep stages, patients with severe OSA had a longer duration of N1 sleep than patients with mild OSA. Other studies have shown data that are similar to our results [21,23]. This shows a direct relation between the severity of apnea and the duration of N1, which can be justified by the recurrent micro-arousals caused by periods of apnea with a drop in SpO2. These events make it difficult to maintain sleep, and hinder the evolution to deeper stages, increasing the latency time of the initial sleep stages.
As for the REM sleep, it was observed that the group with severe OSA presented a lower percentage than the group with mild OSA. Other studies have also found this relation between a reduction in the REM sleep percentage and OSA severity [21,23]. The normal percentage of REM sleep range from 20-25 % [25] of total sleep, while in our study severe OSA group only reached 16,95%, which shows the influence of OSA on sleep architecture. This reduction in the REM sleep, increases the risks for the development of dementia and harms the cognitive processes of learning, memory and creativity [26].
Our study only explored the relation between sex and age in patients with OSA. To a better understanding of socio-demographic factors influence on OSA, we suggest carrying out studies with the inclusion of other known risk factors under study. As for the alterations in the FNE exam, we believe that a larger sample and the presence of a control group would increase the degree of reliability of the study.
The present study did not find a relation between alterations in the FNE exam and the severity of OSA. However, upper airway obstruction is an important element in the pathogenesis of OSA and should be investigated in patients complaining of obstructive sleep disorders.
OSA plays an important role in the distribution of sleep stages. Its gravity intervenes directly in the sleep architecture, increasing the time spent in superficial stages and hindering the evolution to deeper stages of sleep. And yet, causing metabolic, neurological and behavioural changes that significantly reduce the quality and life expectancy of patients.
There is no conflict of interest.
No founding sources.
Dear Editorial Team, Clinical Medical Reviews and Reports. My experience with the journal was highly positive. The peer-review process was rigorous, constructive, and completed in a timely manner. The reviewers provided valuable comments that helped improve the quality and clarity of our manuscript. The editorial office was professional, responsive, and supportive throughout all stages of the publication process. Communication was clear and efficient, and any questions were addressed promptly. Overall, I found the journal to maintain high scientific standards and an excellent publication workflow. I would be pleased to consider submitting future work to this journal. Best wishes from, Elena Popa.

It was my pleasure to submit my testimonial concerning the Reviewer Board of our Scientific Journal “Brain and Neurological Disorders”. The Reviewers focused on some modifications and their contribution was helpful. The ladies of our Editorial Office were also supported my efforts. It was my honor to have such a co-operation and I am looking forward for more collaboration.

Dear Grace Pierce, Editorial Coordinator of Journal of Clinical Research and Reports, Thank you for the speedy and efficient peer review process. I appreciate the fact that your peer reviewers do not take months to respond like with some other journals. I would also like to thank the editorial office for responding quickly to my questions. It is an excellent journal. I plan to submit more manuscripts in the future. Best wishes from, Robert W. McGee

Dear Grace Pierce, Editorial Coordinator of Journal of Clinical Research and Reports, Working with you and your team on our recent publication in JCRR has been a truly wonderful and enjoyable experience. The responses were prompt, and the reviewers were patient, constructive, and highly professional. One reviewer in particular gave me the feeling that a professor was carefully reading and commenting on my coursework, which was deeply touching. The entire process was straightforward and hassle‑free, with no tedious online forms to complete. I highly recommend this journal. Best wishes from, DR Aibing Rao, Head of R&D

I Appreciate the Opportunity to Share my Experience with the Journal of Clinical Research and Reports. The peer review process was timely and constructive, and the feedback provided helped improve the quality of our manuscript. The editorial office was professional, responsive, and supportive throughout the process, ensuring smooth communication and efficient handling of the submission. Overall, it was a positive experience collaborating with your team.

Dear Mercy Grace, Editorial Coordinator of Obstetrics Gynecology and Reproductive Sciences, We would like to express our gratitude for your help at all stages of publishing and editing the article. The editors of the magazine answer all the necessary questions and help at every stage. We will definitely continue to cooperate and publish other works in the Obstetrics Gynecology and Reproductive Sciences! Best wishes from, Alla Konstantinovna Politova,
