
Research Article | DOI: https://doi.org/10.31579/2688-7517/043
1Bahar Institute of Higher Education, Mashhad, Iran
*Corresponding Author: Bahar Institute of Higher Education, Mashhad, Iran.
Citation: Hamed Ghaemi, (2022) Assessing Differential Item Functioning (DIF) For Pearson Test of English (PTE) A study of Test Takers with Different Fields of Study, J. Addiction Research and Adolescent Behaviour 5(3); DOI: 10.31579/2688-7517/043
Copyright: © 2022, Hamed Ghaemi, This is an open access article distributed under the Creative Commons Attribution License, which permits unrestricted use, distribution, and reproduction in any medium, provided the original work is properly cited
Received: 07 March 2022 | Accepted: 17 March 2022 | Published: 29 April 2022
Keywords: differential item functioning (DIF); item response theory (IRT); likelihood ratio approach (LR); fields of study; Pearson test of english
Differential Item Functioning (DIF), which is a statistical feature of an item and provides a sign of unpredicted performance of items on a test, occurs once dissimilar groups of test takers with the same level of ability show different performance on a single test. The aim of this paper was to examine DIF on the Pearson Test of English (PTE) test items. To that end, 250 intermediate EFL learners with the age range of 26 - 36 in two different fields of study (125, Engineering, and 125 Sciences) were randomly chosen for the analysis. The Item Response Theory (IRT) Likelihood Ratio (LR) approach was utilized to find items showing DIF. The scored items of 250 PTE test takers were analyzed using the IRT three-parameter model utilizing item difficulty (b parameter), item discrimination (a parameter), and pseudo-guessing (c parameter). The results of the independent samples t-test for comparison of means in two groups depicted that Science participants performed better than the Engineering ones particularly in Speaking & Writing and Reading sections. It is evident that the PTE test was statistically easier for the Science students at 0.05 level. Linguistic analyses of Differential Item Functioning items also confirmed the findings of the quantitative part, indicating a far better performance on the part of Science students.
The growth of the psychometric tests and testing procedures have been affected by virtue of social and political fluctuations within the few past decades (Owen, 1998). When psychometric tests are used to perform individual or group comparisons, item bias ought to be considered to lessen the unfitting interpretations. Test bias varies from test fairness in that it is usually measured quantitatively while test fairness is carried out subjectively and intuitively and it is not feasible to be described in absolute terms, indicating that no one can categorize tests as either fair or not fair. It can be taken as read that it is not the test characteristics being significant on its own but the scores’ interpretations and the results that are of overriding significance as the students' educational future is usually determined by these decisions. The term biased pertains to the applied instruments, testing procedures and the methods of scores interpretation. The scores’ differences between two groups don’t merely define the term bias (Osterlind, 1983). The term bias has been superseded by differential item functioning (DIF) showing that individuals who are parallel considering their level of ability have different performance on a test and gain various scores accordingly. Test bias or DIF is concerned with systematic errors and discloses the characteristics associating with item psychometric characteristics depicting that the items cannot measure impartially considering different individuals/groups. In actual fact, DIF arises when "individuals from various classes have the similar ability level but display different likelihood in responding to an item accurately" (Osterlind, 1983, p. 32). Basically, non-DIF represents the situation in which the test takers with the analogous level of ability irrespective of their in-group differences have the same probability to answer an item correctly. DIF deals with the extent to which the test items differentiate between participants having the same ability level from various groups consisting of gender, ethnicity, education, etc. (Zumbo, 2007). Parameters contributing to item/test bias are "culture, education, language, socioeconomic status, and so on" (Van de Vijver, 1998, p. 35). Test bias or DIF should be evaluated and calculated during test construction process (Osterlind, 1983). Tests ought to be constructed in a way that when inconsistency in examinees’ test results is observed, such discrepancy is attributed to differences in the construct that the test is going to assess. By detecting and eliminating items demonstrating DIF as well as the analysis of items, test developers find problematic items lacking psychometric properties. This paper investigated item analysis of PTE, an internationally – recognized proficiency test, by means of item response theory (IRT) based on DIF study.
Finding items demonstrating DIF permits the test developers to match the examinees with the pertinent knowledge. DIF is concerned with the students’ scores on the tests, their hidden ability’s measurement and examination of individuals being analogous with reference to their level of capability and come from various background though perform identical on an item. Mantel- Haenszel

Test is used for detecting DIF (Mantel and Haenszel, 1959), suiting well even for small number of participants and empowers the test makers to utilize simple arithmetic measures based upon logistic regression methods proposed by Zumbo (2007). Modest arithmetic procedures offer a more in-depth explanation of DIF and permits the researchers to make distinction between uniform and non-uniform DIF. The other procedures to detect DIF employ IRT models as stated by Lord, (1980), Raju (1990), and Thissen, Steinberg, & Wainer (1994). These methods deal with examinees’ ability and characteristics of items more accurately and are more concerned with larger sample sizes. Among these models, IRT is used more by the researchers to spot items flagging DIF, as these models “render the most useful data for identifying differences on particular items” (Ertuby, 1996, p. 51).
Most of the measurement procedures, in particular in the field of education and psychology, deal with the latent variables (Hambleton, 1996). The chance of answering correctly hinge on both item characteristics and examinees’ level of ability. Such a relationship is mathematically stated as item characteristic curve (ICC). Any ICC ought to envisage the examinees’ scores based on their underlying abilities, which is also recognized as item response function. The examinees’ level of abilities is shown along the X-axis and represented by theta (θ) while the probability of responding to items correctly is demonstrated on Y-axis and is shown by p (θ). As Baker (1985) proposed, the ICC shape rest on the item difficulty (b-parameter), item discrimination (a-parameter), and guessing power known as pseudo-chance (c-parameter). In fact, depending on horizontal location, ICCs might vary, spotting the individuals’ ability level against items’ difficulty. The likelihood of selecting the right answer is 0.50 (i.e., the likelihood of choosing the right answer is 50 percent). Larger b-values stand for more difficult items, ranging from -2.5 to +2.5 in theory. Meaning it differs from the very easy items to very tough ones.
Item discrimination (a-parameter) displays the slope of the ICC and the accuracy of the measurement of a given item. The curve slope and item discrimination are positively correlated in a sense that the steeper slope shows more discriminating power of an item. The a-value ranges between 0~2. Those below 0.5 do not have discriminating power. The items having larger discrimination power may well differentiate the individuals. The guessing power (c-parameter) displays the probability a test taker with the bottommost level of ability answering the item accurately. The c-parameter ranges from 0 to 1. IRT models alter concerning the properties of items they involve. The one parameter or Rasch model has to do with the item difficulty and ability level of examinees. The two parameter model deals with item discrimination and Item difficulty (probability of getting the correct response based on examinees’ ability level). Third parameter or pseudo-chance parameter is realized when items have multiple-choice format and examinees can get the correct response by guessing. IRT models are unidimensional and independent. They are based upon the shape of ICC and examinees’ level of ability.
DIF usually has two distinct categories with regard to logistic regression model: uniform and non-uniform. Uniform DIF affects the participants at all levels equally suggesting that ICC is precisely identical for two classes. De Beer (2004) believes that the likelihood to pick the correct answer is less than that of another class in uniform DIF. The shape of ICC for one class of testees is therefore below that of the other group in his opinion, as illustrated in Fig. 1.
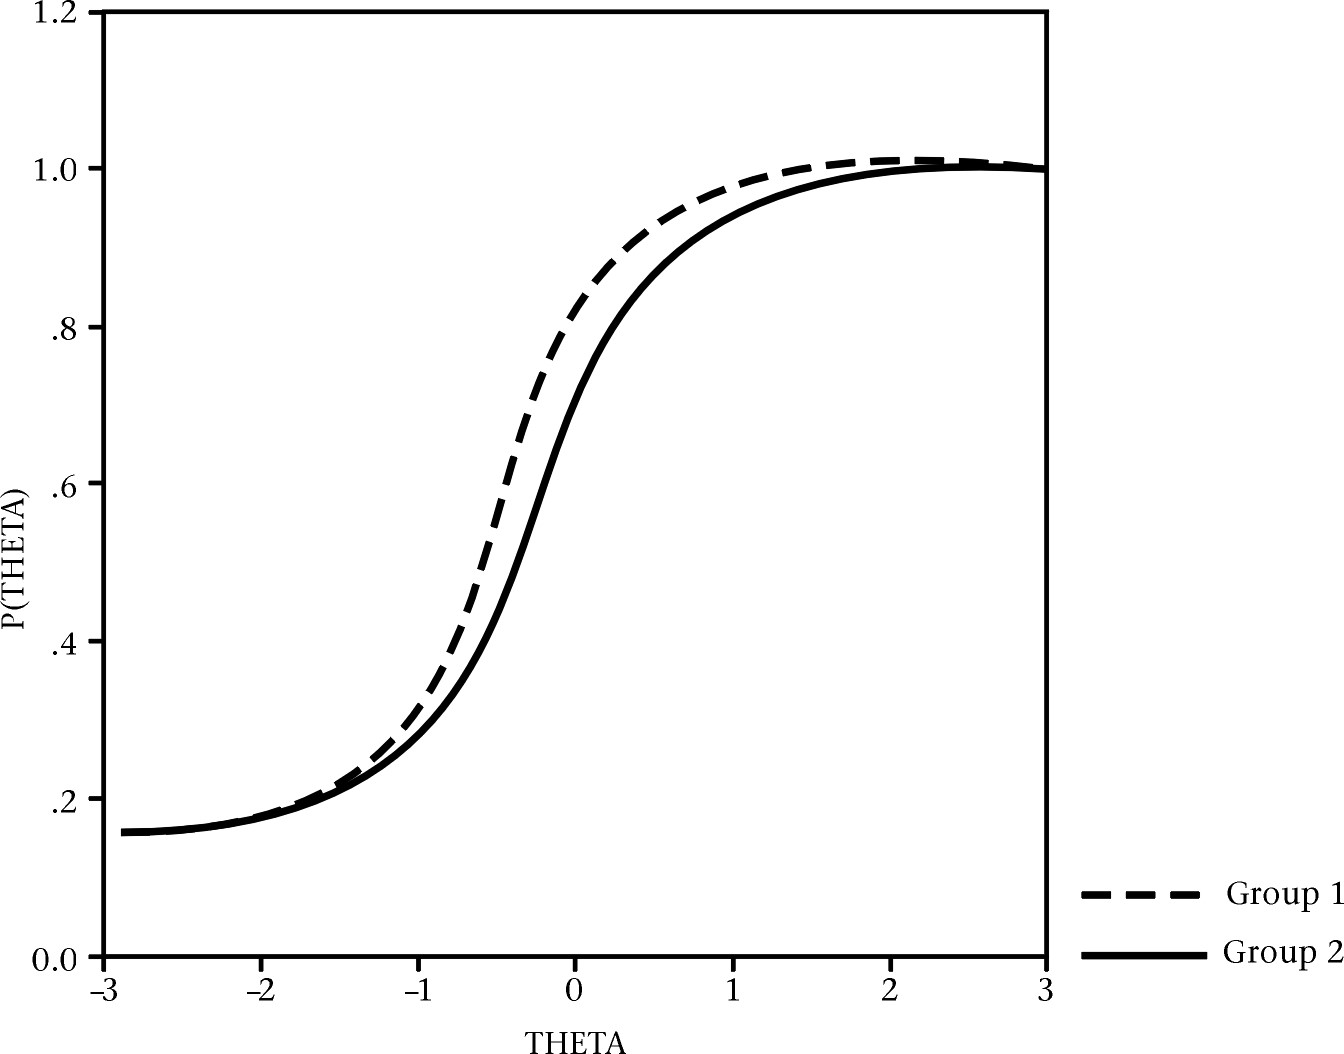
When two groups are different on their slopes, the item shows non-uniform DIF. In other words, ICCs have various shapes for different groups of examinees in non-uniform DIF. Non-uniform DIF influences examinees inconsistently. De Beer (2004, p. 42) states that “the ICC shapes cross at a given point implying that one group has a lesser possibility to answer the test items accurately while such possibility for the other group was still higher”. Fig. 2 shows the ICC shape for an item demonstrating the non-uniform DIF.

A DIF analysis for test takers with various language backgrounds encompassing Chinese and Spanish was examined by Chen and Henning (1985). They employed Transformed Item Difficulty (TID) presented first by Angoff (1993). TID provides the item difficulty indices between two groups of test takers and identified outliers. One hundred eleven test takers including seventy-seven Chinese and thirty-four Spanish test takers took part in the research. Nevertheless, the participants were not that much ample for the difficulty parameter to be consistently measured. Lawrence, Curley, & McHale (1988) and Lawrence & Curley (1989) studied DIF regarding students’ gender in the Scholastic Aptitude Test (SAT) by dint of the standardization method. The outcomes depicted females performed not as well on items as male test takers. All these studies, though, have some downsides. First, most of them dealt with finding DIF (uniform and non-uniform) considering item discrimination. Furthermore, most studies conducted on comparing the students’ total scores through standardization processes have shown that items are not typically examined before DIF detection. This may jeopardize the results of the studies. Ownby and Waldrop-Valverde (2013) applied IRT to determine whether the way the participants respond to the items has any influence on older readers in a cloze test. They spotted twenty four items flagging DIF, concluding that DIF was a substantial cause of variance that may imperil test scores’ interpretations and uses. Koo (2014) conducted meta-analytic DIF analyses on a reading test and the Florida Comprehensive Achievement Test (FCAT) by taking language, gender, and ethnicity into account. He figured out that items of vocabulary and phraseology favored non-English language learners irrespective of their gender and ethnicity. Aryadoust and Zhang (2015) utilized a Rasch model to a test of reading comprehension in a Chinese context. They found that while class one performed better on vocabulary, grammar, and general English proficiency, the other class surpassed in skimming and scanning parts. The results of most prior studies showed the gender had a trivial impact on the performance of the readers (Hong & Min, 2007; Chen & Jiao, 2014). Federer, Nehm, & Pearl (2016) explored the correlation between the way male and female participants while answering the open-ended questions. They found that women performed better under novel circumstances. In another study focusing on evolution, Smith (2016) made an instrumentation dealing with the Evolution Theory. He could succeed to make a distinction between high school and university students using items flagging DIF.
The Current Study
The present paper aimed at finding and identifying the items that were susceptible to DIF as well as determining the fields of study which were advantaged in those items. Most DIF investigations are based upon the comparisons between gender (e.g., Lawrence, Curley, & McHale, 1988; Carlton, 1992; Federer et al., 2016), ethnicity (Schmitt, 1990; Koo, 2014), or language (Chen & Henning, 1985; Ryan & Bachman, 1992) to-date. There are insufficient studies which scrutinized DIF for students with different subject fields focusing on PTE as an international proficiency test. Thus, DIF detection for students with different subject fields (Engineering vs. Sciences) willing to participate in PTE, worth investigating. The main objective of this paper was to detect questions displaying DIF on PTE proficiency test for test takers with different fields of study (Engineering vs. Sciences) by means of IRT analysis. To the end, two research questions motivated this study:
RQ1:Do test items (PTE test) function differently for test takers with different fields of study (Engineering vs. Sciences)?
RQ2: Are there linguistic features of these items that account for the DIF results?
Participants
This study included 250 intermediate EFL learners with the age range of 26 -36. They were Ph.D. applicants as well as Master’s degree holders in two different fields of study (125 Engineering) and 125 Sciences) in Iran. All the participants spoke Persian / Farsi as their L1.
Instruments
In line with the purposes of the study, the researchers applied one instrument as follows:
Pearson Test of English (PTE)
Pearson Language Tests is devoted to measuring and validating the English language of non-native English speakers. The tests comprise the Pearson Test of English (PTE) Academic, PTE General and PTE Young Learners. These are administered in association with Edexcel, the world's largest examining body. In 2009, Pearson Language Tests introduced the Pearson Test of English Academic which is recognized by Graduate Management Admission Council (GMAC). The test score has been associated to the levels well-defined in the Common European Framework of Reference for Languages (CEFR). PTE Academic is distributed through the Pearson Virtual User Environment (VUE) centers which are also in charge of holding the GMAT (Graduate Management Admission Test). Upon publicizing, it was accepted by nearly 6,000 organizations. As a case in point, the test is accepted by the Australia Border Agency and the Australian Department of Immigration and Citizenship for visa applications. The test is mostly read by a computer rather than a human corrector to decrease waiting times of the results for students.
Data Collection Procedures
The researchers requested the PTE candidates to provide them with report card of their score in each section as well as the total scores. In addition to this, the scores of each item were collected and used for the purpose of data analysis. The scores for each part had been estimated based on the correct responses and no negative marks had been considered for wrong answers. During the administration of the PTE test, the usual precautions were met:
Design
In view of the fact the researchers couldn’t manipulate and control the independent variables, the design of this study was ex post facto as already confirmed by Hatch and Farhady (1982). Such design is normally utilized when there is no interference on the part of the researchers on the participants’ traits. This study comprised the test-takers’ subject fields as an independent variable and their PTE test scores as the dependent variable.
Data Analysis Procedures
The PTE scored items of two hundred and fifty Iranian EFL test takers were entered into the IRT 3PL model suggesting the probability that a test taker with an ability of theta (θ) responds to an item accurately, with regard to item difficulty (b parameter), item discrimination (a parameter), and pseudo-guessing (c parameter) (Hambleton, Swaminathan, & Rogers, 1991). These characteristics are mathematically shown hereunder:
P (x = 1/θ) = c + 1 – c
1 + e–

(θ–b)
Where, x is an item response, θ is the estimated ability, a is item discrimination, b is item difficulty, c is pseudo-guessing parameter, D is a scaling factor (= 1.7) that is devised to estimate the IRT models to a cumulative normal curve, and e is a transcendental number whose value is 2.718. However, because the c parameter is often poorly assessed, a prior distribution (M = 0.2 and SD = 1, according to Thissen (1991) has been applied. Thissen, Steinberg, & Wainer (1988) proposed that a prior speculation is applied to the c parameters when DIF is studied using the 3PL IRT model. The IRT LR is a model-based approach and compares a model in which all parameters are controlled to be equal across groups, hence no DIF, with an amplified model, permitting parameters to be free across groups. Using the likelihood ratio goodness-of-fit statistic, G², the fit of each model to the data is estimated. Statistical difference in G² between the two models were also tested based on the chi-square statistics. Then, item discrimination (i.e., a parameter), item difficulty (i.e., b parameter), and G² were measured by means of probability ratio of chi-square statistics. If a parameter is constant, it confirms unchanging, uniform DIF or no DIF. If the result is significant (i.e., variant b parameter), it designates uniform DIF. On the other hand, if a parameter of the studied items is variant, it proves the presence of non-uniform DIF in spite of the b parameters.
The Outcomes of Research Question
The results of DIF investigations on IRT 3P LR model are shown in Tables 2, 3, and 4. These Tables depict the following data:
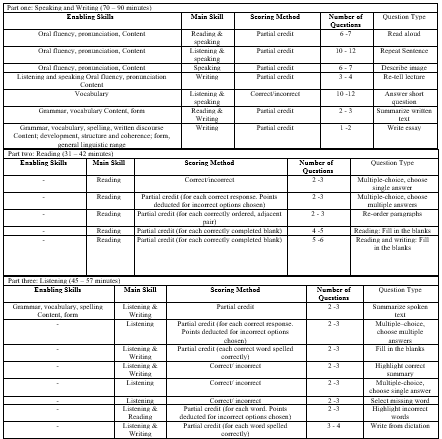
Speaking & Writing
This part included 38 - 57 items. To have clear understanding and detailed and reliable calculations, in this study 57 questions are considered for the Speaking and Writing part, which is the utmost number of items in PTE Speaking and Writing part. This is actually applied for other parts of the test too). To detect/identify DIF, each item was analyzed with respect to 3PL IRT model. To do this, as Thissen, Steinberg, & Wainer (1988) confirmed, the impacts of c parameter were controlled in advance. As it is shown in Table 2, twelve items (4, 6, 7, 13, 17, 29, 34, 38, 46, 47, 52 and 53) were identified to show DIF at the 0.05 significance level. Two items (i.e., items 7 and 17) displayed no DIF, and four items (i.e., items 4, 6, 13, 29, 50, 55 and 57) exhibited non-uniform DIF.

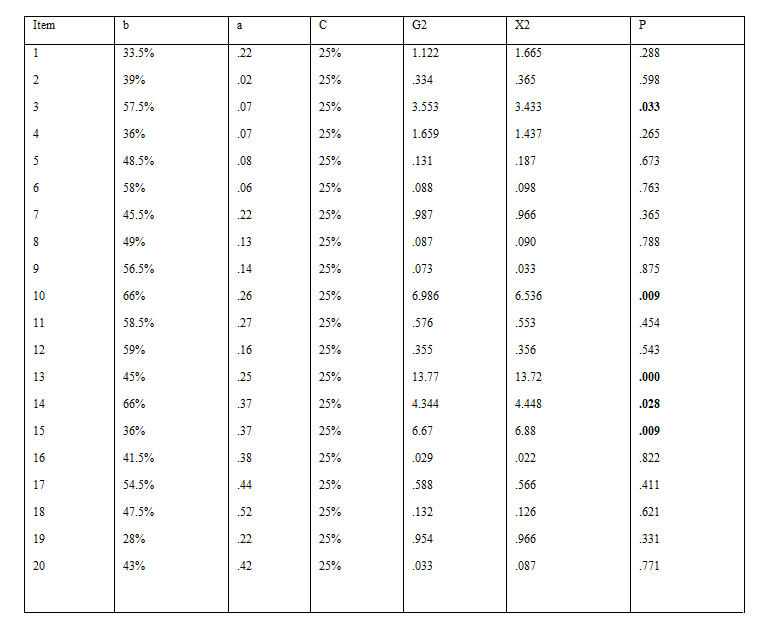
Reading
This part included 20 items. To detect/identify DIF, each item was scrutinized with respect to 3PL IRT model. The plausible effects of c parameter were controlled in advance, as recommended by Thissen, Steinberg, & Wainer (1988). As Table 3 indicates, five items (3, 10, 13, 14 and 15) were found to depict DIF at the 0.05 significance level.
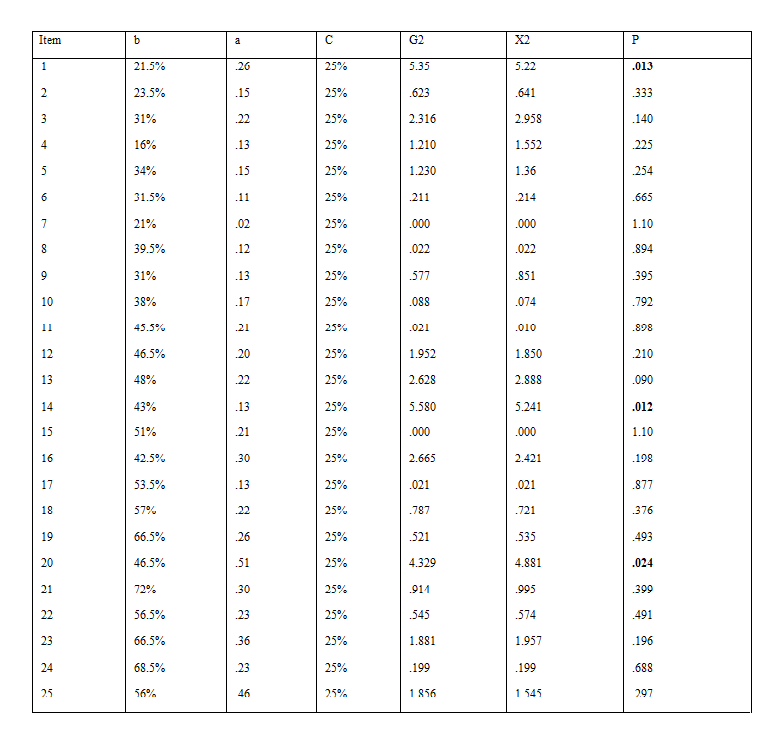
Listening
This section includes 25 items. To detect/identify DIF, each item was investigated with respect to 3PL IRT model while the probable effects of c parameter were controlled in advance as per Thissen, Steinberg, & Wainer’s (1988) recommendations. As it is shown in Table 4, four items (1, 14, and 20) were recognized to show DIF at the 0.05 significance level.
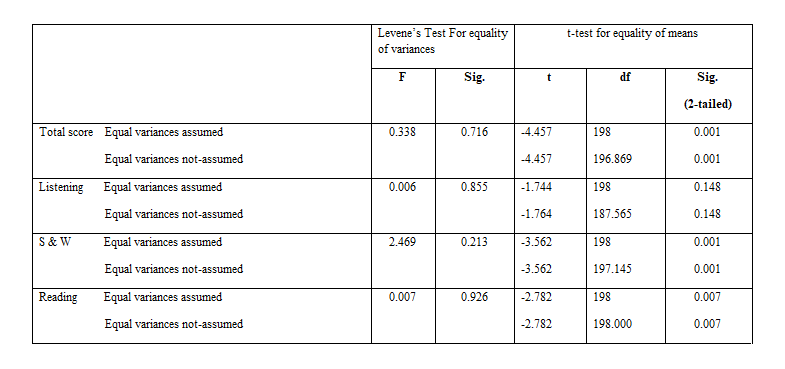
Comparing two groups based on Descriptive Statistics
To discover which group (Engineering vs. Sciences) performed better at the exam in each part and the whole test, the independent samples t-test for comparison of means in two groups has been carried out. As Tables 5 and 6 illustrates, the mean score of Science test takers in Listening section (10.36) is higher than the Engineering test takers (9.33). However, the difference is not significant at 0.05 level. Regarding Speaking and Writing (S & W), as shown in Tables 5 and 6, the mean score of Science test takers (14.89) is higher than the Engineering’ (10.69). Such difference is significant at 0.05 level. In regard to Reading, as it is illustrated in Tables 5 and 6, the mean score of Science test takers (19.94) is higher than that of Engineering (15.55). However, the distinction is not significant at 0.05 level. As for the Total test, as Tables 5 and 6 demonstrate, by considering the mean score of Science test takers (45.52) and the standard deviation (SD=11.11) and comparing them with those of Engineering (35.55); (SD= 13.38), it turned out that Science test takers outperformed the Engineering. It can be inferred that the exam was statistically easier for Science test takers at 0.05 level.

In the meantime, the descriptive statistics and reliability estimates are also given in Table 7 for data sample (n = 250) results on the PTE total test as well as its three sections. As presented in Table 7, the PTE Test has been proved to be a quite reliable test. The reliability for the whole PTE test as well as Listening, Speaking & Writing and Reading parts were .95, .88, .82 and .93 respectively.

Finding and removing DIF items are significant for test fairness and validity. It’s vital to guarantee that latent traits of all test-takers are determined precisely by items and test scores. Although PTE test has experienced severe vicissitudes and revisions since its development, both test-takers and test-developers still doubt whether the test is fair for all groups of individuals. To address such obscurities, the present study applied IRT 3PL model to PTE proficiency exam to distinguish items flagging DIF. The criterion variables were Listening, Speaking & Writing, Reading, and examinees’ academic field of study. Findings depict that items in different parts might be associated to some features of individuals and may therefore create bias in assessing their proficiency. Nevertheless, such inconsistencies were not that much great, denoting that the difficulty level of items was not the same for two groups of examinees in different fields of study. As already confirmed by Zumbo (2007), these discrepancies among examinees’ performance may be linked to some prevailing covariates. In this study, almost twenty percent of the original questions ultimately flagged as items showing differential item functioning. They need to be discarded from the test’s next administration. These findings oppose with the general international results proposed by McBride (1997). He believes one third of original items needs to be deleted in any test. The findings of this research are in line with earlier studies where speaking, vocabulary, listening and reading were found to cause disparities among examinees’ performance and caused DIF (Grabe, 2009; Koda, 2005). Tittle (1982) and Clauser (1990) suggest such items might cause the target group to be less inspired on the exam. Simultaneously, there are other unknown sources that may cause DIF. In light of the fact that DIF is usually scrutinized when comparing innumerable groups of students is concerned, a big DIF value illustrates the presence of extra construct that may lead to the alterations/distinctions among the test takers. All in all, it is highly recommended that the test-developers utilize DIF analysis as a significant aspect of their programs to augment the assessment procedures. Mixing statistical analysis with the researchers’ knowledge and skills might help the test developers realize whether DIF tagged items are fair or not.
With regard to the findings of this study, it can be taken as read that when data was divided according to variable under study, different variations of variables arose. In this study, twenty out of 91 items have been detected as items flagging DIF. As a general finding, those test takers whose academic major was Science outperformed the Engineering students especially in S&W and Reading sections. S&W and Reading play pivotal role in any language proficiency test and are therefore substantial to dedicate further time and energy in learning context to teach these parts more systematically. Learners should be assisted to have a better appreciation of the implication and importance of these factors and do their best to ameliorate in these skills. This study has some implications for PTE test developers and those who take the test. The former are highly recommended to conduct more studies to identify the items that may flag DIF and take care of the researchers’ findings in this regard, and the latter can be guaranteed that the test scores are not favored against any specific type of examinees. Nonetheless, given that the gender is also a contributing factor, it is recommended to perform a post hoc study to inspect the influence of gender variable and find the items that cause DIF owing to that variable. Another point worth suggesting for future studies is to contemplate how other variables consisting of participants’ background knowledge, test wise-ness, L1, culture, etc. would disclose more information about the items showing DIF. The IRT model permits the researchers to access to a noticeable explanation of bias that is convenient to realize and construe. The outcomes of this study help test-developers to distinguish sources of bias. It is vital to recap that test developers’ decisive interests may place in the kind of decisions that are made based on test’s scores as test takers’ conditions depend upon such verdicts in future either partially or impartially. Recent methods in psychometric analysis are proposed to be established and applied in further studies as new novelties might permit the researchers to do experimental investigations and it may upsurge the accuracy of measurement.
DIF: Differential Item functioning
IRT: Item Response Theory
PTE: Pearson Test of English
LR: Likelihood Ratio
ICC: Item Characteristic Curve
TID: Transformed Item Difficulty
SAT: Scholastic Aptitude Test
FCAT: Florida Comprehensive Achievement Test
GMAC: Graduate Management Admission Council
CEFR: Common European Framework of Reference for Languages
VUE: Virtual User Environment
GMAT: Graduate Management Admission Test
Dear Editorial Team, Clinical Medical Reviews and Reports. My experience with the journal was highly positive. The peer-review process was rigorous, constructive, and completed in a timely manner. The reviewers provided valuable comments that helped improve the quality and clarity of our manuscript. The editorial office was professional, responsive, and supportive throughout all stages of the publication process. Communication was clear and efficient, and any questions were addressed promptly. Overall, I found the journal to maintain high scientific standards and an excellent publication workflow. I would be pleased to consider submitting future work to this journal. Best wishes from, Elena Popa.

It was my pleasure to submit my testimonial concerning the Reviewer Board of our Scientific Journal “Brain and Neurological Disorders”. The Reviewers focused on some modifications and their contribution was helpful. The ladies of our Editorial Office were also supported my efforts. It was my honor to have such a co-operation and I am looking forward for more collaboration.

Dear Grace Pierce, Editorial Coordinator of Journal of Clinical Research and Reports, Thank you for the speedy and efficient peer review process. I appreciate the fact that your peer reviewers do not take months to respond like with some other journals. I would also like to thank the editorial office for responding quickly to my questions. It is an excellent journal. I plan to submit more manuscripts in the future. Best wishes from, Robert W. McGee

Dear Grace Pierce, Editorial Coordinator of Journal of Clinical Research and Reports, Working with you and your team on our recent publication in JCRR has been a truly wonderful and enjoyable experience. The responses were prompt, and the reviewers were patient, constructive, and highly professional. One reviewer in particular gave me the feeling that a professor was carefully reading and commenting on my coursework, which was deeply touching. The entire process was straightforward and hassle‑free, with no tedious online forms to complete. I highly recommend this journal. Best wishes from, DR Aibing Rao, Head of R&D

I Appreciate the Opportunity to Share my Experience with the Journal of Clinical Research and Reports. The peer review process was timely and constructive, and the feedback provided helped improve the quality of our manuscript. The editorial office was professional, responsive, and supportive throughout the process, ensuring smooth communication and efficient handling of the submission. Overall, it was a positive experience collaborating with your team.

Dear Mercy Grace, Editorial Coordinator of Obstetrics Gynecology and Reproductive Sciences, We would like to express our gratitude for your help at all stages of publishing and editing the article. The editors of the magazine answer all the necessary questions and help at every stage. We will definitely continue to cooperate and publish other works in the Obstetrics Gynecology and Reproductive Sciences! Best wishes from, Alla Konstantinovna Politova,
